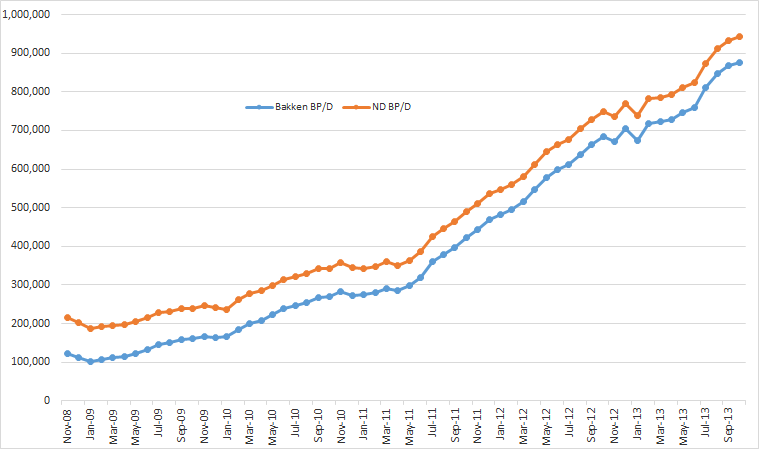
The Bakken production data published by North Dakota is out with October production data. ND Monthly Bakken Oil Production Statistics (Bakken Only) and ND Monthly Oil Production Statistics (All North Dakota).
The below chart is North Dakota Bakken barrels per day and All North Dakota Barrels per day. As you can see it’s mostly Bakken and very little “the rest of North Dakota.
It looks like there is a pattern developing. I charted the month to month percent change in the chart below with a line indicating a possible trend.
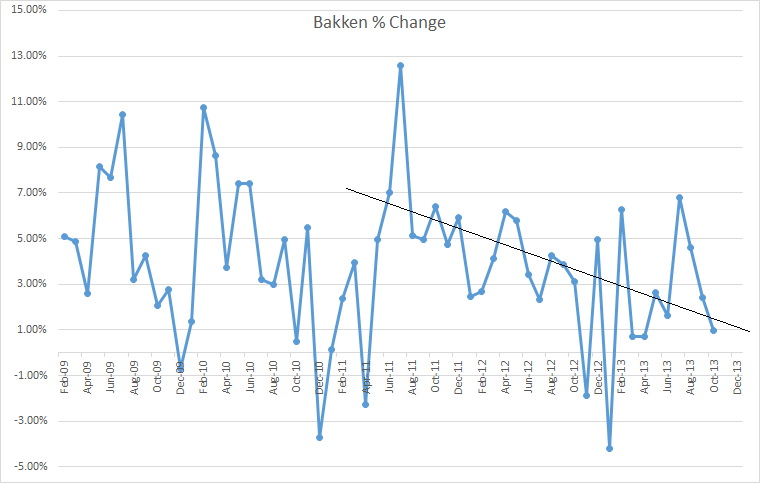
Basically I think you can ignore everything before July 2011. That is because that was the month the surge started, additional wells almost tripled that month and Bakken production has tripled since that date.
From the Director’s Cut:
The drilling rig count was unchanged from Sep to Oct and the number of well
completions dropped only slightly from 225 to 202, resulting in only a 1% increase in oil
production. All McKenzie County roads were shut down for 3-4 days due to rain.
McKenzie County has 1/3 of the drilling rigs and 29% of state production. This means
production likely would have been 10,000-15,000 barrels per day higher without that
weather event. Days from spud to initial production increased from 100 to 114. The
uncertainty surrounding federal policies on taxation and hydraulic fracturing regulation
continues to make investors nervous.
We estimate that at the end of Oct there were about 460 wells waiting on completion
services, a decrease of 40.
202 wells were completed in October but production was up less than 1%. Production was up 8,495 bp/d in the Bakken and 8,652 bp/d in all North Dakota. I think that my previous estimate of 150 to 155 new well completions in order to keep production flat was a bit low. If we had only 17o new wells completed in October I don’t think there is any doubt that production would have been down. But perhaps in good weather when all roads were open then 155 wells would have been enough.
Actual change (increase) in Barrels Per Day:
| Jul-13 | 51,510 |
| Aug-13 | 37,482 |
| Sep-13 | 20,359 |
| Oct-13 | 8,495 |
Additional wells were 195 in the Bakken and 211 in all North Dakota. Additional wells are new wells + shut in wells re-opened – wells shut in. So that number could be either more or less than new wells.
Helms gives us the price of oil, presumably the price Bakken producers are getting:
Sep Sweet Crude Price = $92.96/barrel
Oct Sweet Crude Price = $85.16/barrel
Nov Sweet Crude Price = $71.42/barrel
Today Sweet Crude Price = $73.00/barrel
Apparently Bakken crude does not fetch the same price as WTI. That is understandable because Bakken crude is so light it can almost be considered as condensate. The reason for this is this is really “tight oil”, so tight that only the smallest molecules can escape.
Bakken Barrels per day per well is charted below. As you can see bpd per well had started to drop pretty dramatically before the surge. Then almost tripling the number of new wells per month increased the bp/d per well quite fast. Now it appears to be dropping again. Of course it this is expected as all those old wells are declining quite rapidly.
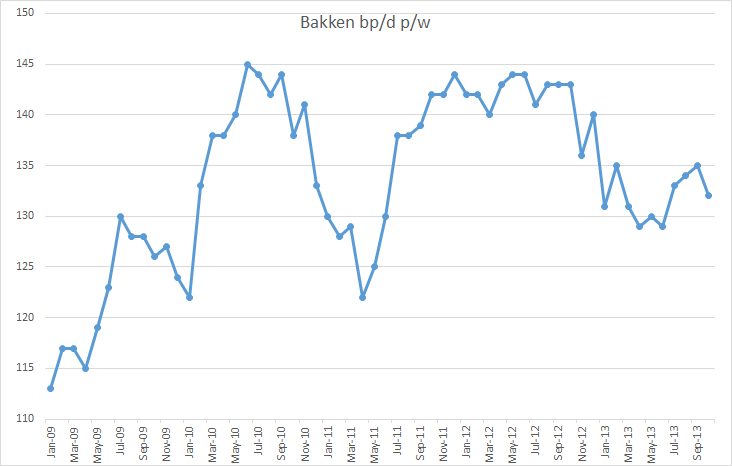
Bakken barrels per day per well had started to recover somewhat to 135 after dropping to 129 but dropped back down to 132 in October. Bp/d per well reached a post surge high 144 back in May and June f 2012.
EDIT: It made the Bakken Breakout: Oil production increasing at a slower pace
EDIT: And a couple of other really important stories on the web: Inexpensive oil vanishing at alarming rate And: Some ND drilling ‘becoming uneconomic’
95 responses to “Bakken Update, Is Production Slowing Down?”
Will Bakken someday be viewed as a colossal waste of money — so much time, money, and energy spent for such a short term bump in production? Nah. By the time it becomes apparent how pitiful its contribution was the world will be in such a condition that people will be far more concerned about other aspects of their lives, such as finding employment and putting food on the table.
Even so, the rapid production growth is a remarkable achievement. Truly oil is a magic liquid. I think we have only begun to understand the lengths humans will go to to attain it.
Good news! I have been trying all day to get the comment threading working properly and may have succeeded. Try it out, to confirm please. Thanks
DC
So the Bakken Gap to WTI has widened again. With the Bernstein Report from a few months ago talking about how Margin Costs of Production have skyrocketed since 2011, I wonder how how much profit the companys are still making.
Bit of a calculation heads up. Weather events can’t be offset by well count. Yes, poor weather shuts roads and fracking trucks can’t get to the wells, but there’s more to it than that.
Wells already completed can’t ship their oil.
This means that completion count won’t map directly to production. A month’s completion count of X in a month of Y decline rate may produce a different oil output total than a completion count of X in a month of that same decline rate if there was a day or two when oil tankers couldn’t roll. That weather event may impact completion speed, but that already takes over 100 days so you would not see much effect in just 1 thirty day month. The oil tanker trucks will have much more impact on the output total.
In other words, our efforts to identify completion count required to do this or that to production are going to fail in both directions. Weather stops oil flowing from wells already drilled. If there were pipelines, the analysis would work. But not with trucks.
This is attention getting in the Dir Cut:
Sep Permitting: 287 drilling and 2 seismic
Oct Permitting: 267 drilling and 5 seismic
Nov Permitting: 232 drilling and 1 seismic (all time high was 370 in 10/2012)
I was going to try to find seasonal equivalents, but it’s right there in the parentheses. 100 fewer drilling permits sought vs last year in the same seasonal time frame. Someone knows something.
The sudden drop in bakken oil prices seems odd (oil price is supposed to follow other oil prices to some extent) and important? It is not a trend that could easily be supported for very long. Any ideas what is behind a 20 + % drop in three months?
The production volume of a well isn’t usually determined by a tanker truck drawing the oil from the on suet storage tanks. That would be a sales volume. Production volumes are usually determined by running a well test on the well. The production is calculated by multiplying the rate from the well test by the uptime. The oilfield is getting quite hi-tech these days and lots of wells have meters and production is measured directly. I don’t know what they are doing in the Bakken. I would guess some of both. In any case, it wouldn’t be impacted by the ability of a tanker truck to get to the site. A well would shut-in if the on site tank is filled, but I think that would be pretty localized and the monthly impact would relatively small. Especially if it was only a a couple days.
Slim wrote: That would be a sales volume. Production volumes are usually determined by running a well test on the well. The production is calculated by multiplying the rate from the well test by the uptime.
I don’t think that would work very well in the Bakken because the rate would change every day. The average decline rate of a Bakken well is about .o2 percent per day. For some it would be higher and for some it would be lower. But the flow rate you measured on the first day would be totally different from the flow rate a week later.
Hi Ron,
I think he means a well test is run daily. No doubt they can measure well output and as he points out, production and sales are different things. Now if they run out of room in any storage facilities that might exist, then the wells get shut off temporarily. In North Dakota this stuff happens a lot in winter, though the mud season may be more of a problem. They are pretty adept at clearing snow from roads in North Dakota.
DC
“I would guess some of both. In any case, it wouldn’t be impacted by the ability of a tanker truck to get to the site. A well would shut-in if the on site tank is filled”
http://www.thebakken.com/articles/80/oil-tank-trailblazers
Looks like three or four 400 barrel tanks on a pad. If the pad has 8 wells producing 800 bpd . . . . But that’s invalid because we’re talking about non brand new wells. Call it down to 300 bpd. That’s 2400 bpd from that pad the trucks can’t get to?
This on site tank point Slim makes is solid and valid. But it looks like on site storage could be overwhelmed and hell, 3 days of a single 2400 bpd 8-well pad can turn NDak negative. The peak is that close. And of course we are talking about multiple pads shut in.
Maybe there’s more tank storage on these pads than 1600 barrels worth. One would ask why?
Watcher, the average well in the Bakken produces 132 barrels per day. Don’t take my word for it, that is what the North Dakota Oil Production Statistics say. So 300 barrels per day would be well over twice as much as the average well produces.
Also interesting:
http://www.oiltrailersales.com/crude.html
That guy does 250 barrels.
I know almost nothing at all about oil wells, but storage tanks are obviously very costly affairs.
Maybe the bean counters have made the decision that shutting in a given well occasionally due to bad weather is better for the bottom line than building larger on site storage tanks- the spreadsheet may indicate the extra capacity might not come into play often enough to justify the cost of it, given that the production of these wells declines so fast.
A well producing a hundred barrels a say can fill a five hundred barrel tank in five days- but if after two or three years it takes eight or ten days to fill that same tank – and it is expected that the roads will seldom be closed for more than ten days at a stretch…….
Partially filled tanks can be emptied ahead of schedule in the event of a predicted stretch of bad weather assuming enough trucks are available.
A tank that looks to be barely adequate the first year looks to be way oversized after two or three years.It might take a whole month to fill it up after four or five years!
Now if they are mounted on skids and therefore can be moved easily to a new well bigger tanks might be the way to go as they could be used too good advantage that way.
It’s easy to move very large and very heavy equipment on privately maintained gravel roads with no weight limit, no length, height and width limits to contend with .
This last consideration wouldn’t apply to the tank trucks , however, as they presumably do travel mostly on public highways and are therefore subject to being severely fined for being overweight.
Ron, you could very well be correct. I worked with lots of production allocation systems, but it was before the shale boom. Well tests were the standard. There has been a move to automate and add more metering. I would think that well testing would still have to be done at some point or you couldn’t allocate the wellhead production back to the wellbore completion. Times have changed quickly though.
Slim
Regarding the drop in price for Bakken verses WTI: Some of the drop could be due to a restriction in capacity for railroads to haul the oil to California, east coast, Midwest and Gulf of Mexico refineries. Today the BNSF had over 100 stalled trains between Spokane and Minneapolis due to a “system meltdown”. Too many trains (especially unit trains carrying oil) on rail lines that have limited capacity. A few trains broke down and now the whole system has ground to a halt. Amtrak has had to suspend service on one of the two BNSF lines that serve Bakken area because its passenger trains were running almost 24 hours late. See lead article at http://www.narprail.org
“So 300 barrels per day would be well over twice as much as the average well produces.”
Sounds right, but that’s not the issue. The issue is what happens at the pads producing more than the average per well when the tanker trucks can’t get there for several days. All you have to do is lose a few days on, say, just three multi well pads putting out 2000 bpd each and presto, 3 X 2000 X 3 days and say goodbye to 18,000 bpd for that month.
Slim is suggesting production still gets logged even if the trucks can’t roll, provided the onsite tanks haven’t been filled. So . . . it would be nice to know total tank size at a multi well pad. That would tell us how many days of no trucks would overflow the tanks and compel shut down.
Wait, that’s not right. Lose 3 days of 3 pads of 2000 bpd each is a loss of 18,000 barrels, not 18,000 bpd. So it loses 18,000 / 30 or 600 bpd off the month’s total, not 18K. Of course, the weather event hits entire counties so limiting it to 3 pads is probably bogus. It would be far more.
Still wondering were the price of this LTO in ND is headed. Is it possible they maxed out their transport to market; trains, trucks, and pipelines? This might cause that kind of sudden drop.
@Donn Hewes,
Lac Megantic haapened at the end of July. It was volatile and very flammble Bakken LTO in those DOT 111 tanker cars that Destroyed Lac Megantic.
The Bakken LTO was headed to the Irving refinery in New Brunswick on the MM&A line. The MM&A has been closed since the tragedy (it may have just reopened). If the price of Bakken oil follows demand the loss of the demand from Irving because of the MM&A closure should account for the drop in price. That said there is a lag, September price was still robust, that may have been a forward price.
The deadly secret behind the Lac-Mégantic inferno
VIDEO: How oil from the U.S. Bakken formation decimated Lac-Mégantic
Transport Canada searches Irving offices in Lac-Mégantic probe : Search warrant obtained for company’s offices in Saint John
CBC News Posted: Dec 13, 2013 2:31 PM ET
Folks, I posted the link up top, at the bottom of the post, but I thought I would put it here also. This is a peak oil story if one ever existed. Inexpensive oil vanishing at alarming rate
The United States is awash in shale oil. Iran, once OPEC’s second-largest producer, is slowly ramping up output. Oil consumption growth in the Western world has been somewhere between negative and flat since the 2008 financial crisis. The “peak oil” theory has pretty much vanished, along with The Oil Drum, the bible of peak oil believers. Rest in peace.
Or turn in your grave, for the oil price charts tell a different story.
My comment on the Peakoil.com website:
My usual comment about higher annual oil price highs and higher annual oil price lows:
We have of course seen a cyclical pattern of higher annual highs and higher annual lows in global (Brent) crude oil prices in recent years, but I think that the rates of change between successive annual price lows, or troughs following annual oil price peaks, is very interesting.
Cyclical Peak to Trough Annual Brent Crude Oil Prices, 1997 to 2013
1997: $19
1998: $13
2000: $29
2001: $24 (1998 to 2001 rate of change: +20%/year)
2008: $97
2009: $62 (2001 to 2009 rate of change: +12%/year)
The 11 year 1998 to 2009 overall of change in trough prices was 14%/year. And then we have 2012 to 2013.
2012: $112
2013: $108 (Est. price)
Based on estimated price for 2013, the four year 2009 to 2013 rate of change in the trough price would be 14%/year ($62 to $108).
The long term 15 year 1998 to 2013 rate of change in trough prices would also be 14%/year ($13 to $108).
If the (+14%/year rate of change) pattern holds, and we were see a year over year decline in annual Brent crude oil prices in 2017, it would be down to an annual Brent price of about $190 in 2017.
Following is an an excerpt from a recent OECD study which forecasts sharply higher global crude oil demand (and potentially) much higher oil prices:
“A return to world [economic] growth to slightly below pre-crisis rates would be consistent with an increase in the price of Brent crude to far above the early-2012 levels by 2020. This increase would be mostly driven by higher demand from non-OECD economies – in particular China and India. The expected rise in the oil price is unlikely to be smooth. Sudden changes in the supply or demand of oil can have very large effects on the price in the short run.”
Source: http://www.financialsense.com/contributors/joseph-dancy/oecd-study-forecasts-sharply-higher-global-crude-oil-demand
TM Talks – The Shale Boom h/t SfV
http://www.youtube.com/watch?v=ds8eek0e8qM
What is an LTO?
Ron:
There is no where on the web that I am aware of that one where the most important oil issues of the day are addressed, but here! I always look forward to this news and analysis!
Thank ,you!
Can I toot my horn a little?
Here is my comment on last month’s Bakken report:
Coolreit says:
NOVEMBER 16, 2013 AT 4:03 PM
Ron:
“If August MOM production growth was 37k and September MOM production growth was 20k, a simple calculation might suggest October MOM growth would drop to 3k (37k minus 20k). The same logic could have been applied to the prior month as well. If July MOM production growth was 53k and August MOM production growth was 37k, a simple calculation might suggest September MOM growth would drop to 16k (53k minus 37k). It actually dropped to 20k, which was not far off.
Why do you think it will be nearly 1.25 years before we turn over? I would tend to agree with Watcher based on a very simple model.”
I suggested 3k b/d increase, which is not too far off from the 8k b/d increase. I got a lot of help from the weather, but weather happens especially in winter.
Got it!
LTO= Light tight oil.
For those interested in a good summary of the current disputer over the islands and oil between china and Japan, this is where you will find it:
http://peakenergy.blogspot.co.uk
This is Big Gav’s (from the old TOD ) blog and he has done really good job on this issue including the history of the islands and lots of good links.
Sorry folks you will have to copy and paste since I don’t know how to post the link so it works properly.
I suppose I don’t have to know, it works automatically on this blog!
Some others don’t make it so easy.
Ron,
Yes, that Globe and Mail article says it all doesn’t it? You, Jeff Brown, et al are doing an excellent job but I’m afraid, tragically, you’re largely preaching to the choir. And, with respect, it doesn’t really make any difference if North Dakota peaks in 2005 or 2025 when most giants/super giants around the globe are in terminal decline. To me the North Sea example, as you said earlier, proves that nothing meaningful will be done to avert impending disaster.
A tidbit that gets ignored in talk of Senkaku. Japanese education.
The Japanese are taught from primary school onward that they got nuked in World War II because of oil. They were doing a resource grab for manchuria (including the now Chinese oil fields there) when FDR imposed an oil embargo on them in Aug 1941. Their only other source would be Indonesia. The point being, like the US decided in the 1970s oil embargo (refusing to abandon Israel), a decision was made that oil embargo could not be allowed to define national policy. They did what the US did 30 years later. They refused to change policy. So to secure the Indonesian flow from possible interdiction, the US Pacific Fleet at Pearl Harbor had to be destroyed.
They are taught this from the earliest ages. They are the only country to ever be nuked in war and it happened because they have no domestic oil. No domestic oil is a very deep concept embedded into all of their brains.
Now that “they finally found some”, China seems about to “steal” it. The rest of the world is not calibrated at all on how deeply intense Japanese feelings are about this oil (islands).
Watcher,
I read, write and speak Japanese and, as such, have read prewar and postwar school books, starting with kindergarten, which support almost everything you’ve said. In fact, I’ve never met a Japanese person from the school child to University a Tokyo professor who doesn’t believe WW2 was about the West (the US) trying to restrict Japan’s access to natural resources — oil! Sometimes these conversations had to be lubricated with a glass of beer or some sake first. And, actually, I’m neutral on this.
Rune Likvern just posted me this link: Some ND drilling ‘becoming uneconomic’
Oil production from North Dakota continues to skyrocket but drilling has become uneconomic in some parts of the state due to falling oil prices, the state’s top oil regulator said according to a report.
With the price of North Dakota Sweet crude oil falling to around $72 a barrel from around $95 in July, drilling parts of the prolific Bakken shale oil formation has stopped making commercial sense, the head of the department, Lynn Helms, said according to the news wire.
What he is basically saying, in the rest of the article, is that drilling in places where you know the wells will be low producers, like in Billings, Divide and Golden Valley counties is no longer economical with oil prices $72 a barrel.
Worth speculating whether the ND Bakken ever hits a million bopd?
It will get to 1 million barrels per day unless prices drop on the west and east coast where Brent prices are paid for crude oil. My model assumes $12 transport costs and$97 /barrel at the refinery gate until mid 2015 and then a rise in prices following the EIA reference oil price scenario (from AEO 2013) so a net price at the wellhead of $85 per barrel. If prices are lower for an extended period then the Bakken will reach 1 MMb/d later than my model predicts which is currently about March 2014, I will be surprised if it is later than July 2014, but it would be interesting to hear what Mr Likvern thinks, he follows the data much more closely than I.
DC
Good data. Note above the sharp fall in permittings for new wells. This would be part of that.
Additional per the above discussion, that article’s photo shows 5 of those 400 barrel storage tanks, and that doesn’t look like a multi well pad.
Hi Watcher,
That 370 permit number in Oct 2012 was a bit of an anomaly, the next highest month is about 287, so the Nov drop to 232 is not really a big deal, especially with 450 wells waiting on fracking services, which tend to be slower in winter weather.
DC
Ah, well the evils of single samples, even if it was of the proper season. Odd that the record high would be just before winter. The Dir Cut talks about scaling back drilling plans for winter, so it’s not like they are 9 month lead time or something like that.
What were the surrounding month numbers for 2012. If Oct was 370, what of Sept and Nov?
Watcher, you can go here: BakkenBlog and get all the drilling permits for every month in 2013. Or you can go here: North Dakota Industrial Commission, Department of Mineral Resources, Oil and Gas Division, home page. Then click on “View past director’s cuts”. That will take you here: Director’s Cut Archive Anyway here are the numbers you asked for in 2012.
Aug Permitting: 261 drilling and 1 seismic
Sep Permitting: 273 drilling and 0 seismic
Oct Permitting: 370 drilling and 0 seismic
Nov Permitting: 211 drilling and 0 seismic
Dec Permitting: 154 drilling and 1 seismic
Hi Watcher,
https://www.dmr.nd.gov/oilgas/directorscut/directorscutarchive.asp
The link above gives you most of the director’s cuts.
“Sep Permitting: 273 drilling and 0 seismic
Oct Permitting: 370 drilling and 0 seismic
Nov Permitting: 211 drilling and 0 seismic (all time high was 370 in Oct 2012)”
from the 12/17/2012 Director’s cut. Note that the 287 (second highest number I saw) was from Sept 2013.
DC
Ron you are too quick for me. 🙂
The numbers for 2013 from July to November are:
179, 277, 288, 266, 226 (using the Bakken blog numbers from Ron’s link above) note that these are slightly different from the numbers in the directors cut (but only a little different Sept is one higher than the most recent director’s cut (12/13/2013) and the Nov # is 6 less for the blog vs director’s cut. For the past 2 years the data has mostly been in the 250 to 300 range for August to Oct and then falls below 250 in Nov.
DC
Nod. Permits flat to increasing. No evidence of price impediment there — though the price issue is recent.
Nice that the comment reply function works now.
We can only go to 6 levels deep.
DC
I have changed this to 8 levels deep. We will see how ell it works.
DC
You can also get monthly 2012 permit counts and end-of-year production data from https://www.dmr.nd.gov/oilgas/stats/2012monthlystats.pdf
Replace 2012 in that URL and you will get equivalent reports from other years
At this point 2 million bpd is looking more and more guaranteed. Look at the well densities the companies are going with (http://www.petroleumnewsbakken.com/pnfriends/379596524.shtml). With 15000 sq feet to work with in ND alone there’s going to be 80,000 to over 100,000 wells at least there. Clearly still decades of drilling to come.
Hi Don,
The assumption that the closer well spacing will not change the average new well estimated ultimate recovery (EUR) is not a good one. If real oil prices in Dec 2013 $ rise to $500/barrel we might see 100,000 wells in the North Dakota Bakken. If oil prices follow the EIA’s AEO2013 reference scenario and well costs (for drilling and fracking) fall to 7 million real $ in early 2017, but can fall no further due to limits on how much new methods can reduce costs. Then 1.2 to 1.4 MMb/d will be the limit.
DC
Don, you are also forgetting about the Red Queen. According to the EIA’s Drilling Productivity Report Bakken production is declining by over 60,000 barrels per day per month. But the North Dakota Bakken production increased by about 8,500 barrels per day in October. That means production had to actually increase by 68,500 barrels per day due to new wells. Subtract the ole well decline from that and you are left with 8,500 bp/d.
But here is the main thing you fail to understand. The EIA says, if you do the math, that the Bakken is declining by about 6.3 percent per month. That means that when the Bakken reaches 1 million bp/d the decline will be 63,000 bp/d per month. And if they ever reach 1.5 million barrels per day then the decline would by 94,500 bp/d. That is production from new wells would have to reach almost 95 thousand barrels per day just to keep production flat at 1.5 million barrels per day. There is, in my opinion anyway, no way that is going to happen.
At some point, perhaps just above the 1 million barrels per day level, they will reach the point where new well production will just barely keep up with decline. Then as they move further away from the sweet spots, and decline caused by closer well spacing, the decline will overtake new well production and the Bakken will go into permanent decline.
I am betting that North Dakota production will peak at about 1.1 to 1.2 million barrels per day sometime late 2014 or early 2015.
I agree Ron, but think the EIA estimates you are using are a bit high, remember that the EIA DPR includes Montana, if we want to restrict our view to the North Dakota Bakken, then we need to estimate the legacy decline in Montana and then deduct this from the total legacy decline given in the DPR. You just take total production from the NDIC and deduct this from the total in the DPR to get the Montana estimate. Then you would need to assume that the new well output from Montana is proportional to the relative number of active rigs (about 6% of the total Williston Basin rigs are in Montana according to Baker Hughes). Basically the legacy decline is less than the DPR, but it bounces around a lot so that a 13 month average is needed for smoothing. The Montana production numbers in the DPR are also off they seem to be using all MT C+C, but Bakeen Three Forks is about half of that, so the DPR is pretty far off in many respects and should be discounted to a large degree until they improve the report.
Nonetheless, my model suggests your guess is a good one, it might be 6 months early, but that depends on price and on how fast new well EUR decreases and my model has to guess at both of those.
DC
Dennis, it really doesn’t really matter. 6.3 percent is 6.3 percent whether we are talking about the total Bakken or just the North Dakota portion of it. And I was talking about only the North Dakota Bakken when I predicted the peak to be somewhere between 1.1 and 1.2 mb/d.
6.3 percent of October North Dakota Bakken production would have been about 55,200 barrels per day. So Bakken production from new wells must have been around 64,000 barrels per day. With good weather it probably would have been closer to 75,000 barrels per day. At 75 kb/d production from new wells they would run smack into the Red Queen 1,200,000 barrels per day.
To my mind the question is, at what level of production will the North Dakota Bakken peak, not in what month or year will they peak. I am betting they will not surpass 1.2 million barrels per day.
Hi Ron,
My point was, that you should not necessarily trust the EIA estimate. For North Dakota Bakken the average legacy decline for the 13 months up to Sept 2013 was 43 kb/d, if we assume 1st month average production for new wells was 400 b/d. (This uses NDIC data and the 400 b/month 1st month assumption.) This number has remained steady the last 7 months. The EIA DPR report is pretty bad for many reasons, you pointed out other problems in a previous post.
DC
Nevertheless, 6.3% per month works out to be only 54% per year. I have seen other estimates as high as 70% per year.
Therefore I stand by my estimated maximum of 1.2 mb/d for the North Dakota Bakken.
The 54 % per year is correct if the 6.3 % is correct (which I would estimate at about 5 %). Also it doesn’t remain at 5%, the rate of decline will decrease as a higher percentage of production comes from older wells, once break even is reached and the rate of new wells added slows down (likely within a year or two of the peak).
Realistic models suggest the rate of field decline will be at most 35% per year and this will last only a year to 18 months and then the rate of field decline will moderate to 10% or less. In fact when I have presented scenarios with 30 to 35% field decline in the Eagle Ford and Bakken combined (in the 2015 to 2018 period), you have commented that the model was unrealistic because the decline was too steep.
http://peakoilbarrel.com/world-oil-production-peak/
In the comments to the post linked above I presented charts such as
You responded:
“Dennis, one thing I notice about all your models is that you have all of them showing a very sharp peak, up very steep and then down very steep. I just don’t think that is how things are going to play out. The Bakken, next year, will not show the same rate of increase as it did this year. And then in 2015, if it is still increasing, the increase will be very little.
Once either the Bakken or Eagle Ford approaches the peak, you will see any increase slow down dramatically, then slowly roll over. The first year of decline will likely see only a small decline before things speed up the following year.”
Note that I have not changed my scenarios very much, but I shortened the time scale on the Bakken/Eagle Ford chart so it doesn’t appear to be as sharp a peak.
Also note that the way the economics works out, the peak is reached in part because the EUR of new wells decreases(in fact if it does not, a peak will not occur for many years and the USGS estimates will be far too low.) When the EUR of new wells drops to about 75% of the Jan 2013 average well (from 430 kb to 320kb for 30 year EUR), then the peak is reached and breakeven is reached within 6 to 12 months as the EUR continues to fall. When that point is reached it is assumed that oil companies scale back the number of new wells added and production drops steeply as a result.
The main point is that these scenarios have an annual rate of decline for Bakken/Eagle Ford output of 30% at most. Part of the difference between your 54 % estimate and 30 % is because the addition of new wells continues, but at a slower rate. For the Bakken, if we create a scenario where no new wells are added after Dec2013 for 5 years, we get an annual rate of legacy decline of 53% for the first month, but this drops quickly to a 12 month average annual legacy decline of 36% for year 1, 22% for year2, 16% for year 3, and 13% for year 4. If you think the legacy decline rate is actually higher than this, then you would also tend to think my scenarios are not steep enough. In addition if you think we may reach 1.2 MMb/d in 2015, the Bakken scenario used to find legacy decline above in year 1, 2, 3 and 4 would reach 1.2 MMb/d in 2016 if 175 wells per month were added from Nov 2013 to Dec 2016 (rather than the 0 wells used to determine legacy decline). If you expect the Bakken may reach 1.2 MMb/d over the next 13 or 14 months, then a certain steepness between now and the peak has to occur, if my economic assumptions and model (both of which follow Rune Likvern’s very closely for the Bakken) are correct, then profitability considerations require the steepness on the backside of the peak (assuming a TRR of 8 Gb to match the USGS mean estimate for the ND Bakken).
Sorry for not keeping it simple, the analysis is not straightforward if done well. The world is anything but simple, good models reflect that to some extent.
DC
Geologically, low permeability is low permeability. If oil can’t flow to a well from behind a fracking distance, then previous wells didn’t drain oil from beyond that fracking distance. Denser infill could get more oil if the distances support it, per that Continental briefing from the previous thread.
The limit I would look at is the truck total and weight and fracking material totals. They complete 200-300 wells per month now. There’s no sign of a sharp increase in rig total or fracking equipment total, in fact, the days to complete is now well over 100. So even if you drill and complete denser, you can’t drill and complete faster. Remember, the majority of oil output is from new wells. The old wells die fast.
So even if you infill drill, you won’t be able to do it relentlessly faster due to sheer material availability.
With regard to the title of this post, “Bakken Update; Is Production Slowing Down?”, please note that your chart shows three of the last four years has a November production slowdown. I don’t think we will be able to see the peak until we see a slowdown that is clearly unaffected by weather (and new well count).
Joe, you can see things clearer when looking at the 12 month average of barrels increase per month. That 12 month average reached a peak of 23,256 bp/d increase in May of 2012. In spite of a record monthly increase of a 51,500 bp/d increase in July and a 37,500 bp/d increase in August, the 12 month average is still over 7,000 bp/d below the peak in May 2012. The 12 month average increase in production now stands at 16,064 barrels per day per month.
I don’t think there is any question as to whether or not the increase in production is slowing down. It most definitely is.
Hi Ron,
The 70 % decline in the first year refers to a single well, not to the entire field, which is a mix of old and new wells. I am not sure where your 1.2 MMb/d maximum rate comes from, but it seems your logic is based mostly on a flawed DPR report, though I could be mistaken, I do not want to put words in your mouth as they say. Could you explain how you arrive at a 1.2 MMb/d maximum? Doesn’t that 6.3 % decline (I assume this means legacy decline) rely on the assumption that the Montana and Bakken decline is the same? Do we know if that is a valid assumption?
Why not just use the NDIC data and David Hughes estimate of 400 b/month to construct our own legacy decline for the ND Bakken? When we do that we find the legacy decline is about 43 kb/month for the most recent 13 month average which would be about 5 %, it has been at this about this level for the 13 month average going back 7 months. Note that 108 wells should keep the output level if those wells average 400 b/month and poor weather does not intervene.
Note that my estimates agree with yours (based on my models which make many assumptions which the future will likely show to be incorrect.) The only difference is that I would say the maximum is likely to be about 1.3 MMb/d, but it could be as much as 1.6 MMb/d or as low as 1 MMb/d, it depends on how good my assumptions prove to be (and how the accuracy of the most recent USGS estimate of Bakken/Three Forks undiscovered TRR.)
DC
Yes, I know the 70% comes from individual wells but I consider a 6.3% per month a very conservative estimate.
Montana is a non-entity here. Their production is flat to down. They have already peaked and will simply be a drag on total Bakken production. For all practical purposes we can use the North Dakota production and decline numbers and get valid conclusions.
Montana Field Production of Crude Oil
Where does the 6.3 % estimate come from? I thought that came from the EIA’s DPR report, or am I missing something? I agree the Montana Bakken is not that important, but including Montana in the legacy decline numbers as the EIA does tends to “muddy the waters” as it were.
It all depends on the well profile of the average well, the date that the EUR of the average well begins to decrease, how many months it takes for the new well EUR to reach its maximum rate of decrease, and the rate that new wells are added each month. Reasonable scenarios (200 new wells added per month, New well EUR starting to decrease in June 2015 and reaching a maximum rate of decrease 24 months later [35 % maximum annual rate of decrease in new well EUR], with a total TRR of 8.5 BBO from 1953 to 2073) can be created with a peak of 1.4 MMb/d in late 2016. I do not think this is the most likely scenario, my point is that 1.2 MMb/d may not be the maximum. Predictions are difficult especially about the future :).
DC
Too narrow for a chart, I will reply below.
Excellent on the comment indentation. Six levels seems fine to me. Other blogs go deeper and the comment eventually winds up 1 word wide streaming down the page.
Article last night, will find link . . . Helms says November will have a nice gain and December will be very poor, based on weather.
ExxonMobil ‘set for Greenland exit’
Looks like a giant money hole.
Despite the promise of high resource potential, the Greenland blocks on offer will require spending of around $500 million on seismic surveys and drilling of up to two exploration wells over the 16-year licence term, according to BMP director Jorgen Hammeken-Holm.
However, he does not expect drilling to kick off for at least another 10 years due to the need to develop new technology to tackle challenging Arctic conditions off east Greenland including extreme sub-zero temperatures, icebergs and year-round ice.
That’s about as gloomy an exploration article as I’ve seen from upstreamonline. That reporter will start having trouble getting quotes.
These new blocks for sale that Exxon is ignoring are on the east coast of Greenland. Meanwhile on the west coast of Greenland
UK independent Cairn Energy failed to make a discovery during an earlier extensive two-year, multi-billion dollar campaign off west Greenland in 2010 and 2011 that is believed to be one of the most costly ever carried out by an explorer.
“Apparently Bakken crude does not fetch the same price as WTI. That is understandable because Bakken crude is so light it can almost be considered as condensate. ”
Question: What is the market price for a barrel of LTO?
Another question in the back of my mind is when will creditors pull the plug on extending credit to drillers that need loans to continue expansion? At some point the Bean counters are going to realize the risks exceed the cashflow and yank credit. Once that happens it will be the death of Shale Oil as creditors will unlikely finance future fields anywhere. The only hope would be if the giant firms (Exxon, Shell, etc) jump in, but that seems unlikely. Perhaps when this is all done, it will be the corporate Bankruptcy lawyers that end up profiting from shale oil drilling.
Yes, it does come from the EIA’s DPR report. But I consider that a very conservative estimate. I would actually put it a bit higher. And no, you are mistaken, putting Montana in the Legacy Decline Rate changes nothing. Their production is small and their decline rate has to be about the same. So it changes nothing. And even if their decline rate were a tad different, their production is so small it would hardly move the needle at all.
You wrote: New well EUR starting to decrease in June 2015 and reaching a maximum rate of decrease 24 months later…
??? Where, pray tell, did you get the information that a new well reaches it’s maximum rate of decrease 24 months after the first production. No, the maximum rate of decrease is in the first or second month of production. Look at the chart below and tell me if the maximum decline in nearer the first month of production or nearer the 24th month of production?
Are We Living Through a Shale Bubble?
True, this is only the average well profile but any of the wells would show the maximum decline rate very early, very near the first months production.
Hi Ron,
There is a difference between decline rate and the rate of decrease of new well EUR, I will attempt to explain below.
Imagine the cumulative production curve that goes with the curve you showed above. It starts at zero barrels at t=0 and at t= 30 years the total cumulative output is some higher number maybe 450 kb, this is called the EUR of the well, lets say it is an average well. The decline rate is the slope of the curve on your chart, which starts out as a large negative number say -70 % and gets smaller in absolute value over time (the curve gets flatter).
When I say the new well EUR decreases it means either the curve you show above, or the cumulative output curve shifts lower towards the horizontal axis. As the room to drill new wells in the sweet spots runs out the new well EUR decreases, it begins slowly and the rate of decrease in new well EUR increases over time eventually reaching some maximum rate of decrease. So if the EUR was 500 kb and decreases at 10 % per year the new well EUR would be 450 kb after year 1 and maybe 20 % per year during year 2 so the new well EUR after 2 years has decreased to 360 kb and if 20 % was the maximum then every year thereafter the new well EUR would decrease by 20 % (288, 230, 184, …). This is not the same as decline rate, it is the area under the cumulative output curve which gets closer and closer to the horizontal axis as the EUR decreases.
In the chart below the EUR decreases over time, the rate of EUR decrease is how quickly the curve moves downward. Note that this chart does not match the example I gave above where I used 500 kb to make the math easier.
DC
You know Dennis, I think the one thing most folks like about my blog is I Keep It Simple.
“This is not the same as decline rate, it is the area under the cumulative output curve which gets closer and closer to the horizontal axis as the EUR decreases.”
The statement above is incorrect, the EUR is not the area under the cumulative output curve, it is the cumulative output at some point in time, typically at 30 years.
To make it simple. The decline rate is the change in output from time1 to time 2 divided by the average output between time 1 and time 2. The EUR is the cumulative output of the well from time 0 to some later time (typically 30 years).
As the sweet spots become fully drilled ( so that there is no more room for new wells) and new wells start to be drilled in less productive areas, the EUR of the new wells decreases. In fact, the decline rate of these new wells could be exactly the same as the wells in the sweet spots, but if the first month of production is 75 % of the wells in the sweet spots and everything else (the decline rate) remains the same, then the overall EUR of the well will be 75 % of the original well (that was drilled in the sweet spot.)
If such a change in new well EUR happened over 1 year we would say the rate of decrease of new well EUR is 25 %. If it was also the maximum rate of annual decrease of new well EUR then we would call it such unless this rate decreased further the following year, we assume at some point the rate of decrease in new well EUR reaches some maximum rate as long as the rate that new wells are added remains constant.
If someone else reading this can explain this more clearly, please help.
Edit 12/17/13
In reply to Ron above I said,
“The decline rate is the slope of the curve on your chart…”
That is also not correct, the decline rate is the change in output over some period of time divided by the average output over that time period (usually presented as a percentage), it is not the slope of the curve.
Dennis Coyne
To try to make the distinction between decline rate and a decrease in the estimated ultimate recovery, let’s first make sure we know what EUR is and how it relates to a well profile.
So here is a quiz:
DC
Nobody offered an answer, oh well.
Maybe we need to think of using two different words to clarify this discussion. I think we all understand “Decline” rate. The other word that is typically used in discussing oil fields, and occasionally misused, is “depletion”. Depletion is used to describe the rate at which the oil field reserve TRR or EUR is being depleted or being used up.
For example, if a Bakken type field had a TRR of 10.o Mbbls and only one well was drilled and it initially produced 1000 b/d and the well had a linear decline rate of 60%, over one year it would produce, 255,500 bbls. The depletion rate of the field in the first year would be 255,555/10,000,00 = 2.55%. As more well are drilled, the depletion rate would increase.
I hope this doesn’t add to the confusion.
Hi Ovi,
Thanks for the suggestion. Depletion of the oil field is certainly related to the average EUR of new wells and how they may change over time. I avoided using this term because as you suggested, many times people get confused about depletion and decline an there is a tendency for people (I am not referring to Ron or anyone in particular), to conflate the two concepts or to use them interchangeably as if they were synonyms. By attempting to avoid that confusion, I have tried to consistently use the term “decrease in new well EUR”. Obviously that did not work very well.
Let’s take your example and modify it a little. The Bakken is considered a continuous resource without specific fields as such, or perhaps one could think of it as one giant field. I will do it the second way to match it with your comment above, but will modify the numbers. We will assume the Bakken is a single field with a TRR of 8 Gb and that the average well produces 430 kb over a 30 year economic life. The decline rate is not linear as I am sure you are aware, I will use a 24% average annual decline rate over 4 years, which matches my model.
As more oil gets produced it has always been a little unclear what should be used for the denominator, should we use the original TRR or the oil that remains to be produced? Also in the second year what number do we use in the numerator, cumulative output or just the output from that year? I really don’t know the answer, but when I have read papers using depletion, it seems that the term is used differently by different authors, it may be that I am the only one confused by this, whereas decline is very clear. Colin Campbell has often used the beer glass as a metaphor. So by this it would seem that the rate of depletion is yearly output divided by the TRR. For the Bakken 257 MMb were produced in the last 12 months out of a TRR of 8000 MMb or a 3.2% annual rate of depletion and 800 MMb have been produced so the field is 10% depleted. These figures were often considered important because it was assumed that the peak would occur near the 50% depletion point. My analysis suggests that the peak will be reached at about a 25 % depletion level for the Bakken. All of this leads us down a blind alley in my opinion.
I appreciate your attempt to help explain the decrease in new well EUR.
One simple way to distinguish a decrease in EUR from decline rate is that the decline rate of a well refers to the output of one well and how it is changing relative to current output levels. Early in the life of a well the decline rate is relatively high, when the well is older the decline rate is much lower. The decrease in EUR refers to the cumulative output of the average well drilled today over some time period (say 10 years for illustration) compared to the cumulative output of some future average well drilled two years from now which may have a smaller EUR because the room for new wells in the sweet spots has run out and less productive areas are being drilled at that time. The rate of decrease in average new well EUR tries to capture how quickly this decrease is occurring. Has the average new well EUR (over 10 years) decreased from 300 kb to 169 kb (about 25 % per year) or is it some other rate of decrease? I assume in my models that currently there is no decrease in new well EUR (all average wells produce at a 10 year EUR of 293 kb from 2008 to 2013) so over that period the rate of decrease of new well EUR is zero. This does not mean that the decline rate is zero.
I assume when the EUR does begin to decrease that it is a gradual process and accelerates to some maximum rate and then remains at that level as long as new wells are added at a consistent rate (typically my models use between 150 and 200 wells added per month). The model also needs to make assumptions about how long it takes the EUR decrease to reach its maximum rate of decrease from the date that the EUR decrease begins. My models usually have the EUR decrease begin in June 2014 and the maximum EUR decrease is reached 2 years later, if 175 wells per month are added from Nov 2013 for 190 months (about 40,000 wells) and the maximum annual rate of EUR decrease is 21.5%, then the TRR is 8.5 Gb and the peak is 1.2 MMb/d in 2016.
see http://oilpeakclimate.blogspot.com/2013/10/exploring-future-bakken-decrease-in.html
which explores some of these concepts and how changing the start date for the EUR decrease and the length of time to reach the maximum rate of decrease of average new well EUR, changes the model output.
Also an updated version of my interactive spreadsheet for the Bakken can be downloaded at:
https://drive.google.com/file/d/0B4nArV09d398MlFWNE5Vejd2OTQ/edit?usp=sharing
The spreadsheet does not display properly on Google Drive, but it can be downloaded by clicking on the arrow below “file” near the upper left corner of the page.
This spreadsheet allows one to try different scenarios out to 2041 for well input. The input page is the EUR decrease sheet, but you can peak behind the curtain, as it were, to see how the model works. Note that if you set the EUR decrease to 0% for an annual rate of decrease, the model doesn’t peak until you are forced to stop adding wells in Sept 2041 and output is up to 3.5 MMb/d and TRR is 40 Gb. At some point average new well EUR must decrease, if the TRR is to stay less than the upper end of the USGS estimate of 11 Gb and 150 wells per month are added, then maximum rate of avg new well EUR decrease must be 11% with the usual June 2014 start of EUR decrease and 2 years to maximum EUR decrease rate. If EUR
Edit: I changed the well profile to match the USGS Mean Bakken EUR of 365 kb (for the most productive area) which is somewhat lower than the 430 kb EUR in the previous spreadsheet. This changes some of the numbers in the comment above if using the new spreadsheet. So to match a TRR of 11 Gb, a lower Max annual EUR decrease of 0.085 (or 8.5%) is needed with 150 wells/month added for 280 months (48,000 wells total) and if EUR decrease is zero and wells added rises from 200 to 250 wells/ month over 25 months and remains at that level then output rises to 3 MMb/d by Aug 2041 with TRR=36 Gb.
My point here is not to suggest that EUR will never decrease, it is that if it does not, we end up with unrealistic oil amounts, more than 3 times the 5 % probability level in the recent USGS estimate. The USGS may not be perfect, but I am confident that not more than the 11 Gb level of their 5 % probability estimate and more likely the level will be close to their mean estimate probably around 7.5 Gb unless oil prices are significantly higher than the EIA’s reference scenario.
DC
When it comes to undertaking and presenting analysis, it is important to clearly define the variables, especially if you are deviating from the norm. Also sometime you may describe something one way but it may be easier to use it in another way in carrying out the analysis. For instance the decline rate of an average Bakken well is described as 69% in the first year, 39% in the second, etc. This gives a vivid picture of what is happening to the rate of production. However in some analysis I am experimenting with on the Bakken, I prefer to work directly with the estimated production based on a normalized version of production curve.
With regard to depletion, as you note, one must consider depletion and depletion rate. In your Bakken example, depletion is easy since it should refer to the TRR. I guess if a new technology increases the TRR, the depletion of the field would drop.
As for depletion rate, I think it is best to make the denominator the original TRR and keep it constant. If you were to use the depleting reserve in the denominator, one would see an increase in depletion rate. From this increase, one could not ascertain how much of the increase was associated with the smaller denominator and how much could be due to increased production from new wells.
I am still grappling with this statement “The decrease in EUR refers to the cumulative output of the average well drilled today over some time period (say 10 years for illustration)”. Do you use the single well EUR to assess depletion or do you use it to provide insight on when the peak would occur.
I also was surprised to read “I assume in my models that currently there is no decrease in new well EUR (all average wells produce at a 10 year EUR of 293 kb from 2008 to 2013)”. It was my understanding that the length of the horizontal holes drilled in the Bakken has been increasing with time. I had read that they originally were around a ½ mile long and that today they could be up to two miles long. Since the flow rate is a function of the area of the well bore exposed to the shale, in an ideal situation in the same area, the two mile well would have an initial flow rate 4 times greater than the ½ mile well and as a consequence 4 times greater EUR. That is one of the mysteries in the Bakken, are those higher producing wells associated with sweeter areas or are the wells longer and possibly have a slightly larger diameter.
I do not have the details on the individual wells, just data collected by Rune Likvern on wells which started production in 2010 to 2011. Using that average well fits the production data over the period from 2008 to 2013, so a 7 year period, prior to that, from 1953 to 2007 a well with about half the EUR of the 2011 well fits the data. I don’t really think in terms of depletion, but in fact that is what is happening, I set up the problem so that about 45,000 wells are drilled (based on NDIC estimates) and that the TRR will be 8.5 Gb based on USGS estimates. We know the change in wells each month back to 1953 and the output data. A spreadsheet is just used to add it all up to the present and the future is a guess at the future change in the number of producing wells and how the average new well EUR will change and how quickly it will change as the sweet spots get fully drilled. Increased well density in the sweet spots is likely to accelerate the decrease in new well EUR, although it might allow the total well count to be higher, it depends on which of these opposing effects tends to dominate, the effects may simply cancel each other, though my guess is that it will eat into profits.
DC
If all drilling stopped on 1 January, and there were no weather events to stop tanker trucks, the field output for January would be the output (in bpd) on 31 Dec minus whatever the decline curve says for January (65000 bpd?).
Has anyone looked at how the decline rate would begin to reduce with no new drilling? The February loss of output would be smaller than the January loss, yes? And March’s decline rate would moderate further. Without brand new wells and their steep decline rate, the overall decline rate would reduce.
The scenario is a price crash that shuts off drilling. Output in bpd starts to fall. The curiosity is how many months of this low price (no new drilling) would be required to ensure that the field can NEVER reach new highs in output again even with a price rise. How far down does the field have to drop to be unable to restore output?
Hi Watcher,
That is an interesting question. If we assume this happens in Jan 2014 and no decrease in new well EUR has begun (that is new wells drilled Dec 31, 2013 still have an average 30 year EUR of 430 kb or whatever it has been over the past 5 years or so, my model suggests it has not changed very much since 2008), the effect would be to delay the start of any future EUR decrease. Assuming the wells can be drilled in the future when prices presumably rise to present levels in real dollars, then output will continue to rise. Remember that any decrease in new well EUR happens because we run out of room for new wells in the sweet spots. If the drilling stops, then this “decrease in new well EUR” process stops as well. In fact when I use economic assumptions to attempt to model the ERR (economically recoverable resource) rather than the TRR (technically recoverable resource), the rate of EUR decrease slows down as the drilling rate is reduced.
So the short answer is that the output goes down if the drilling slows to a stop, but if the drilling is resumed the output will recover.
I model this as a 25 well decrease in new wells added each month starting in Jan 2014 and assume prior to that that 200 wells per month were being brought online. So starting with Jan 2014 the change in the number of producing wells is 175, 150, 125, …, 50, 25, 0 where no increase in producing wells is reached in Aug 2014. This remains the case until Jan 2015 when the process is reversed (say because real oil prices return to levels that make drilling new wells profitable.) The change in producing wells from Jan 2015 is 25, 50, 75, …, 175, 200, where the increase of 200 wells per month is reached on Aug 2015. The two charts below show the original scenario (where wells are added steadily at 200 per month from now until 155 months from now for 37k wells and a TRR of 8.5 Gb and then the scenario outlined above, “the Watcher scenario”. 🙂
Original Scenario
Watcher Scenario
Note that this scenario does not include any economics except to calculate a breakeven point, if we were to find the ERR, the wells added would be lower after May 2019 to keep new wells profitable and the ERR would be somewhat lower as a result (probably about 7.5 Gb and 20k to 25k total wells, but I haven’t done that for this scenario so this is a guess.)
DC
If I read your model correctly, then I guess the answer is found by considering the pre-shut down and post -shut down field outputs as two separate fields. The pre-shut down field would decline very fast at first, then after a couple of years decline at a lower rate. The post-shutdown field would show its own rapid rise as new wells came online, tailing off as depletion from these wells increases, and new wells start to show lower EUR. If this post-shutdown ‘field’ displays a higher peak production than current production, then the answer is indeed ‘always’. However, if it is lower, then the delay needed to make current production the all time peak is the time it takes for current production to decline to the level that is the difference in the two peaks. Eyeballing your model curve, suggests this would be not less than 2 years.
Thanks for exploring the question, guys.
Hi Watcher,
The short answer is it depends. Do you mean that new well additions are eventually restored to present levels of about 170 wells added per month (12 month avg is 154 wells per month and 6 month avg is 168 wells per month)? A scenario with no new wells added from Jan 2014 to Jan 2023 (10 years) will reach a higher peak than current levels of output at 200 wells per month added from Jan 2023 to the point 37000 producing wells is reached. If only 150 wells per month are added (with everything else the same as previous sentence) peak levels in 2027 (970 kb/d) are about the same as Dec 2013 model output (930 kb/d). The output curve gets pretty flat after 10 years of no wells added, so it might take a 15 or 20 year time of no new wells added to get to the point you are looking for where Dec 2013 output is greater than the future peak in 2032 or 2037. In fact the closest I can get is a delay of adding new wells from Jan 2014 to Dec 2026 and adding 145 new wells from Jan 2027 to Aug 2041, this results in a slightly lower peak of 927 kb/d in 2031.
Bottom line, it is unlikely that a Bakken peak will be less than 1 MMb/d, I think the peak will be 1.3 +/- 0.1 MMb/d (2016 +/-1) and I believe Ron’s estimate is no higher than 1.2 MMb/d and no later than mid-2015 and as early as late 2014.
DC
Hi RalphW,
We could do two separate models, but one of the inputs to my model is the change in the number of producing wells which can be any number that someone wants to use.
For historical input we use the data from the NDIC and adjust this slightly to estimate older wells that will get shut in over time, but the adjustment is pretty small because in Dec 2004 there were only 189 wells producing in the Bakken and we assume the well life is 30 years, we use the 1953 to 2004 data to estimate when these 189 wells get shut in and if on average the new wells from 2005 or later get shut in after 30 years that would start in 2035. The effect on the overall model is small.
Note that the answer is not really “always”. It depends on future real oil prices and how many wells are added in the future. If after the wells stop being added in Jan 2014, the oil price never rises back to current real prices, or for some other reason (a change in fracking regulations for instance) the number of new wells added can only rise to 150 per month, then the conclusions would be different.
I think you are suggesting that if wells were not added for two years that the new peak will be lower than current levels. I will test this hypothesis using the following scenario:
Lets say no wells are added for 10 years, in this case the eventual decrease in new well EUR is also delayed by 10 years. To simplify (but make the model less realistic) I will have no new wells added starting in Jan 2014 and resume adding new wells in Jan 2023 (at a lower level of 150 wells/month), but note that this will delay the start of the decrease in new well EUR from June 2015 to June 2025 the maximum decrease in new well EUR is also lower to keep the TRR at 8.5 Gb(mean USGS estimate). Also note that Brent oil prices (in May 2013$) would need to fall to $61/barrel by Dec 31, 2013 to make this scenario plausible, this is the current breakeven real oil price for the average Bakken well on a point forward basis.
Chart below for this scenario (which I consider quite unrealistic, it is a “what if” type of exercise.)

For comparison I have shown an alternative scenario below that adds 150 wells per month from Sept 2013 until 37,800 wells are reached in Feb 2031
DC
So a peak is reached sooner by continuing to drill? Versus suspending drilling and allowing a decline to assert for a while and then restoring drilling — unless you wait 12 years?
Seems unlikely. The decline rate is still pretty high after just 2 years of no drilling, and you’re saying peak is only a couple of years away anyway with full drilling. So what is changed? Decline rate in 2 years is what, 120K bpd/month? If you stop drilling now for 2 years it would only be down to what, 50K bpd/month?
Did your graph carry forward the residual decline rate? It looks like only new decline rate is embedded.
Hi Watcher,
I think I may have not understood what you were looking for.
I was attempting to create a scenario where the Dec 2013 level of output (which my model predicts will be 930 kb/d) would not be surpassed by a secondary peak if drilling resumes after being suspended. If drilling was suspended for 12 years and only 145 wells were added at maximum after that delay, the new peak would be below 930 kb/d.
The comparison you might have been looking for was something less than the current “predicted peak” say 1.2 MMb/d, to take Ron’s estimate. If you stop drilling for a while the new peak will be lower and the longer the delay, the lower the peak, note that my initial scenario at 200 wells added per month (no suspension of drilling) was 1.4 MMb/d, and the scenario with a 1 year delay had a somewhat lower peak, when the delay was 10 years the peak was even lower (but that was in part because I was trying to make it lower to attain what I initially thought you were looking for so the wells added was reduced to 150 wells per month).
So I will try again with a scenario to match a 1.2 MMb/d peak with 175 wells added per month.
Then a new scenario which stops all new wells after Dec 31, 2013 until Dec 31, 2015 then they jump back up to 175/month Jan 2016.
Note that the legacy decline does not increase when no new wells are added both because the output decreases so 6% of 800 would be less than 6 % of 900 and also because the rate of decline decreases as wells get older, see chart below.
Also if we drill 200 wells per month and reach peak then the legacy decline is less than you would think because new well EUR has started to decrease so the 1st month output of new wells might be 300 b/d times 200 wells so legacy decline would be about 60kb/mo at peak, note that currently legacy decline is about 45 kb/mo, the EIA estimates are off if we use the Hughes estimate of 400 b for first month output and NDIC data for change in wells and output data.
DC
[…] many of the most abundant shale oil deposits in North Dakota have now been depleted, requiring an increasing pace of drilling to maintain production levels. As a result, the IEA reports, the cost of developing new […]
[…] many of the most abundant shale oil deposits in North Dakota have now been depleted, requiring an increasing pace of drilling to maintain production levels. As a result, the IEA reports, the cost of developing new […]
[…] many of the most abundant shale oil deposits in North Dakota have now been depleted, requiring an increasing pace of drilling to maintain production levels. As a result, the IEA reports, the cost of developing new […]
[…] many of the most abundant shale oil deposits in North Dakota have now been depleted, requiring an increasing pace of drilling to maintain production levels. As a result, the IEA reports, the cost of developing new […]
[…] many of the most abundant shale oil deposits in North Dakota have now been depleted, requiring an increasing pace of drilling to maintain production levels. As a result, the IEA reports, the cost of developing new […]
[…] many of the most abundant shale oil deposits in North Dakota have now been depleted, requiring an increasing pace of drilling to maintain production levels. As a result, the IEA reports, the cost of developing new petroleum […]
[…] many of the most abundant shale oil deposits in North Dakota have now been depleted, requiring an increasing pace of drilling to maintain production levels. As a result, the IEA reports, the cost of developing new petroleum […]
[…] many of the most abundant shale oil deposits in North Dakota have now been depleted, requiring an increasing pace of drilling to maintain production levels. As a result, the IEA reports, the cost of developing new […]
[…] più abbondanti di petrolio di scisto in Nord Dakota ora sono stati esauriti, richiedendo un aumentato ritmo di trivellazioni per mantenere i livelli di produzione. Di conseguenza, riporta la IEA, il costo dello sviluppo di […]
The Nov2013 increase for Bakken was 20,000 bpd. (Equates to a 240,000bpd annual increase.) So I don’t think looking at the change from Aug, Sep, Oct shows a real slowing, given next data point was healthy.
FYI: NOV2013-NOV2012= 237kpd increase, while NOV2012-NOV2011=227kpd increase. Seems pretty linear, when looked at for more than small data point. I guess you could plot the whole monthly time series and use trailing 12 months increase (so taking seasonality out).
[…] many of the most abundant shale oil deposits in North Dakota have now been depleted, requiring an increasing pace of drilling to maintain production levels. As a result, the IEA reports, the cost of developing new […]