Global Carbon Dioxide Emissions and Climate Change 2018-2100

A Guest Post by Dr. Minqi Li, Professor

Department of Economics, University of Utah
E-mail: minqi.li@economics.utah.edu
September 2018

This is Part 5 of the World Energy Annual Report in 2018.  Links to Part 1 to Part 4 are shown below:

World Energy 2018-2050

World Oil 2018-2050

World Natural Gas 2018-2050

World Coal 2018-2050


This part of the Annual Report provides updated analysis of world carbon dioxide emissions from fossil fuels consumption, evaluates the future prospect of global warming and considers the implications of global emissions budget (to limit global warming to no more than two degrees Celsius) for economic growth.  Figures are placed at the end of each section.

In 2017, fossil fuels (oil, natural gas, coal) accounted for 85 percent of the world primary energy consumption.  Consumption of fossil fuels results in emissions of carbon dioxide and other greenhouse gases that contribute to climate change.  In 2017, the global average surface temperature anomaly was 1.18ºC (degrees Celsius).  The ten-year average global surface temperature anomaly from 2008 to 2017 was 1.00 ºC (NASA 2018).  Global surface temperature anomaly is measured by the difference between the global average surface temperature and the average global temperature during 1880-1920.  The latter is used as a proxy for the pre-industrial global average temperature (Hansen and Sato 2016).

A scientific consensus has been established that if global average surface temperature rises to and stays above 2ºC higher than the pre-industrial global average temperature, dangerous climate change with catastrophic consequences cannot be avoided.  According to Hansen et al. (2016), global warming by more than 2ºC will lead to the melting of West Antarctica ice sheets, causing sea level to rise by 5-9 meters over the next 50-200 years.  Bangladesh, European lowlands, the US eastern coast, North China plains, and many coastal cities will be submerged.  Further increase in global average temperature may eventually lead to runaway warming, turning much of the world unsuitable for human inhabitation. Read More
World Energy 2014-2050 (Part 3)

This is a guest post by Political Economist

Solar Correction

As I reviewed my spreadsheet, I identified a copy and paste error resulting in a mis-calculation of the solar projection.  This affects the projection of annual installation of Solar PV capacity (see Part 2).

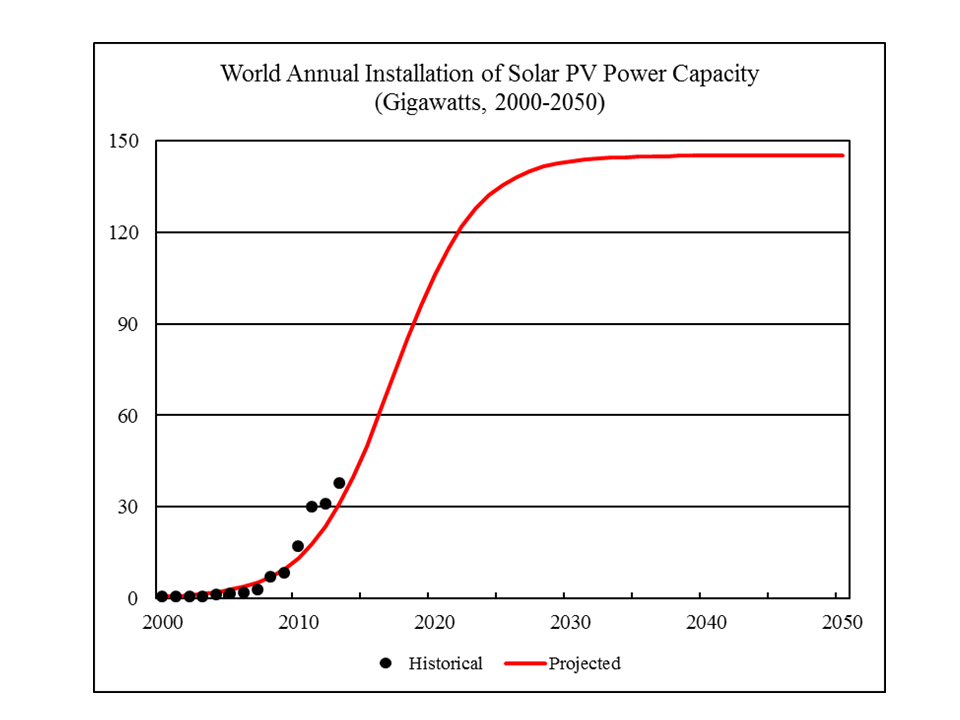
The correct projections of annual installation of Solar PV capacity are shown below:

 photo SolarCorrection070414_zps407c310d.png

Under the current projection, solar PV annual installation is projected to rise from 38 gigawatts in 2013 to 106 gigawatts by 2020.  Beyond 2020, the growth will slow down.  After 2030, it will plateau and approach 145 gigawatts (not 108 gigawatts as previously stated).

Again, please note this does not imply that solar electricity generation will peak.  Instead, it assumes that the GROWTH of solar electricity generation will peak and plateau.  In other words, it assumes that at some point in the future, solar electricity generation growth will become linear rather than exponential.  (I had an interesting discussion with Dennis on this after the post of Part 2)

I made corrections of the projected primary energy consumption and world GDP in accordance with the solar PV correction.  These are shown below.

Total Primary Energy Consumption

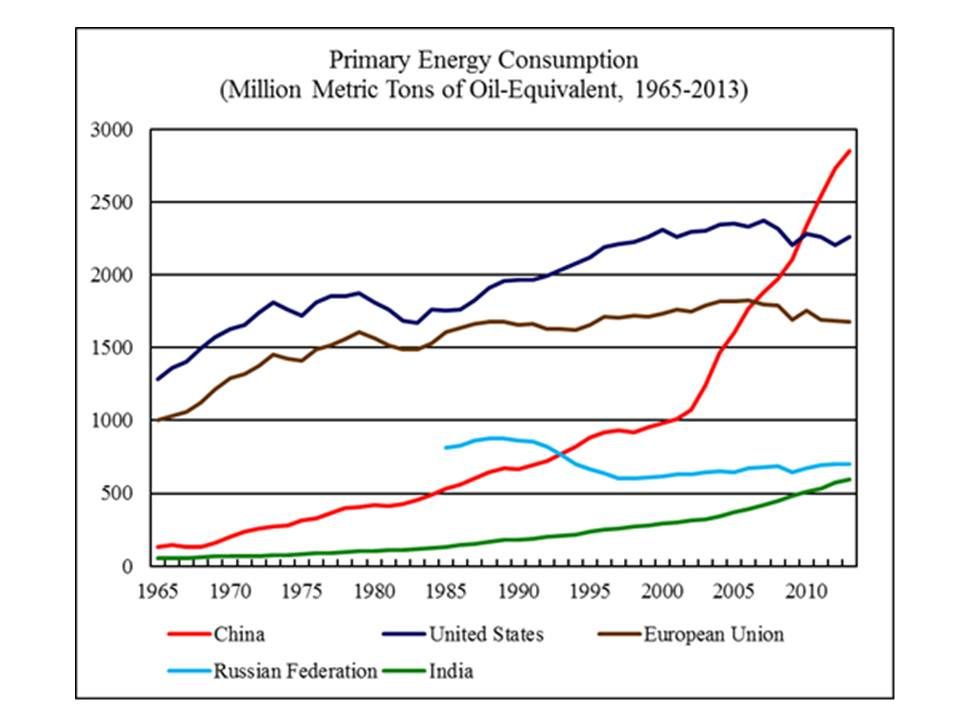
According to BP Statistical Review of World Energy 2014, world primary energy consumption reached 12,730 million metric tons of oil-equivalent, 2.3 percent higher than world primary energy consumption in 2012.  Figure 24 shows the primary energy consumption by the world’s five largest energy consumers from 1965 to 2013.

 photo PrimaryEnergy062114-1_zpsf37768e7.jpg
Read More

World Energy 2014-2050 (Part 2)

This is a guest post by Political Economist

Nuclear Electricity

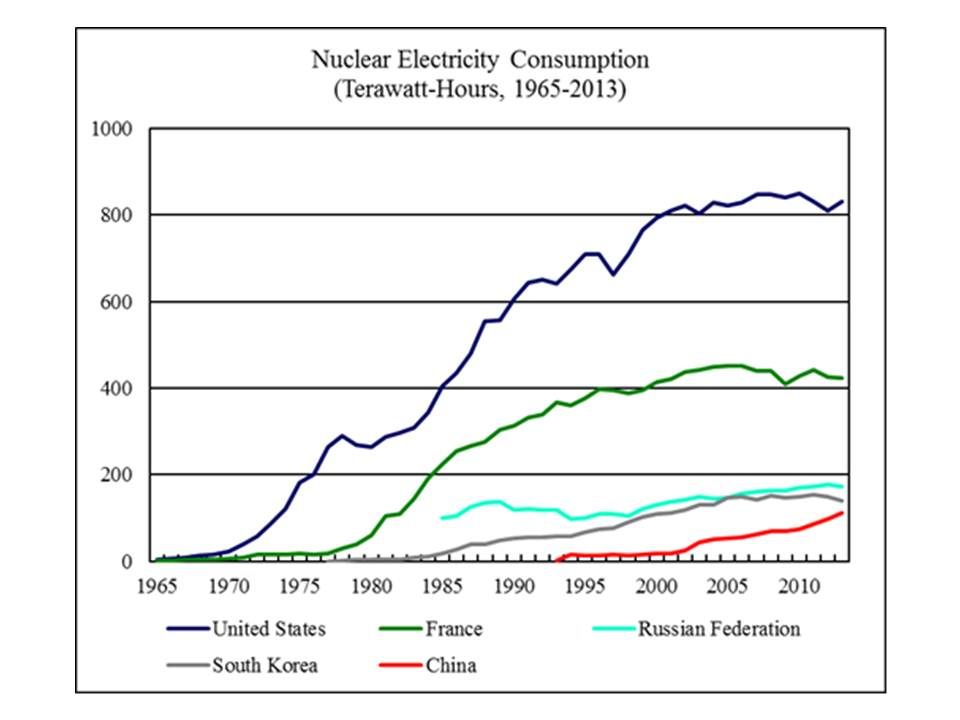
According to BP Statistical Review of World Energy 2014, world consumption of nuclear electricity reached 2,489 terawatt-hours (563 million metric tons of oil-equivalent) in 2013, 0.9 percent higher than world consumption of nuclear electricity in 2012.  In 2013, nuclear electricity accounted for 4.4 percent of the world primary energy consumption.

Figure 16 shows nuclear electricity consumption by the world’s five largest nuclear electricity consumers from 1965 to 2013.

 photo Nuclear062114-1_zps59fc6b2c.jpgAccording to the World Nuclear Association, as of January 2014, 375 gigawatts of nuclear electric power plants were operative worldwide.  75 gigawatts were under construction, 187 gigawatts were being planned, and 351 gigawatts were being proposed.  World Nuclear Association claims that most planned nuclear power plants are expected to operate within 8-10 years. Assuming that in 10 years, all of the currently constructed and planned nuclear power plants become operative, then in average the world will need to build 26 gigawatts of nuclear power plants a year in the next 10 years.  In reality, some delays are inevitable.
I assume that from 2015 to 2050, the world will build 20 gigawatts of nuclear power plants each year.  On the other hand, 2 percent of the existing nuclear generating capacity will retire each year.  Under these assumptions, nuclear electricity consumption is projected to rise to 4,648 terawatt-hours (1,052 million metric tons of oil-equivalent) by 2050.

Hydro Electricity

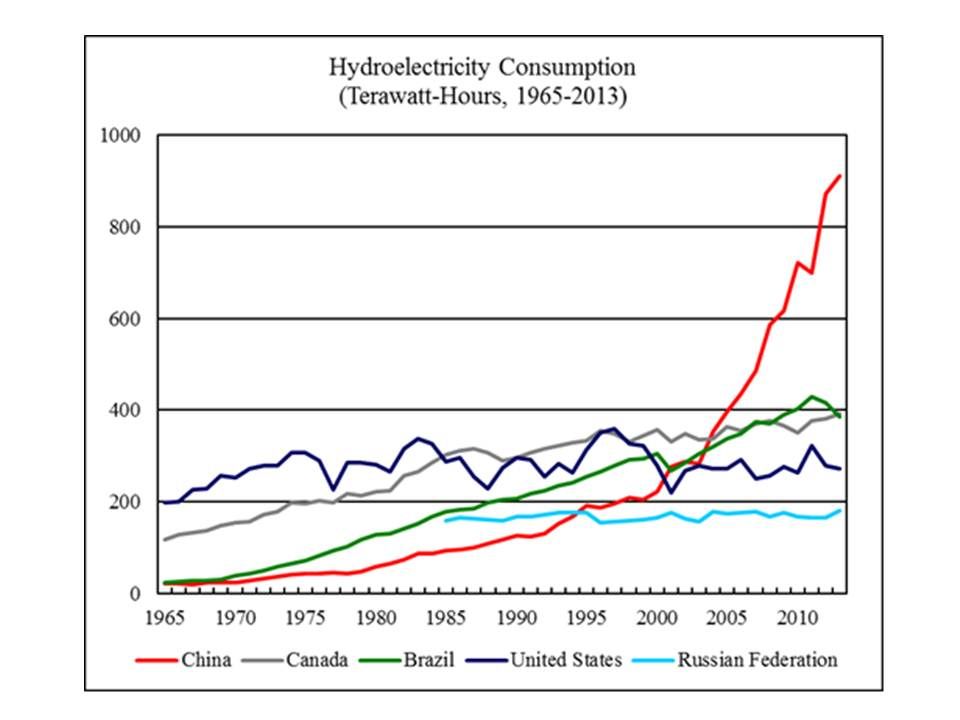
According to BP Statistical Review of World Energy 2014, world consumption of hydroelectricity reached 3,782 terawatt-hours (856 million metric tons of oil-equivalent) in 2013, 2.9 percent higher than world consumption of hydroelectricity in 2012.  In 2013, hydroelectricity accounted for 6.7 percent of the world primary energy consumption.

Figure 17 shows hydroelectricity consumption by the world’s five largest consumers of hydroelectricity from 1965 to 2013.

 photo Hydro062114-1_zps02929bac.jpgFrom 2000 to 2013, the average annual growth of world hydroelectricity consumption was about 90 terawatt-hours (20 million metric tons of oil-equivalent).  I assume that world hydroelectricity consumption will rise to 880 million metric tons of oil-equivalent in 2014 and will keep growing by 20 million metric tons of oil-equivalent each year from 2015 to 2050.
Read More

World Energy 2014-2050 (Part 1)

This is a guest post by Political Economist

World Energy 2014-2050: An Informal Annual Report

 “Political Economist” June 2014

The purpose of this informal report is to provide an analytical framework to track the development of world energy supply and demand as well as their impacts on the global economy. The report projects world supply of oil, natural gas, coal, nuclear, hydro, wind, solar, biofuels, and other renewable energies from 2014 to 2050.  It also projects the overall world energy consumption, gross world economic product, energy efficiency, and carbon dioxide emissions from 2014 to 2050.

The basic analytical tool is Hubbert Linearization, first proposed by American geologist M. King Hubbert.  Despite its limitations, Hubbert Linearization provides a useful tool helping to indicate the likely level of ultimately recoverable resources under the existing trends of technology, economics, and geopolitics.  Other statistical methods and some official projections will also be used where they are relevant.

Oil

According to BP Statistical Review of World Energy 2014, world oil consumption (including crude oil, natural gas liquids, coal-to-liquids, gas-to-liquids, and biofuels) reached 4,185 million metric tons (91.3 million barrels per day) in 2013, 1.4 percent higher than world oil consumption in 2012.  In 2013, oil consumption accounted for 32.9 percent of the world primary energy consumption.

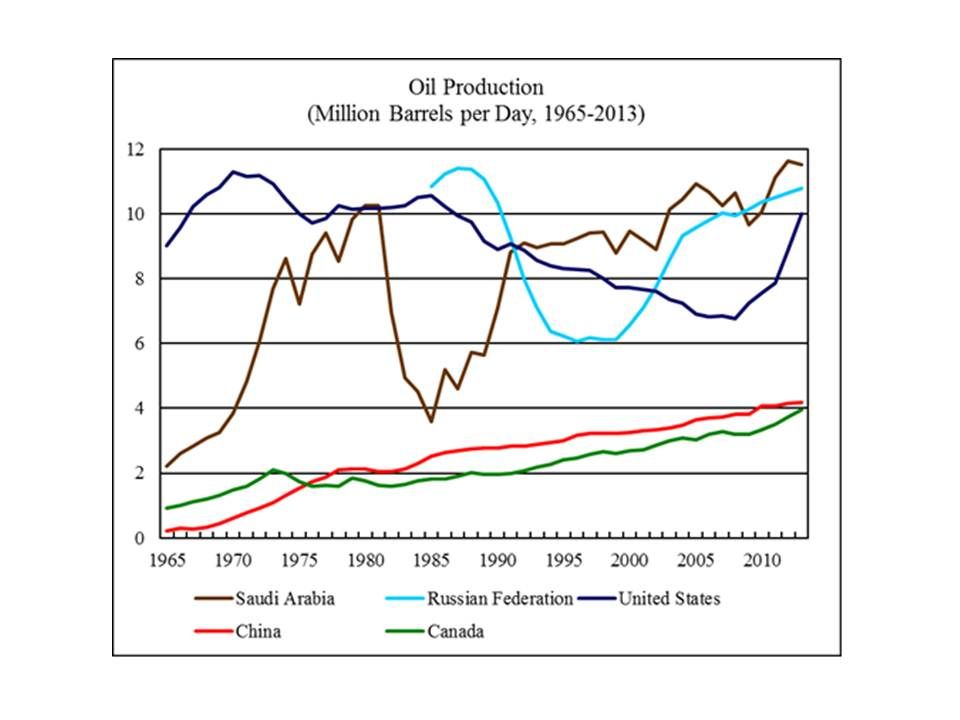
World oil production (including crude oil and natural gas liquids) reached 4,133 million metric tons (86.8 million barrels per day) in 2013, 0.6 percent higher than world oil production in 2012.  Figure 1 shows oil production by the world’s five largest oil producers from 1965 to 2013.

 photo Oil062014-1_zpsc4e13cc7.jpgAs of 2013, world “proved” oil reserves stood at 238 billion metric tons, 1.0 percent higher than the “proved” oil reserves in 2012.
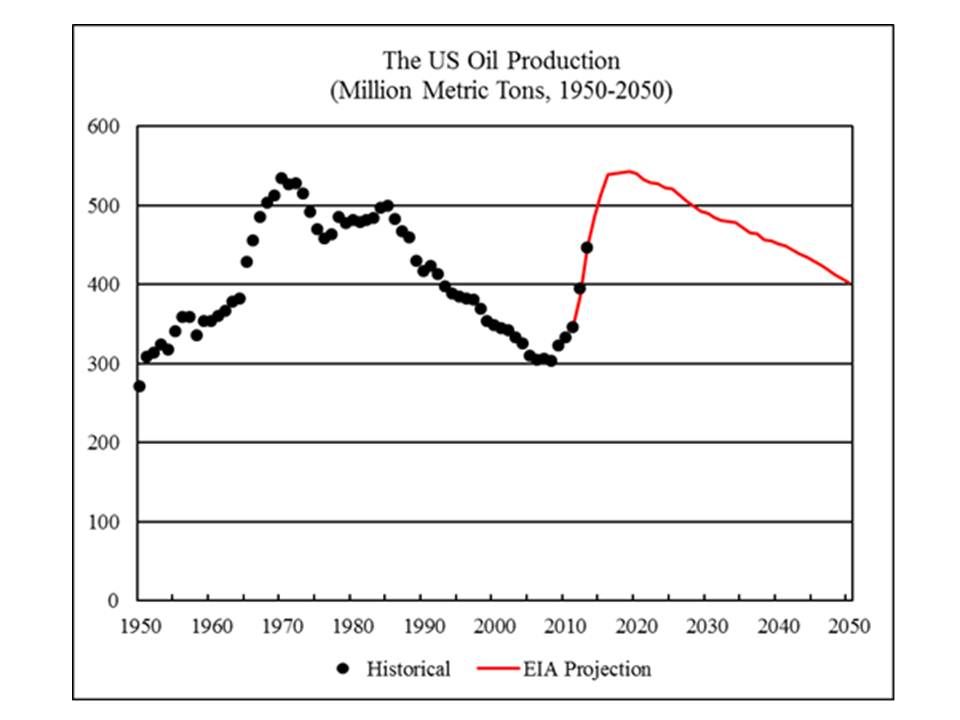
In recent years, the US oil production has surged due to the “shale oil” boom.  The US accounted for all of the growth of world oil production from 2008 to 2013.  Figure 2 shows the historical and projected US oil production from 1950 to 2050.  The projection is based on the reference case scenario for US oil production from 2011 to 2040 projected by the US Energy Information Administration (EIA), extended to 2050 based on the trend from 2031 to 2040.  The EIA reference case projects the US oil production to peak in 2019, with a production level of 543 million metric tons.

 photo Oil062014-2_zps187c496f.jpg
Read More