International Rig Counts Still Falling

The monthly Baker Hughes International Rig Count came out a few days ago. Baker Hughes international rig counts do not include US, Canada, FSU countries or on shore China. All rig count data here is through December 2015 and includes all rigs, gas, oil and misc.

BH Total Intl.

Total international rig count was down 14 rigs from November to December. From December 2014 to December 2015 rig count was down 218 rigs or 16.6 percent.

Read More

Confessions of a Doomer

I need to tell you of a very special talent I have. I have the very unusual and rare ability to find, to ferret out if you will, the blatantly obvious. I mean if it is as plain as the nose on your face, I am going to figure it out. What shocks me is that this ability is so rare. What is happening to our earth and our species is so obvious it is mind blowing.

I could give you thousands of forest disappearing, deserts expanding, rivers drying up, water tables dropping, top soil disappearing, species going extinct, ocean fish disappearing, pollution and plastic waste killing sea birds, and on and on and on. But I will start with one example that exemplifies what is happening to the entire world, the Aral Sea.

What has been happening to the world can be exemplified by this short 3 minute video on the Aral Sea: The Aral Sea story.

Aral Sea 1

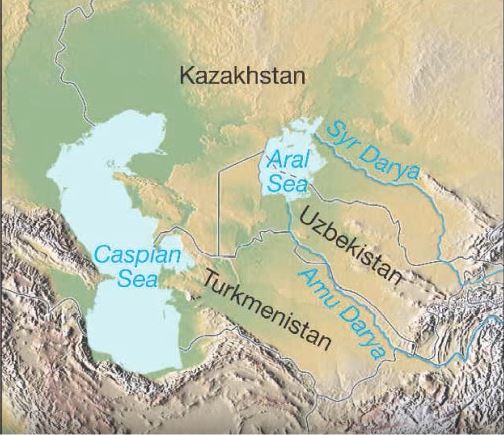
The Aral Sea was once the fifth largest inland sea in the world. It supported a huge fishing industry. But that was before they dammed its tributaries to irrigate cotton fields.

Read More

BAKKEN – Single Well Economics

This is a guest post by Ciaran Nolan

Disclaimer

The opinions and views expressed in this presentation are solely those of the author and not necessarily those of any organisation.

Introduction

This presentation builds upon earlier work carried out by the author in May 2015 on the North Dakota (ND) Bakken / Three Forks Light Tight Oil (LTO) Play – ‘Bakken – the bubble has burst’*. 

North Dakota Industrial Commission (NDIC) production data (up to November 2015) kindly supplied by Enno Peters. Data analysed in Excel and IHS Kingdom.

Production decline curves generated for P10 – P90 type wells, based on8843 wells with 1 year full production (January 2007 – October 2014).

Discounted cash flow (DCF) models were generated by the author for single wells in the ND Bakken / Three Forks Play.

Break even oil prices for Net Present Values with a 10% discount rate (NPV10) determined for P10 – P90 type wells. NPV10 break even oil price map generated. Historical NPV10 generated for average wells for 2008 – 2015. NPV10 breakeven oil price determined for top ten Bakken Producers in 2014, for 2014 wells.

Ciaran 1

Read More