US Individual States Production, Bakken Area and GOM

The EIA’s Petroleum Supply Monthly has been published with production data for all individual states and offshore areas.  All data is Crude + Condensate and in thousand barrels per day with the last data point March 2014.

Mont+ND


Since the Bakken occupies part of two states, North Dakota and Montana, I have combined their production in order to get a better idea of what is really happening there. I have drawn a trend line from July 2011 through October 2012. That shows where production might have been if the fast decline rate and bad weather had not caught up with the. Production was 1,050,000 barrels per day in March, still 5,000 barrels per day below the point reached in November.

ND and Montana Change

I wanted to show this chart so we could get a better idea what is really going on in the entire Bakken area. Back in May and June of 2012 production was increasing by an average of 23,500 barrels every month. Now production is increasing by an average of 15,580 barrels per month.
Read More

A Closer Look at Saudi Arabia

A press release from The Carbon Capture and Sequestration Technologies Program at MIT,  December 6, 2013, Bold mine.

Uthmaniyah Fact Sheet: Commercial EOR using Anthropogenic Carbon Dioxide
Company/Alliance: Saudi Aramco
Location: Saudi Arabia
Start Date: 2013/2014
Size: 0.8 Mt/yr
CO2 Source: Hawiyah gas plant
Transportation: 70 Km onshore pipeline
Oil Field EOR Storage Site: Ghawar field
Reservoir Type: Jurassic Carbonate limestones
Comments:

The objectives of the project are determination of incremental oil recovery (beyond water flooding), estimation of sequestered CO2, addressing the risks and uncertainties involved (including migration of CO2 within the reservoir), and identifying operational concerns. Specific CO2 monitoring objectives include developing a clear assessment of the CO2 potential (for both EOR and overall storage) and testing new technologies for CO2 monitoring.

Approximately 60–65% of all Saudi oil produced between 1948 and 2000 came from Ghawar. Cumulative production until April 2010 has exceeded 65 billion barrels. It was estimated that Ghawar produced about 5 million barrels of oil a day (6.25% of global production) in 2009. Ghawar also produces approximately 2 billion cubic feet of natural gas per day.

After 60 years of production, the field is depleted and Saudi Aramco is going to start CO2-EOR. The project will consist of 4 injection wells, 2 observation wells and 4 productions wells.

Is there any doubt anymore whether or not Ghawar is depleted? 2009 is likely the year when production began to fall fast in Ghawar. But it was already falling prior to that.

A bit of history. Three oil fields, discovered decades ago, were held offline because of economic and and other problems.

Shaybah: Discovered in 1968 but due to its remote location was not brought online until 1998 at 500,000 bpd. It was upgraded in 2009 and increased production to 750,000 bpd.

Khurais: Discovered in 1957 and brought online in 1959 and shut down in 1961 due to low production and remote location. It was brought back on line in the early 1970s. Khurais produced 144,000 bpd in 1981 but dropped off dramatically in 1982. Gas re-injection attempts to increase production failed and the field was shut down a short time later due to almost no natural pressure. In 2009 a new massive water injection program began with the injection of over 4 million barrels of water per day brought the field up to 1.2 million barrels of crude oil per day.

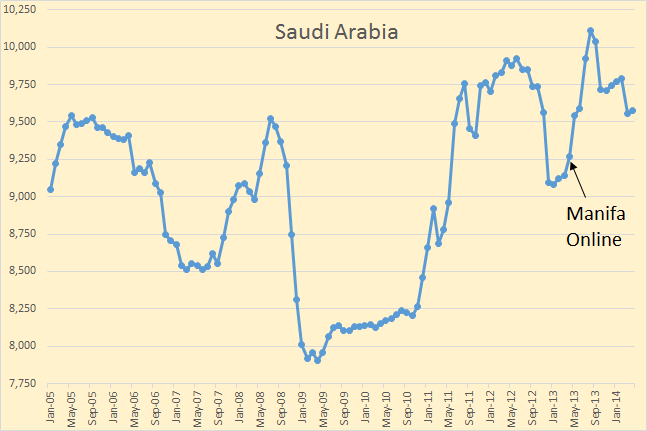
Manifa: Discovered in 1957 but shut down almost immediately because the oil was extra heavy and contaminated with vanadium. But Aramco built their own refineries to handle the oil. The field was put on line in April 2013 and was producing 500,000 bpd and will be producing 900,000 bpd in 2014.

It is these three fields that has kept Saudi production near 10 million barrels per day. But there are no more old fields to be brought on line. From here on out Saudi must rely on the fields it has.

Saudi Arabia

Okay, we know that Ghawar is depleted and in serious decline. But so is Safaniya, Abqaiq, Berri, Abu-Safah, Qatif, Zuluf, Marjan, and all the smaller fields in Saudi Arabia.

Saudi has three fields with a combined production of 2.8 to 2.9 million barrels per day that are not in decline. Everything else is seriously depleted and in serious decline. Matt Simmons, Twilight in the Desert Stuart Staniford, A Nosedive Toward the Desert and Chip Haynes Ghawar is Dying, were all absolutely correct… they were just all premature with their prognostications. They had not counted on Khurais and Manifa.

Saudi is diversifying, making preparations to increase their finished product income when oil production declines: Change is coming to Saudi Aramco, the state oil company

Time was when Saudi Aramco didn’t need to worry much about its ability to deliver all the oil needed to maintain Saudi Arabia’s share of the global market…

A quick glance at Aramco’s 2013 Annual Review, published last week, is enough to convince anyone that change is in the wind for the flagship Saudi state-owned enterprise.

“We have embarked on ambitious corporate transformation guided by our Strategic Intent, our overall vision for Saudi Aramco through 2020,” the review states.

 “These advancements will not only ensure that Saudi Aramco remains a global leader in crude oil and NGL production and exports, but will also propel us into the top tier of chemicals companies worldwide and reaffirm our commitment to the Kingdom’s future in a rapidly changing world.”
Read More

JODI, the EIA and Their Data

There has been very little new data to report lately. The JODI, Joint Organizations Data Initiative, data for March came out a few days ago. JODI is very good as far as the data it reports goes. The problem is there is a lot of data they just don’t report. If a country does not report their production for a given month then JODI just leaves it blank. And some countries they can’t seem to get any data from, so JODI just gives them zero for every month. For those countries I just substitute EIA numbers.

As far as OPEC goes JODI is very political, reporting the inflated numbers that Iran and Venezuela report. I use instead the EIA data for those two countries.  Anyway here is what I have from JODI. The Data is in kb/d, last data point March 2014:

JODI World Total

But for a few countries JODI is a pretty good data source. Russia is a good example.

JODI Russia

JODI has Russia peaking, so far, in November at 10,127 kb/d and now about 100 kb/d below that point. Analysis have, for years, been expecting Russian production to decline but new fields in Siberia have kept inching up a little bit each year. But with over 60% of their production still coming from Western Siberia’s giant, largely depleted, fields it looks like that long overdue decline may have finally arrived.
Read More

Texas RRC Oil and Gas Data

The Texas Rail Road Comission has has released their production numbers for March. The data is always incomplete and the most recent data is always the most incomplete. Nevertheless one can glean quite a bit from the data even though it is incomplete.

Texas Crude Only

The May Report has data through March, April through February and the March report has data through January. You can see from this chart how Texas upgrades their data as data comes trickling in.

Texas Condensate

I looks like Texas condensate has peaked. May 2013 is the peak so far. October 2013 is creeping up but I don’t think it will overtake May. Regardless of whether May will be the ultimate peak or not there is no doubt that there has been a dramatic slowdown in Texas Condensate production.

Read More

Jean Laherrere’s Take, Plus Other News

Note: Jean Laherrere sent me the below post and asked me to post it in reply to comments posted by Dennis Coyne and Political Economist on my post Bakken Update, March Production Data. But that was several days ago, the comments are stale. Also it was too large for a comment. So since we are a period where there is a dearth of data, I decided to make a post of it. Below Jean’s graphs and comments I have added a couple of news Items.
_______________________________________________

Policial Economist displays a graph for Bakken production Hubbert linearization trending towards 3.5 Gb, but it is from EIA DPR for the period January 2007 to June 2014 : it is not real data (we are not yet in June 2014) but estimates.

It is different from mine trending towards 2.4 Gb, but it is only for North Dakota Bakken using ND state data from 1955 up to March 2014.

In many of my papers I state that production Hubbert linearization is not very reliable and it is better to rely on the creaming curve of cumulative backdated 2P discovery versus cumulative number of fields. But for LTO there is no reliable way to estimate 2P reserves, because only the volume generated by the source rocks (using Rock Eval measures from cores) can be estimated but the amount lost from this generated oil and gas cannot be estimated and the recovery from what is left within the fractures needs longer historical data.

Laherrere E

The ND production excluding Bakken Hubbert linearization trends also towards 2.5 GbLaherrere

It is why I use a NG oil ultimate of 5 Gb with both 2.5 Gb for Bakken and non-Bakken.
Read More