By Ovi
All of the Crude plus Condensate (C + C) production data, oil, for the US state charts comes from the EIAʼs Petroleum Supply monthly PSM which provides updated information up to May 2024.

U.S. May oil production dropped by 61 kb/d to 13,178 kb/d. The largest increase came from Texas, 35 kb/d while North Dakota dropped by 43 kb/d.
US oil production has been flat since September 2023 when it was 13,247 kb/d.
The dark blue graph, taken from the July 2023 STEO, is the forecast for U.S. oil production from June 2024 to December 2025. Output for December 2025 is expected to reach 14,009 kb/d and is an increase of 92 kb/d from the previous STEO report.
From June 2024 to December 2025 production is expected to grow by 770 kb/d or at an average rate of 42.8 kb/d/mth. This rate is still a high growth rate and is not consistent with many articles predicting a near term peak in US oil production. However this recent article reports that many US producers are raising their production targets.
“While the increases are from just a handful of publicly-traded companies so far, the trend raises the prospect that U.S. shale producers are ramping up production more aggressively than expected, posing a threat to efforts by OPEC+ to manage global prices
To be sure, EOG Chief Executive Officer Ezra Yacob told analysts Friday he maintains his view that U.S. oil supply will likely grow by 300,000 to 400,000 bpd this year compared with 2024. Total liquids growth in 2024 will likely be 500,000 bpd, Yacob said.
At the same time, drilling rigs in the Permian are down 2% this year, hovering at the lowest level of activity in more than two years, according to Baker Hughes Holdings LLC. Improved efficiencies are allowing U.S. producers to hike production while keeping spending relatively flat, allowing firms to return more cash to investors.”
The red OLS line from June 2020 to December 2023 indicates a monthly production growth rate of 65 kb/d/mth or 780 kb/d/yr. Production going forward is projected to increase at a slower rate.
The light blue graph is the STEO’s projection for output to December 2025 for the Onshore L48. From June 2024 to December 2025, production is expected to increase by 782 kb/d to 11,726 kb/d which is 230kb/d kb/d higher than reported in the previous STEO.
US Oil Production Ranked by State
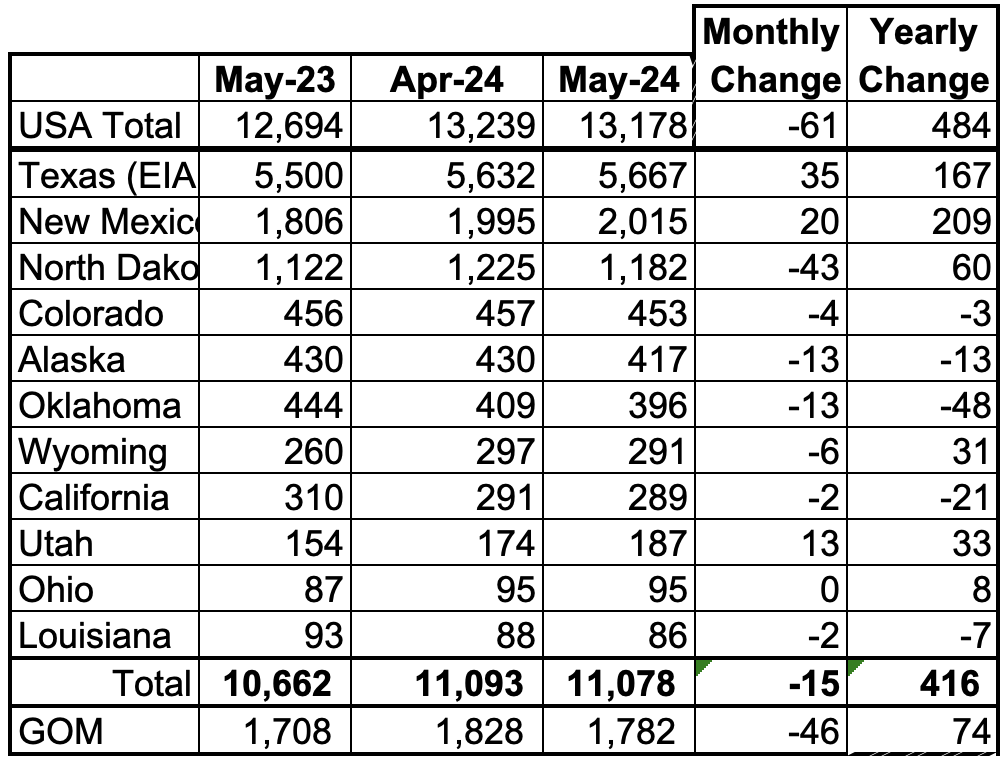
Listed above are the 11 US states with the largest oil production along with the Gulf of Mexico. Ohio has been added to this table since its production approached 100 kb/d in January and exceeded Louisiana’s production. These 11 states accounted for 84% of all U.S. oil production out of a total production of 13,178 kb/d in May 2024.
On a YoY basis, US production increased by 484 kb/d. GOM production decreased by 46 kb/d MoM while YoY it rose by 74 kb/d.
State Oil Production Charts
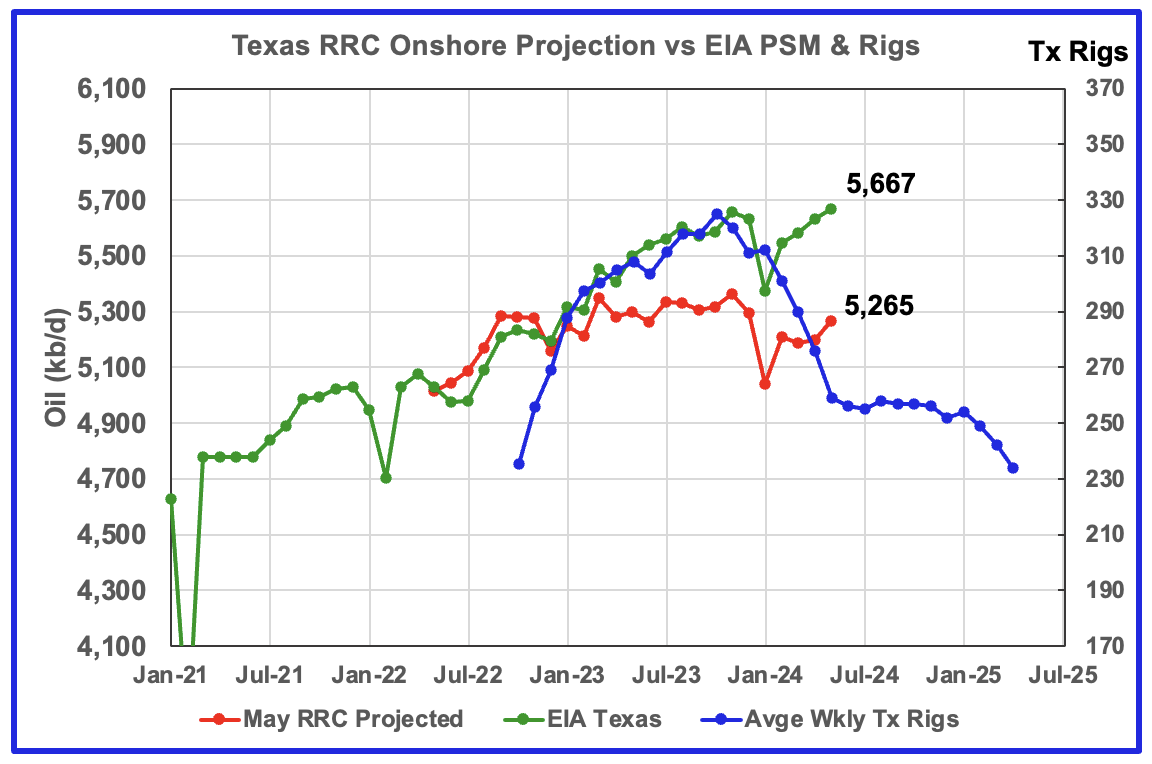
Texas production increased by 35 kb/d in May to 5,667 kb/d. YoY production is up by 167 kb/d.
The red graph is a production projection for Texas using the Texas RRC reported April and May production. The projection uses the cumulative difference between the May and April preliminary production data provided by the Texas RRC. This month, as opposed to last month, the projection does not provide a reasonable estimate for Texas’ May production vs the EIA’s official 5,667 kb/d.
In checking oil production from Texas counties, it was found that a number of them had a significant production drop in May and I think it reflects either a delay in reporting or a processing delay by the Texas RRC.
The blue line is the average numbers of weekly rigs reported for each month, shifted forward by 9 months. So the 234 rigs operating in July 2024 have been shifted forward to April 2025. So if production should follow the rig count, Texas production should begin to decline shortly.
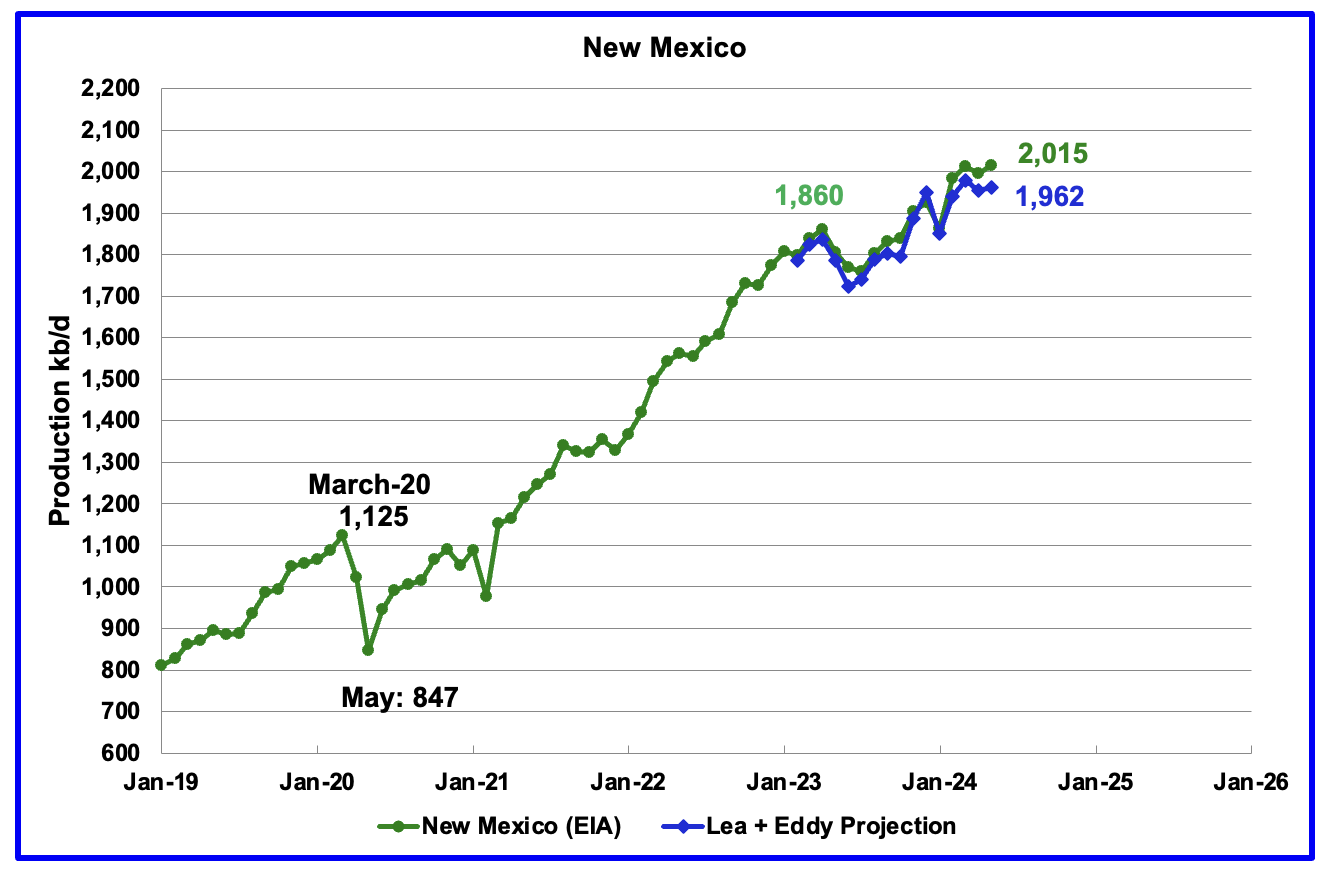
According to the EIA, New Mexico’s May production rose by 20 kb/d to 2,015 kb/d.
The blue graph is a production projection for Lea plus Eddy counties. These two counties account for close to 99% of New Mexico’s oil production. The projection used the difference between April and May preliminary production data provided by the New Mexico Oil Conservation Division. The projection provides a reasonable estimate for New Mexico’s April production. A 1% correction was added to the Lea plus Eddy projection to account for their fraction of New Mexico’s oil production.
Note the methodology used to project New Mexico’s production is the same as that used for Texas above.
More oil production information for these two counties and Texas counties is reviewed in the special Permian section further down.
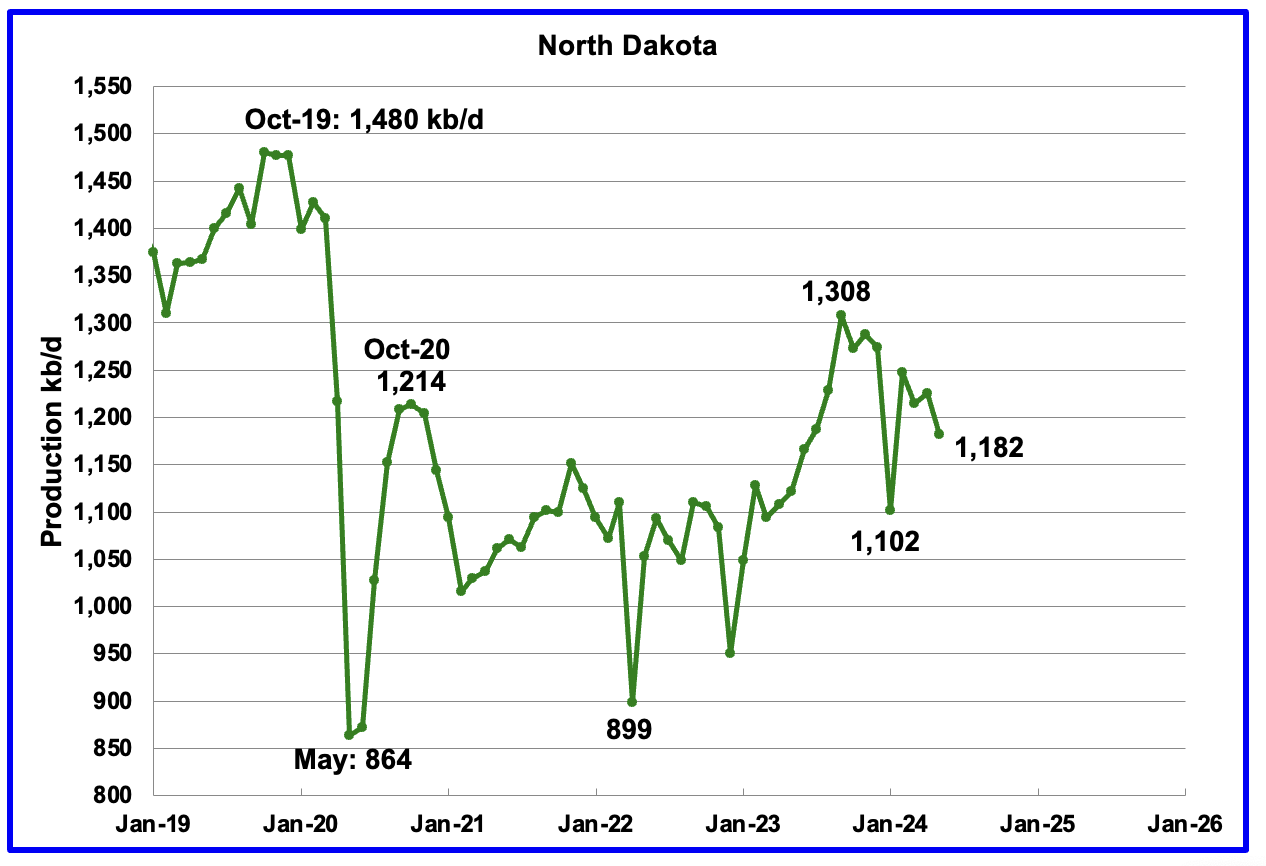
May’s output decreased by 43 kb/d to 1,182 kb/d. YoY production was up by 60 kb/d.
According to this article production was lower due to road restrictions and fewer completions.
“Bohrer said it was likely due to road restrictions, likely still in place, as well as lower-than-expected completion numbers.
“There was a fair amount of rain in May also, which likely slowed things down,” Bohrer said.
And Bohrer said the load limits impacted frack crews.
“They have to move around,” Bohrer said. “It’s not like a drilling rig, where they can sit on a pad, and drill multiple wells without having to move. You need a lot of truck traffic to move those frack crews around.”
Bohrer said 78 wells were permitted in May.”
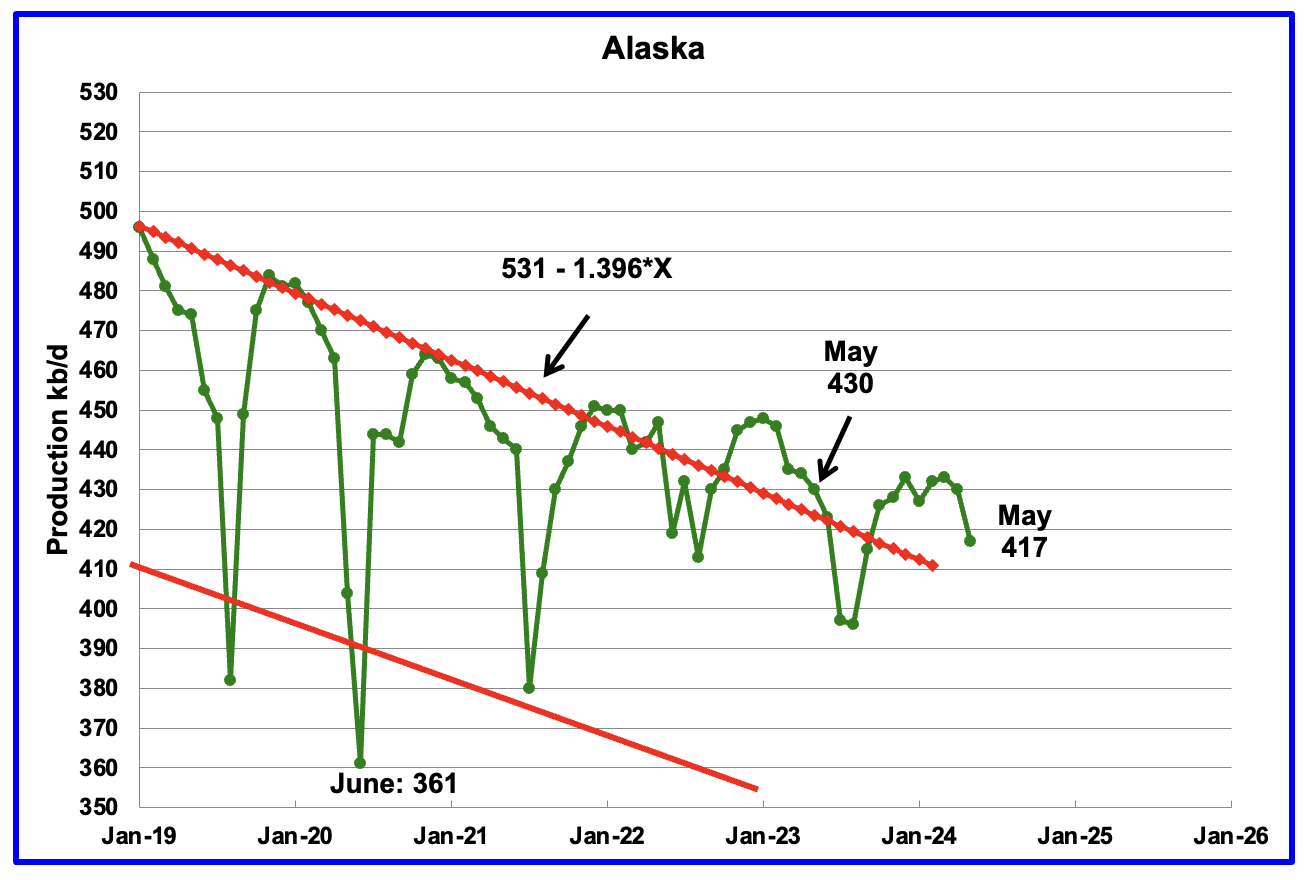
Alaskaʼs May output dropped by 13 kb/d to 417 kb/d. Production YoY is also down by 13 kb/d. The EIA’s weekly petroleum report continues to show Alaska’s oil production is dropping with July production below 400 kb/d. Typically production drops in the summer months due to maintenance.
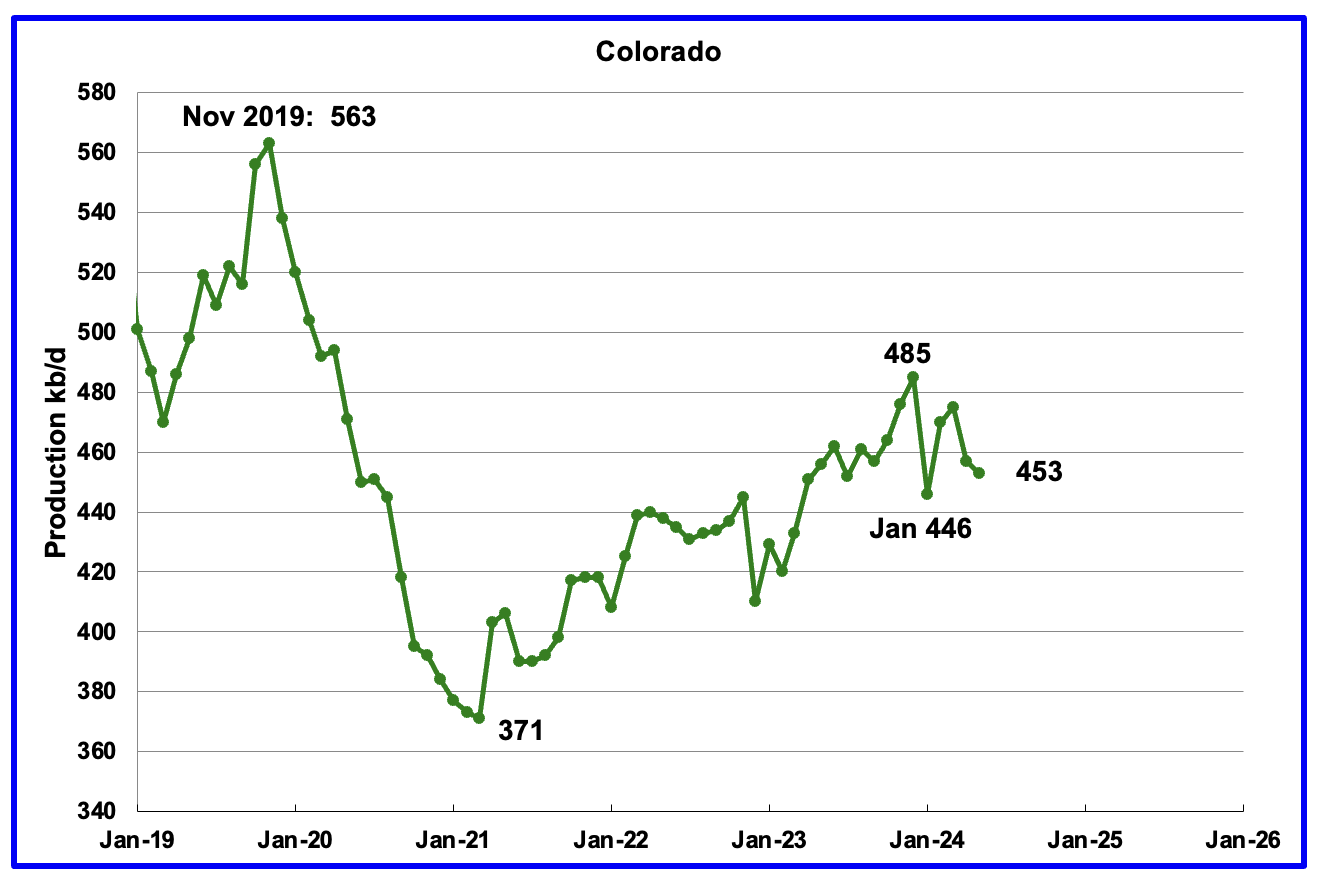
Coloradoʼs May oil production decreased by 4 kb/d to 453 kb/d. Colorado has moved ahead of Alaska to become the 4th largest US oil producing state. Colorado began the year with 12 rigs but has now dropped to 10 during June and July, a 1 rig increase over May.
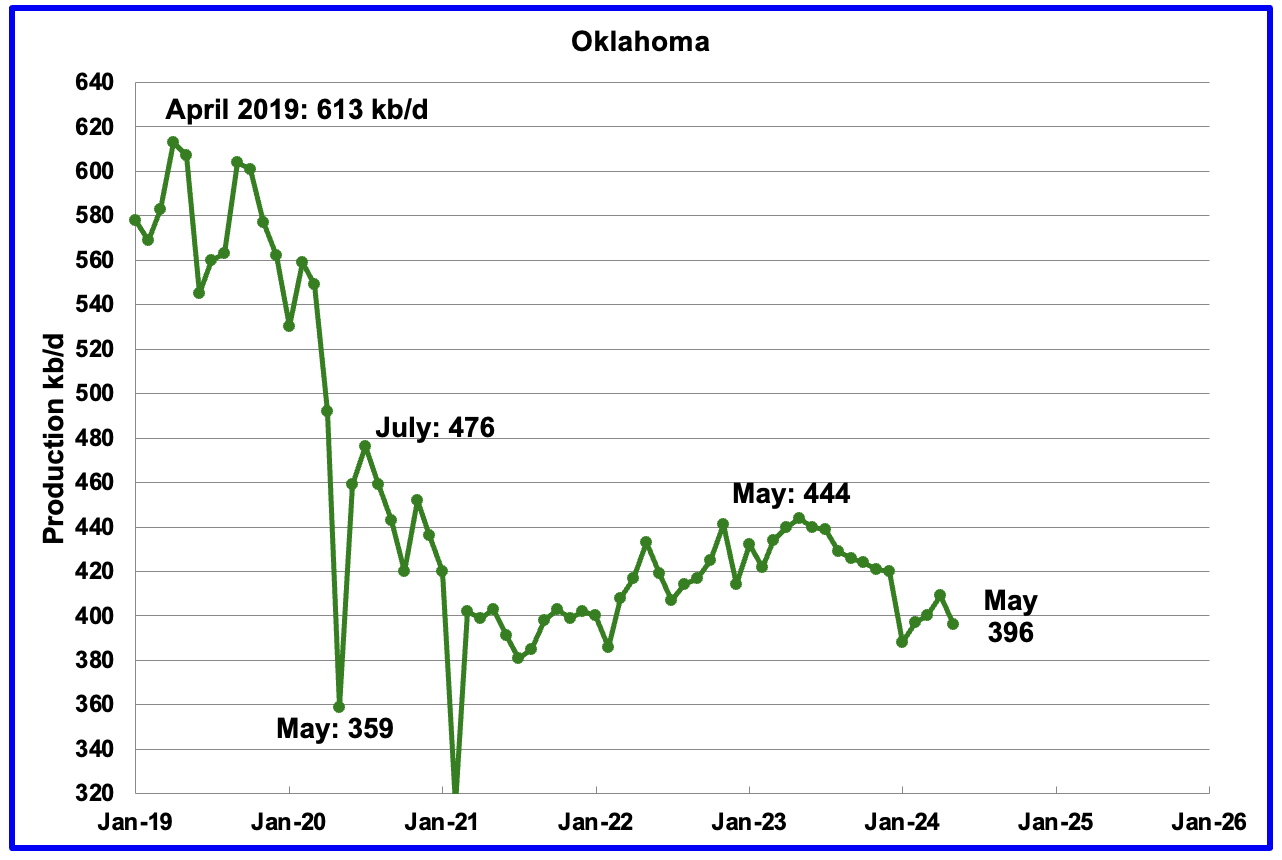
Oklahoma’s output in May dropped by 13 kb/d to 396 kb/d. Production remains below the post pandemic July 2020 high of 476 kb/d. Output appears to have entered a slow declining/plateau phase in June 2023. Oklahoma’s rig count dropped from 40 in May to 30 in July.
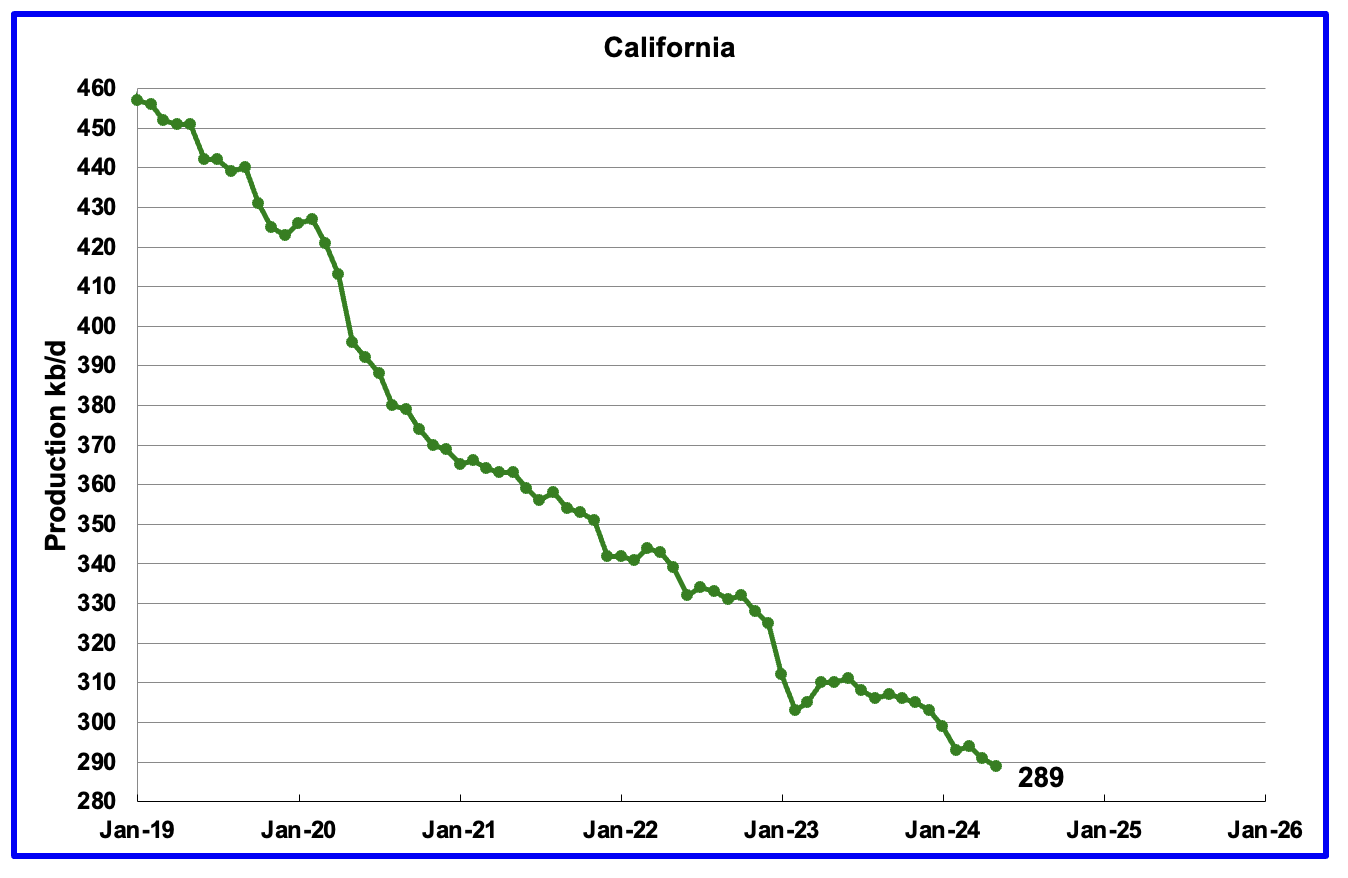
California’s declining production trend continues. Californiaʼs May production dropped by 2 kb/d to 289 kb/d.
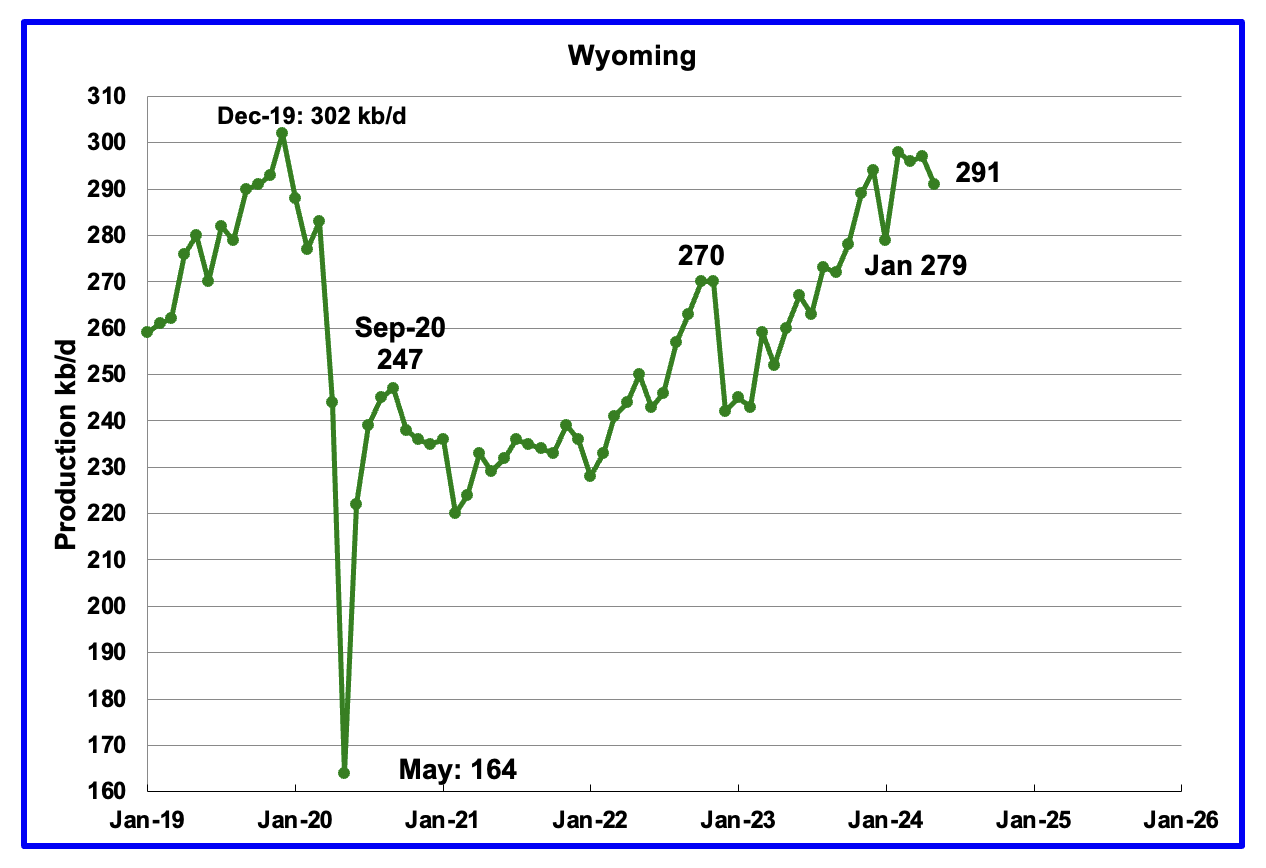
Wyoming’s oil production has been rebounding since March 2023. However the rebound was impacted by the January 2023 storm. May production dropped by 6 kb/d to 291 kb/d.
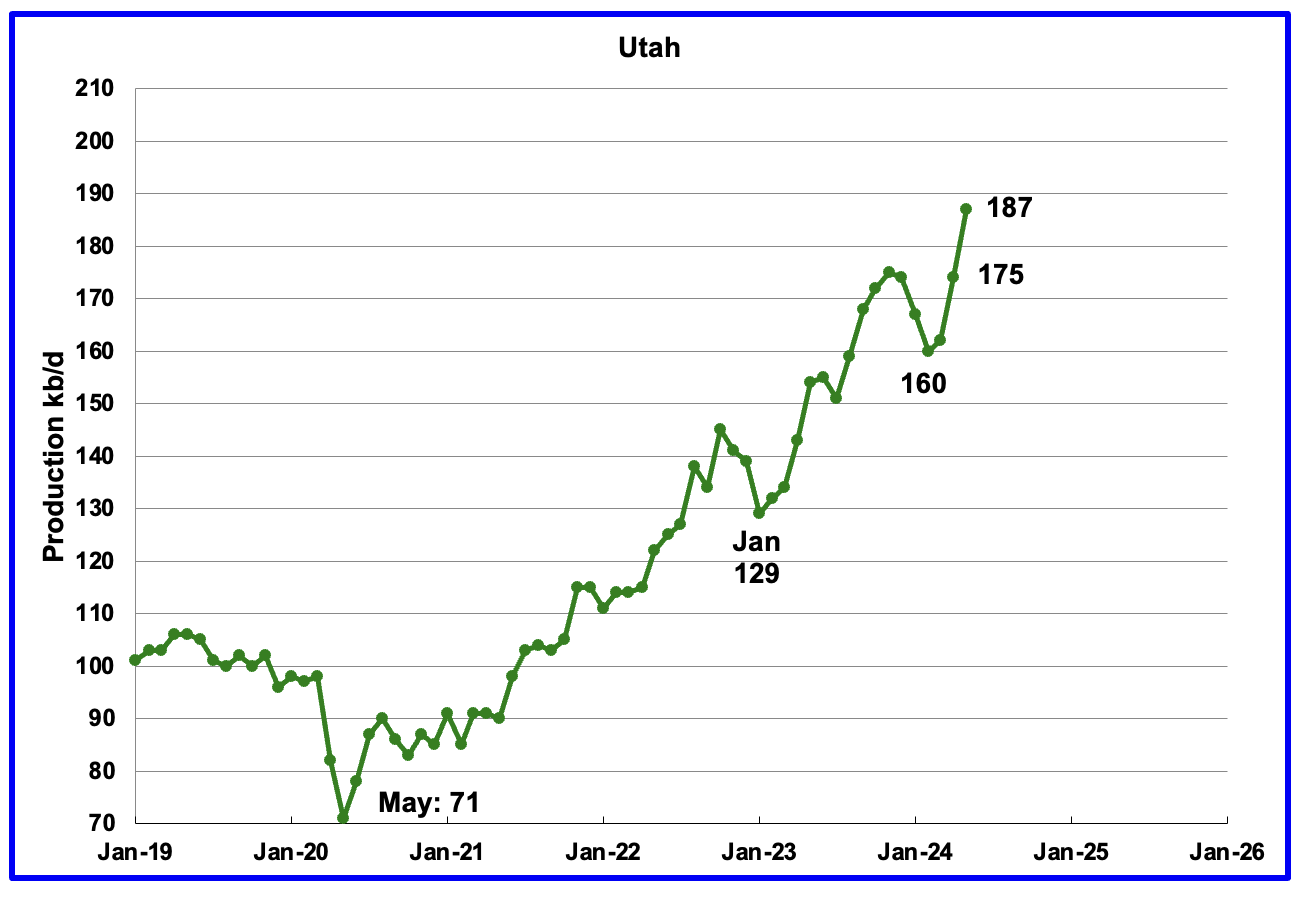
May’s production increased by 13 kb/d to 187 kb/d to a new high. Utah has had 9 oil rigs in operation through out 2024.
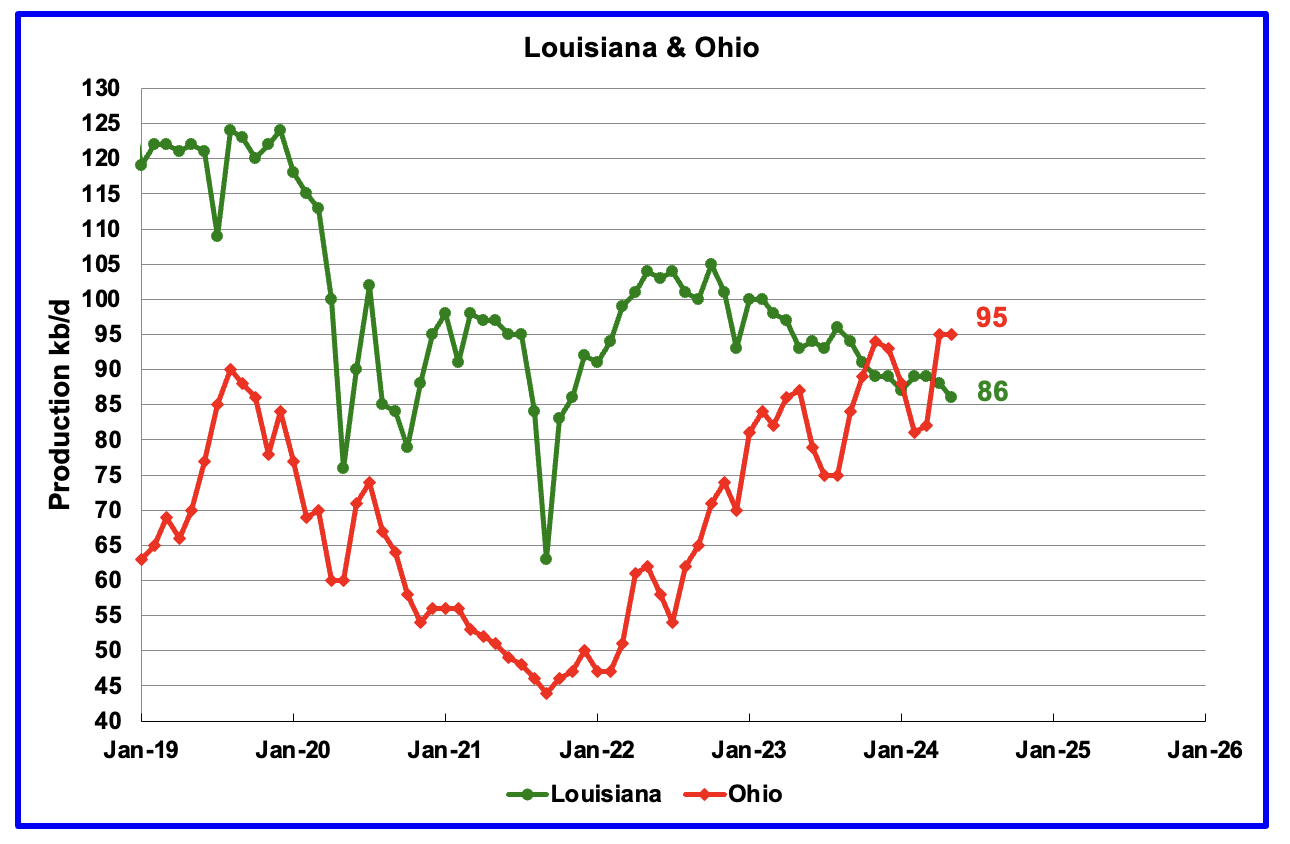
Ohio has been added to the Louisiana chart because Ohio’s production has been slowly increasing since October 2021 and passed Louisiana in November 2023.
Louisiana’s output entered a slow decline phase in October 2022. May’s production dropped by 2 kb/d to 86 kb/d. Ohio’s oil production was flat at 95 a new high. The most recent Baker Hughes rig report now shows two horizontal oil rigs operating in Ohio in July.
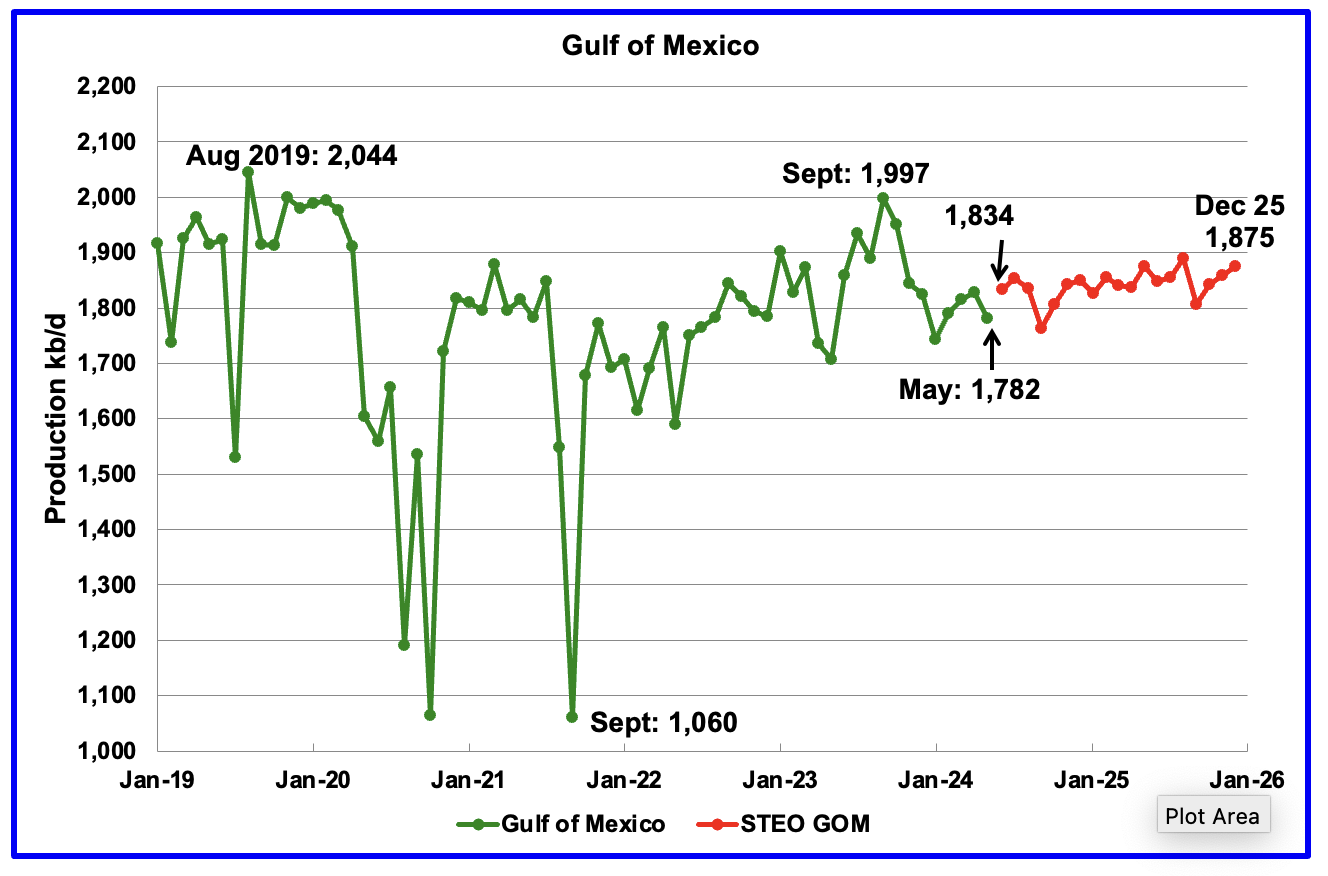
GOM production dropped by 46 kb/d in May to 1,782 kb/d but is expected to rise in June by 52 kb/d to 1,834 kb/d.
The July 2024 STEO projection for the GOM output has been added to this chart. It projects production from June 2024 to December 2025 will be essentially flat and will just increase by 41 kb/d to 1,875 kb/d, 38 kb/d lower than reported in the previous STEO.
According to this article, BP approved the Kaskida oil project in the GOM.
“The new floating production platform is designed to produce up to 80,000 barrels per day of crude oil from six wells in its initial phase, with production expected to commence in 2029.
Wholly owned by BP, the Kaskida field is estimated to hold approximately 275 mboe recoverable resources from the first phase alone.”
A Different Perspective on US Oil Production
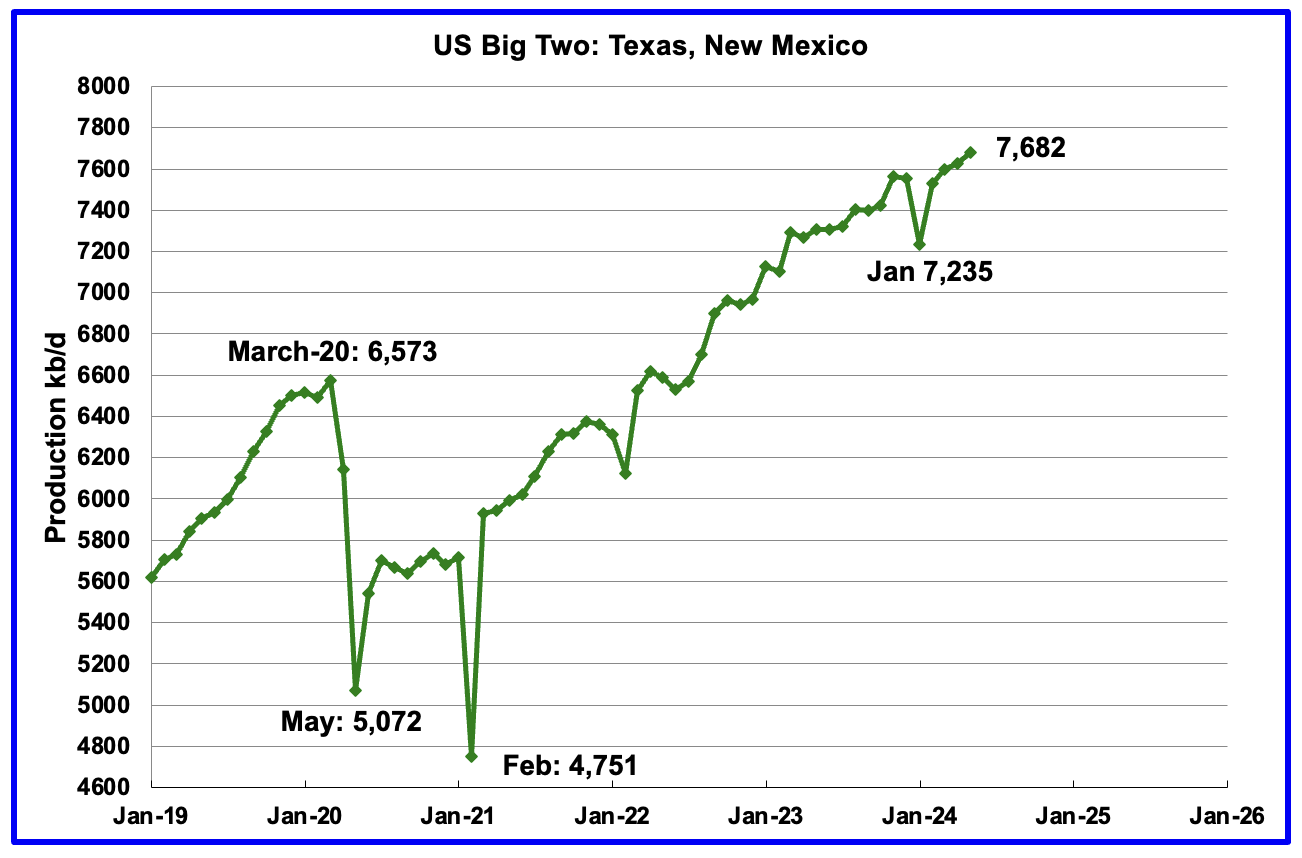
The Big Two states combined oil output for Texas and New Mexico.
May’s production in the Big Two states increased by a combined 55 kb/d to 7,682 kb/d with Texas adding 35 kb/d while New Mexico added 20 kb/d.
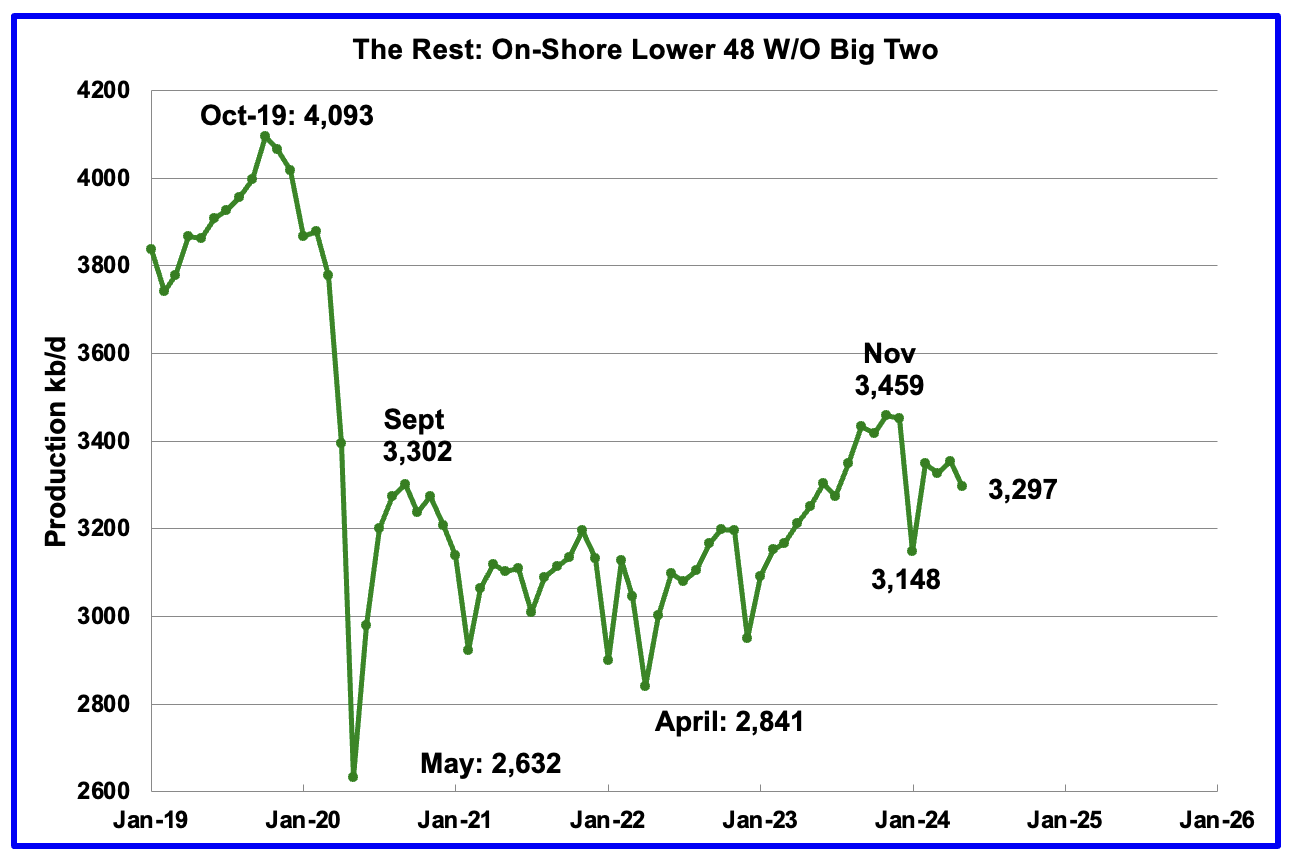
Oil production by The Rest
May’s oil production in The Rest dropped by 57 kb/d to 3,297 kb/d and is 162 kb/d lower than November 2023.
The main takeaway from The Rest chart is that current production is below the high of October 2019 and is a significant loss that occurred during the Covid shut down and will not be readily recovered.
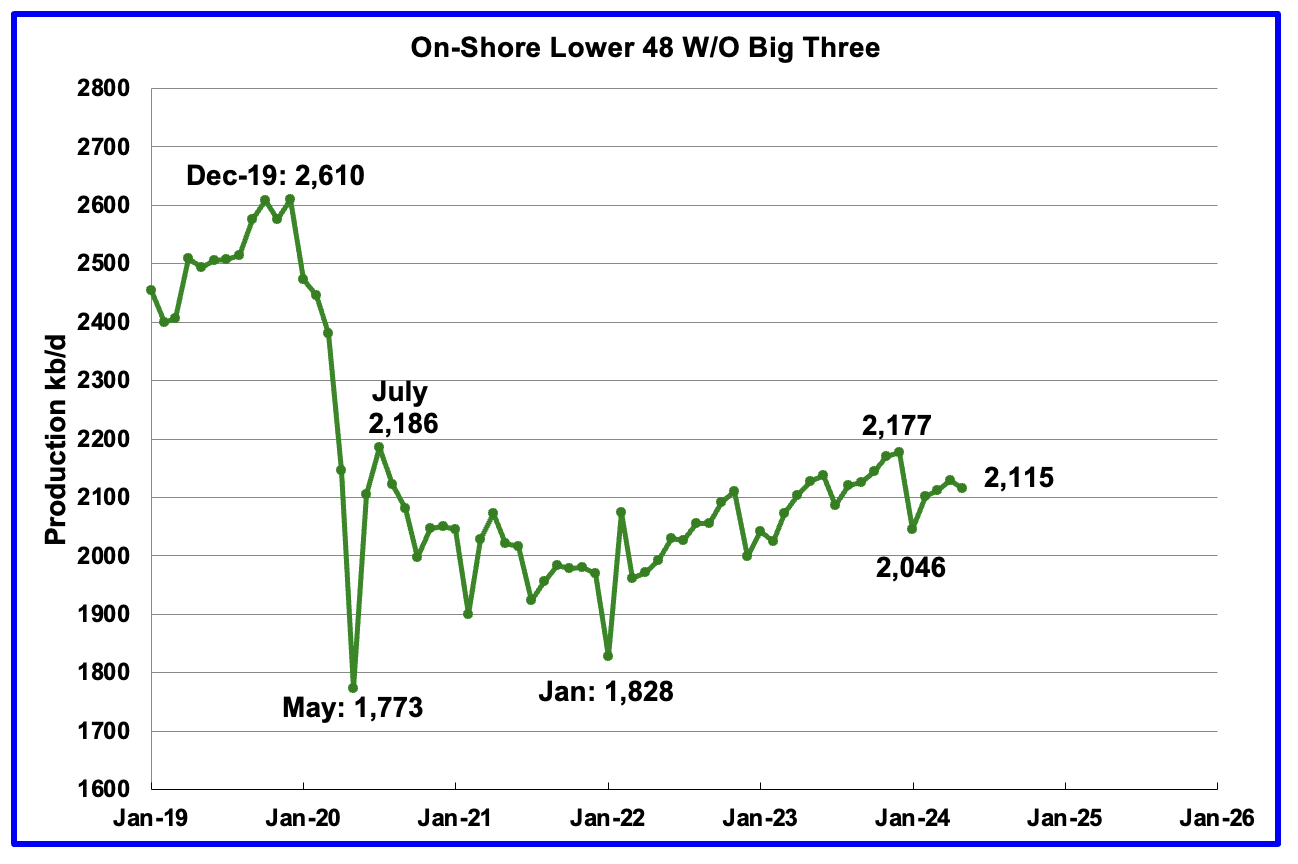
The On-Shore lower 48 W/O the big three, Texas, New Mexico and North Dakota, shows a plateau production in the range of 2,000 ±100 kb/d from January 2023.
May’s production decreased by 14 kb/d to 2,115 kb/d. Two of the bigger contributors with declines were Alaska 13 kb/d and Oklahoma 13 kb/d.
Permian Basin Report by Main Counties and Districts
This special monthly Permian section was recently added to the US report because of a range of views on whether Permian production will continue to grow or will peak over the next year or two. The issue was brought into focus recently by the Goehring and Rozencwajg Report which indicated that a few of the biggest Permian oil producing counties were close to peaking or past peak. Also comments by posters on this site have similar beliefs from hands on experience.
This section will focus on the four largest oil producing counties in the Permian, Lea, Eddy, Midland and Martin. It will track the oil and natural gas production and the associated Gas Oil Ratio (GOR) on a monthly basis. The data is taken from the state’s government agencies for Texas and New Mexico. Typically the data for the latest two or three months is not complete and is revised upward as companies submit their updated information. Note the natural gas production shown in the charts that is used to calculate the GOR is the gas coming from both the gas and oil wells.
Of particular interest will be the charts which plot oil production vs GOR for a county to see if a particular characteristic develops that indicates the field is close to entering the bubble point phase. While the GOR metric is best suited for characterizing individual wells, counties with closely spaced horizontal wells may display a behaviour similar to individual wells due to pressure cross talking . For further information on the bubble point and GOR, there are a few good thoughts on the intricacies of the GOR in an earlier POB comment. Also check this EIA topic on GOR.
New Mexico Permian
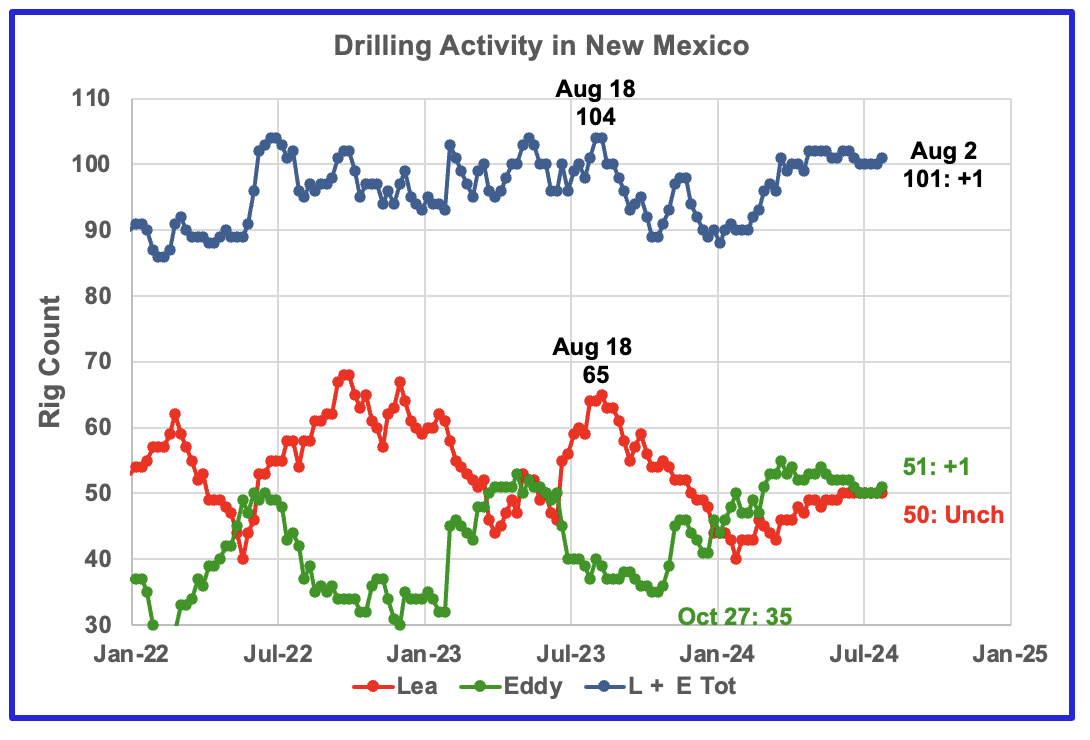
Since the middle of August 2023, the Lea county rig count has dropped from 65 rigs to 40 rigs in late January 2024. Since then the rig count has slowly risen by 10 to 50 rigs at the end of July. At the same time production has increased to 1,185 kb/d over the period January 2023 to May 2024. However due to a time lag between rig count and production, Lea may be on the verge of entering a decline phase. See next chart.
From a low of 35 rigs in late October 2023, 20 rigs were transferred into Eddy county between October and March 2024. At its peak in late March 2024, Eddy county had 55 rigs operating. Currently 51 rigs are operating and are up 1 from last week. Something is happening in Eddy county which is starting to show up in the production chart further down. Currently production is following/paralleling the decline in the rig count.
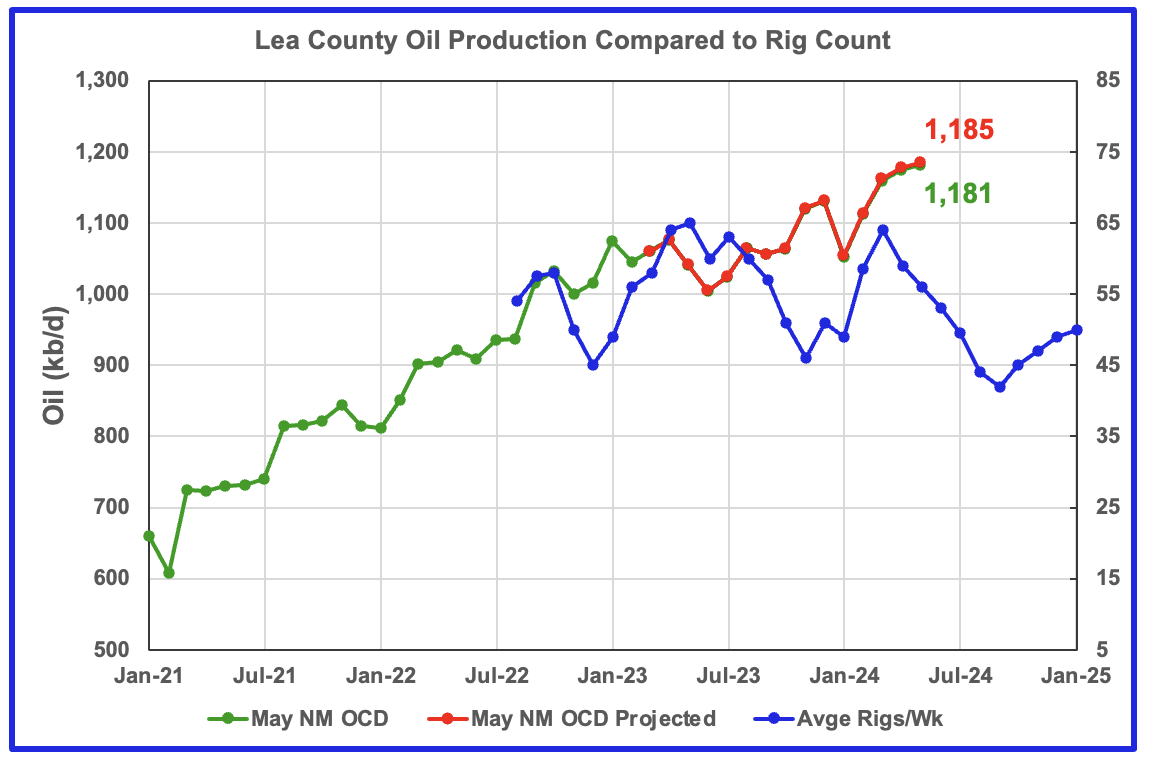
In the last post I made this call: Lea County has peaked. May production will be flat or slightly down
Looks like we will have to wait for another month or two to see how close Lea county is to peaking. Typically the New Mexico monthly update is complete within three days after the first big upload. On the fourth day both Lea and Eddy counties were down and I posted this Lea chart in the OPEC comments post. In checking the NM site last week there was a significant update. For some unknown reason the posting of the latest updated NM production was delayed.
Preliminary May data from the New Mexico Oil Conservation Division indicates Lea County’s oil production increased by 6 kb/d to 1,181 kb/d. A projection for May’s final production estimates it will be closer to 1,185 kb/d.
The blue graph shows the average number of weekly rigs operating during a given month as taken from the weekly rig chart. The rig graph has been shifted forward by 7 months. So the 64 Rigs/wk operating in August 2023 have been time shifted forward to March 2024 to show the possible correlation and time delay between rig count and oil production. Comparing the production and rig count graphs, it appears that the rig count should be shifted forward by 8 or 9 months, rather then seven, if it is assumed that production should track rig count, shifted by a number of months..
The recent monthly production increments for February, March, April and May are 59 kb/d, 48 kb/d, 15 kb/d and 6 kb/d respectively. At this decreasing production rate, we should expect the June increment to be flat or negative, provided production follows the rig graph.
Note that rig counts are being used to project production as opposed to completions because very few extra DUCs are being completed at this time.
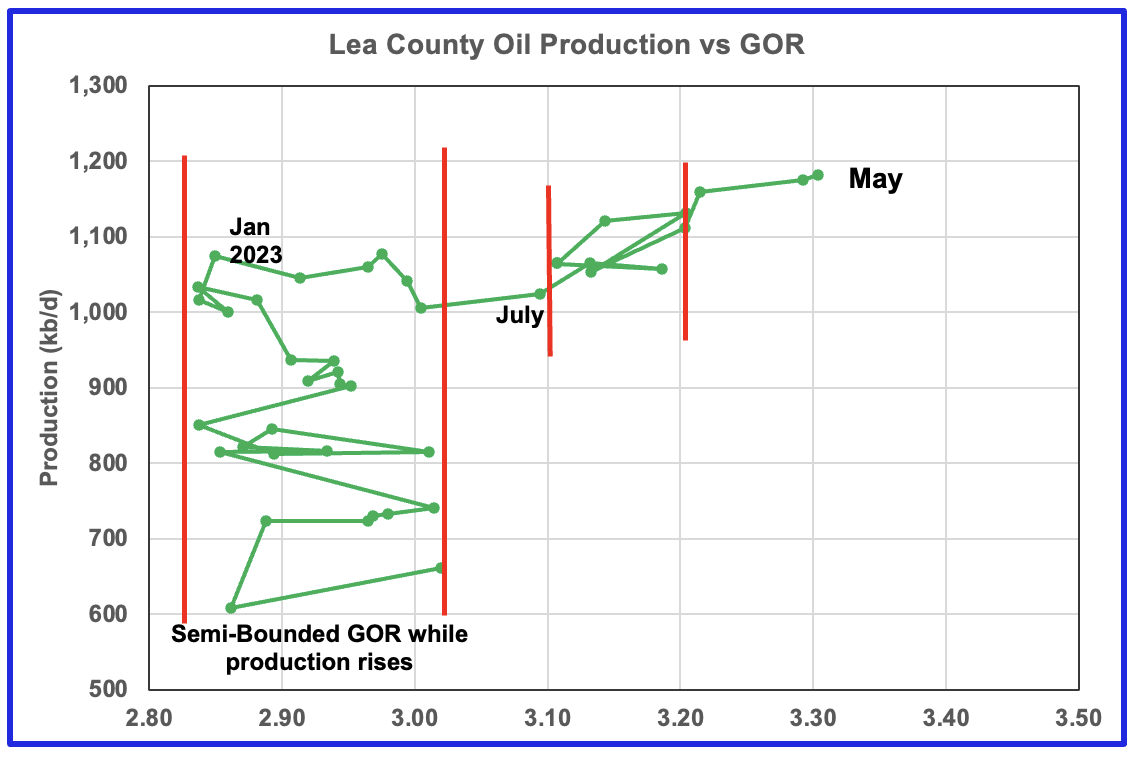
After much zigging and zagging, oil production in Lea county stabilized just above 1,000 kb/d In early 2023. Once production reached a new high in January 2023, production essentially plateaued but the GOR started to increase rapidly to the right and entered the bubble point phase in July 2023. However the Lea county GOR has continued to increase as production reached a new high in April 2024. This may indicate that the current production increase is coming from a new bench/area since the GOR’s behaviour since August 2023 to March 2024 time frame appears once again to be in a semi bounded GOR phase accompanied with rising production. However in April and May, the GOR moved out of the second semi bounded GOR region and production reached a new high by 6 kb/d along with a slight increase in the GOR.
This zigging and zagging GOR pattern within a semi-bounded GOR while oil production increases to some stable level and then moves out to a higher GOR to the right has shown up in a number of counties. See an additional two cases below.
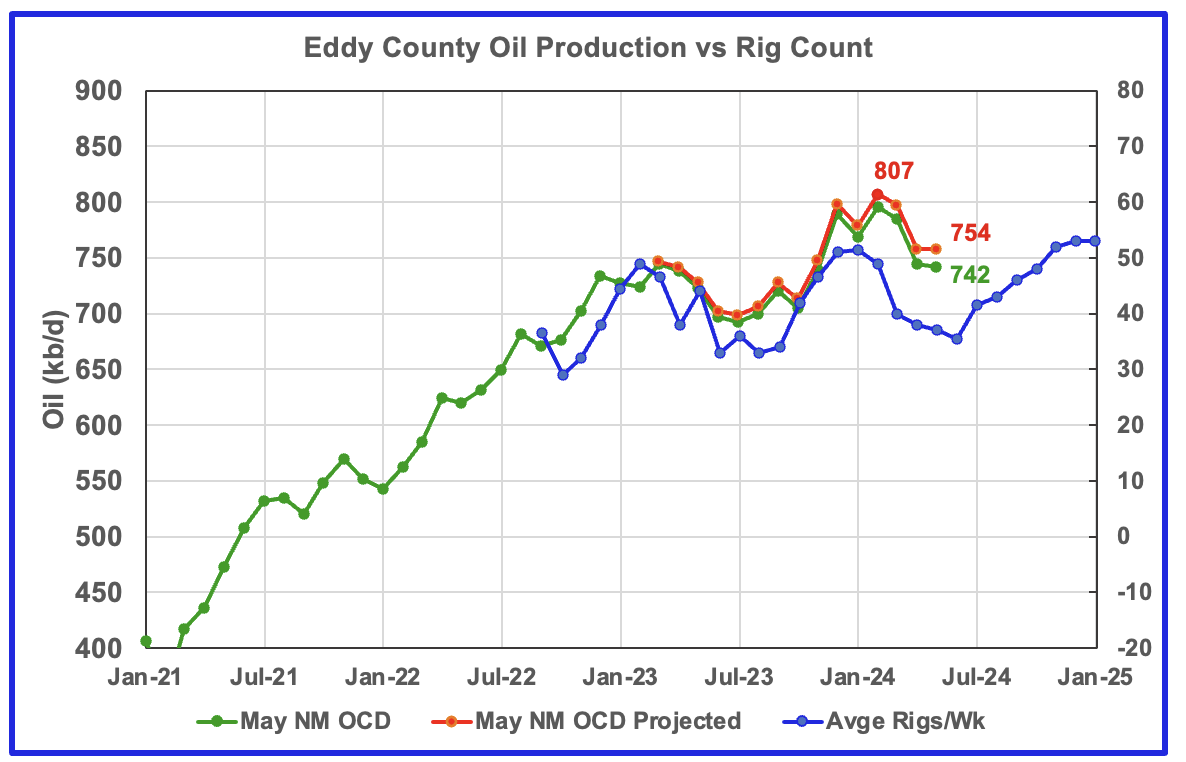
Eddy County oil production has peaked and appears to be tracking the rig graph.
Eddy county oil production hit a projected high of 807 kb/d in February 2024. March, April and May production dropped by 11 kb/d, 40 kb/d and 2 kb/d respectively to 742 kb/d. The NM OCD projection estimates that the updated production from May in a few months will show that May production was flat at 754 kb/d.
The blue graph shows the average number of weekly rigs operating during a given month as taken from the above weekly drilling chart. The rig graph has been shifted forward by 8 months to roughly coincide with the increase in the production graph starting in October 2023.
If production were to follow the rig count trend going forward, Eddy production should continue to drop till June before rising again starting in June/July. However that does not mean that production will exceed the February peak of 807 kb/d. It is the increasing legacy decline that will limit how much production can increase from the next low when it is reached.
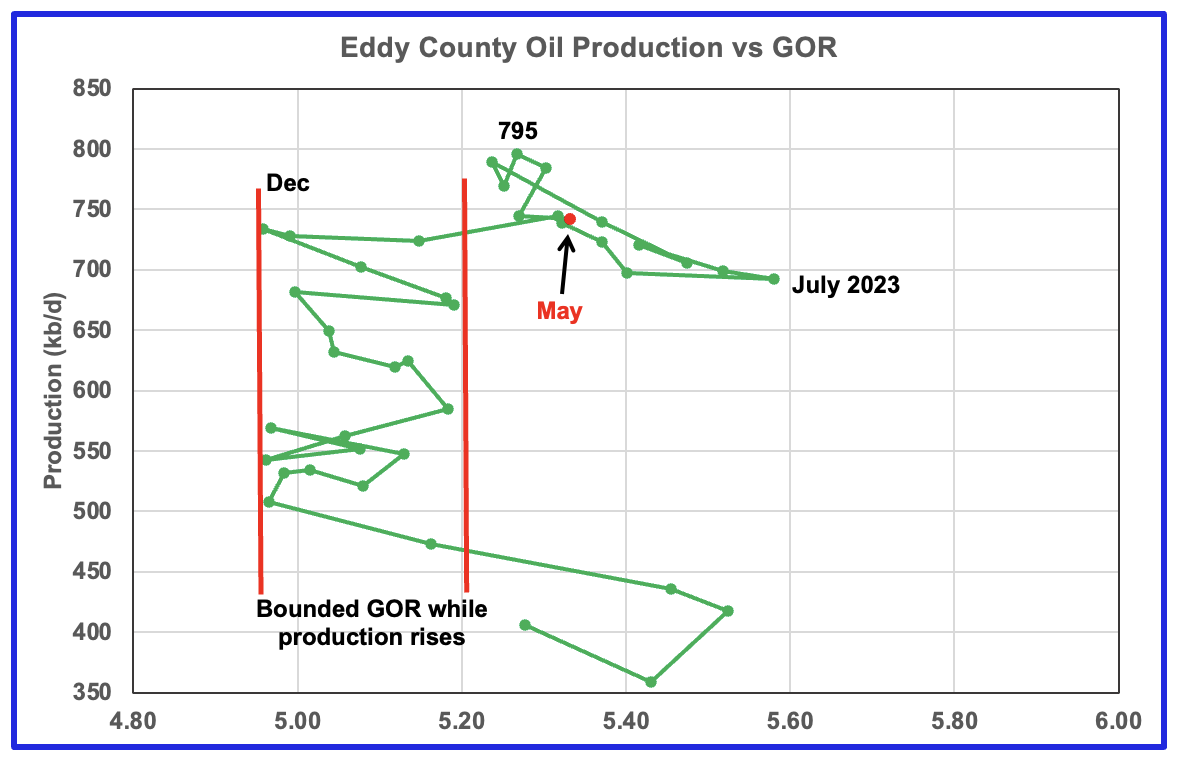
The Eddy county GOR pattern is similar to Lea county except that Eddy broke out from the semi bounded range earlier and for a longer time.
August 2023 saw a reversal in the increasing GOR trend by decreasing which then was followed by the current oil production increase which reached a new high in February 2024, 795 kb/d, an atypical pattern. Since February, production has fallen and the GOR has been essentially unchanged. For the last five months the GOR moved within a narrow range of 5.25 and 5.33, with 5.33 being the GOR for May 2024, red marker.
Regardless production in Eddy county has begun to decline.
Texas Permian
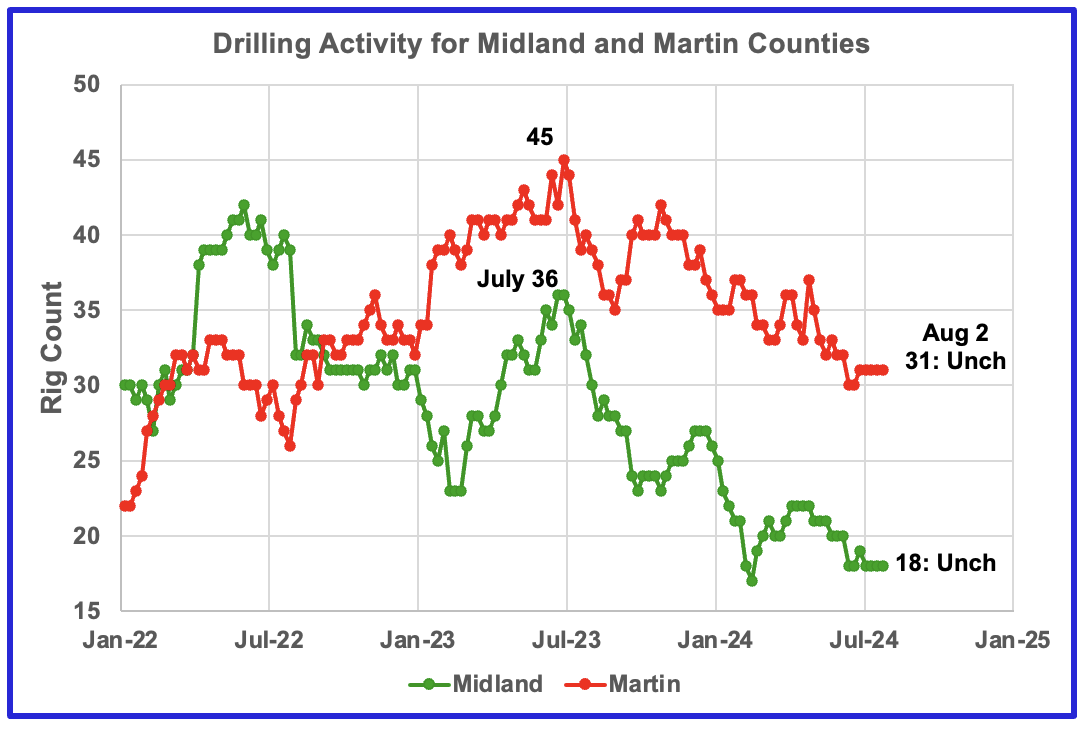
The rig count in Midland county has been dropping since July 2023. Midland county rigs continued to drop in June 2024 and have stabilized in July at 18. Rigs are down 50% from where they were in July 2023.
Martin county rigs are also in a slow decline and at the end of July the rig count totalled 31, down 6 from the beginning of May and are down 33% from the high of 45 in July 2023.
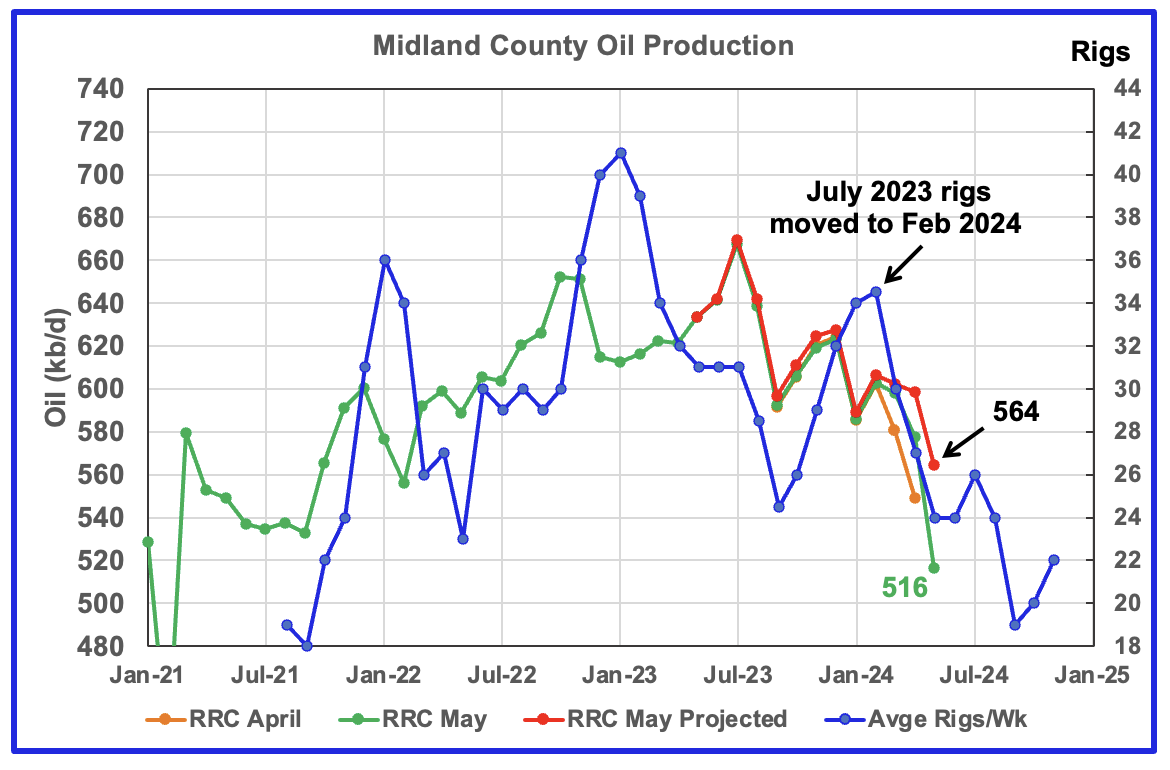
Midland County has peaked.
Midland County’s slow and steady declining oil production phase started in August 2023. The green graph shows May’s preliminary production as reported by the Texas RRC. Midland county’s May preliminary production dropped by 62 kb/d to 516 kb/d. The projected production estimates that May’s production actually dropped less, by 34 kb/d to 564 kb/d.
The orange and green graphs show the production reported by the Texas RRC for April and May. Note that the last month in the May production graph is lower than the last month in the April production graph. This is why the projection shows May’s production is lower than April’s. Also this is an indicator that a county or district may be in a declining phase if this trend is repeated over a few months.
The blue graph shows the average number of weekly rigs operating during a given month as taken from the weekly drilling chart. The rig graph has been shifted forward by eight months. So the average 34.5 Rigs/wk operating in July 2023 have been moved forward to February 2024 to show the possible correlation and time delay between rig count and oil production. If the eight month shift in the rig count is approximately correct in that oil production can be tied to the rig count, oil production in Midland county should continue to drop for the next 5 to 6 months.
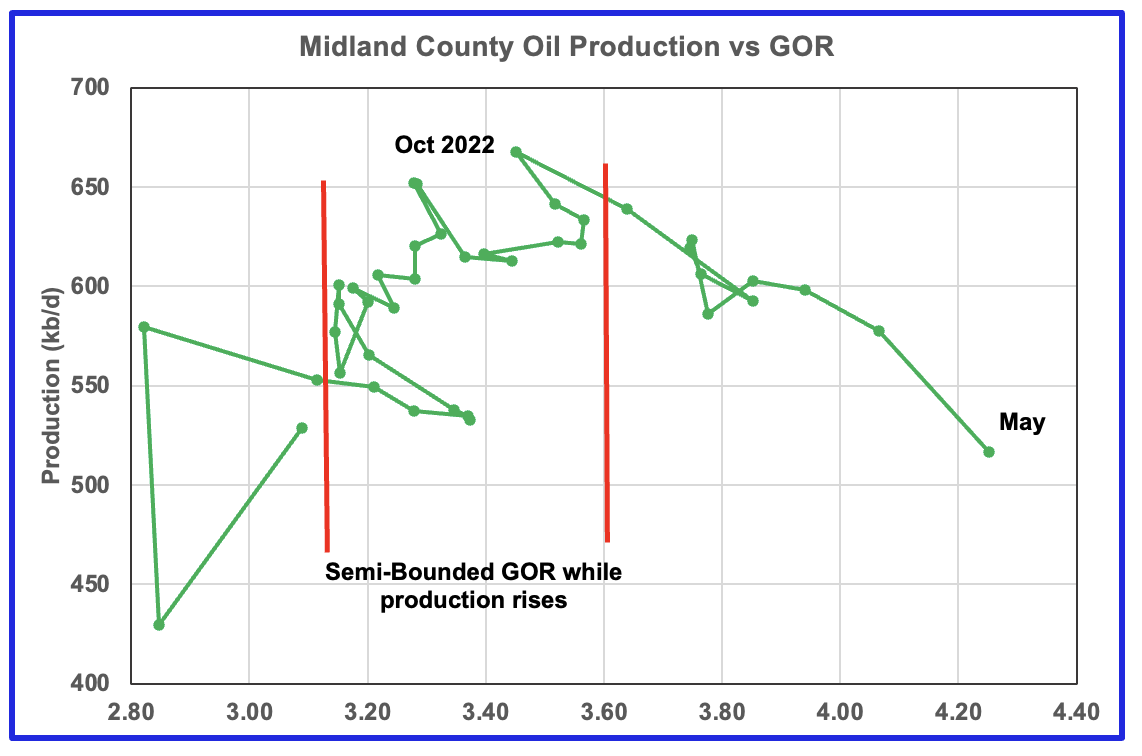
With Midland county deep into the bubble point phase, oil production continues to drop from previous highs, based on the previous graph, and should continue to drop. Note that oil production and GOR in this chart is based on the RRC’s preliminary May production report.
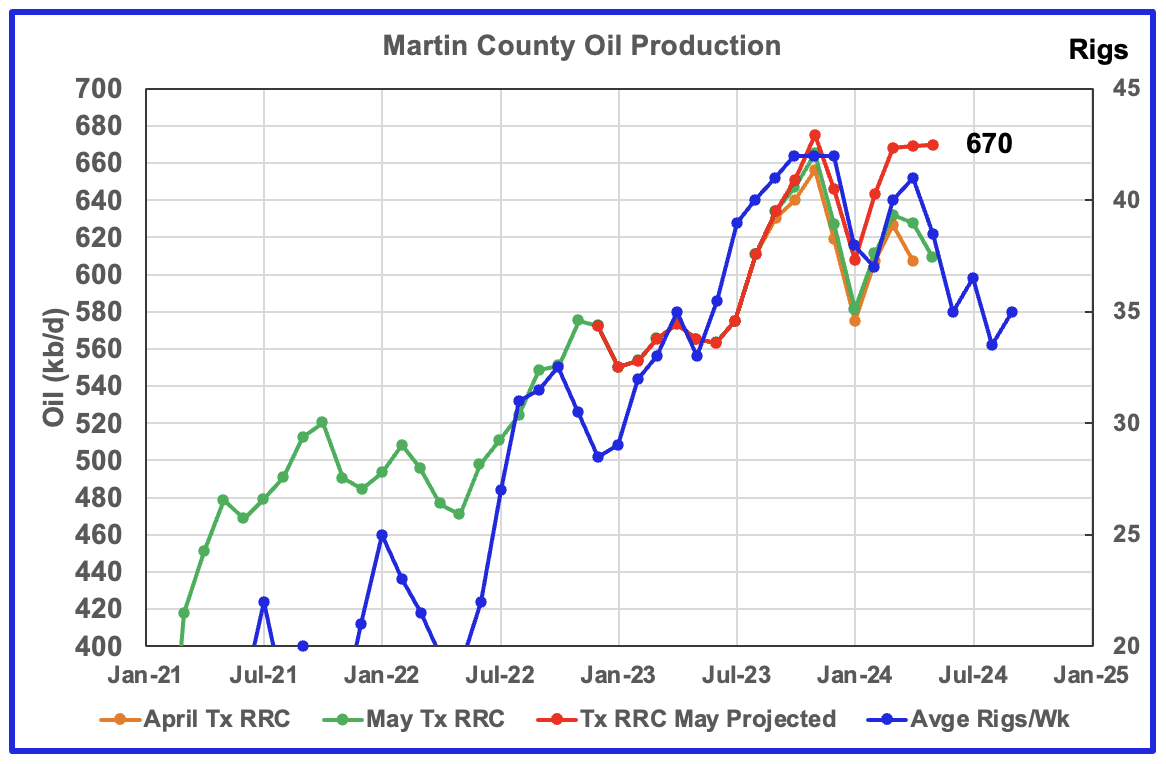
Martin County has peaked and is on a plateau just prior to entering its decline phase.
This chart shows Texas RRC oil production for Martin County. It was showing initial signs of peaking in November 2023 followed by declining production to January 2024. Production has been tracking the increasing rig count according to the time shifted rig count. March, April and May production has been essentially flat at 670 kb/d and 5 kb/d lower than the November peak of 675 kb/d.
The red graph is a production forecast which the Texas RRC could be reporting for Martin county about one year from now as drillers report additional updated production information. This projection is based on a modified methodology that used April and May production data and will be re-estimated each month going forward. Production should fall in June if production follows the rig count.
The orange and green graphs show the production reported by the Texas RRC for April and May. Note that in this case, the last month in the May production graph is a tad higher than the last month in the April production graph and is why May production is slightly higher than April.
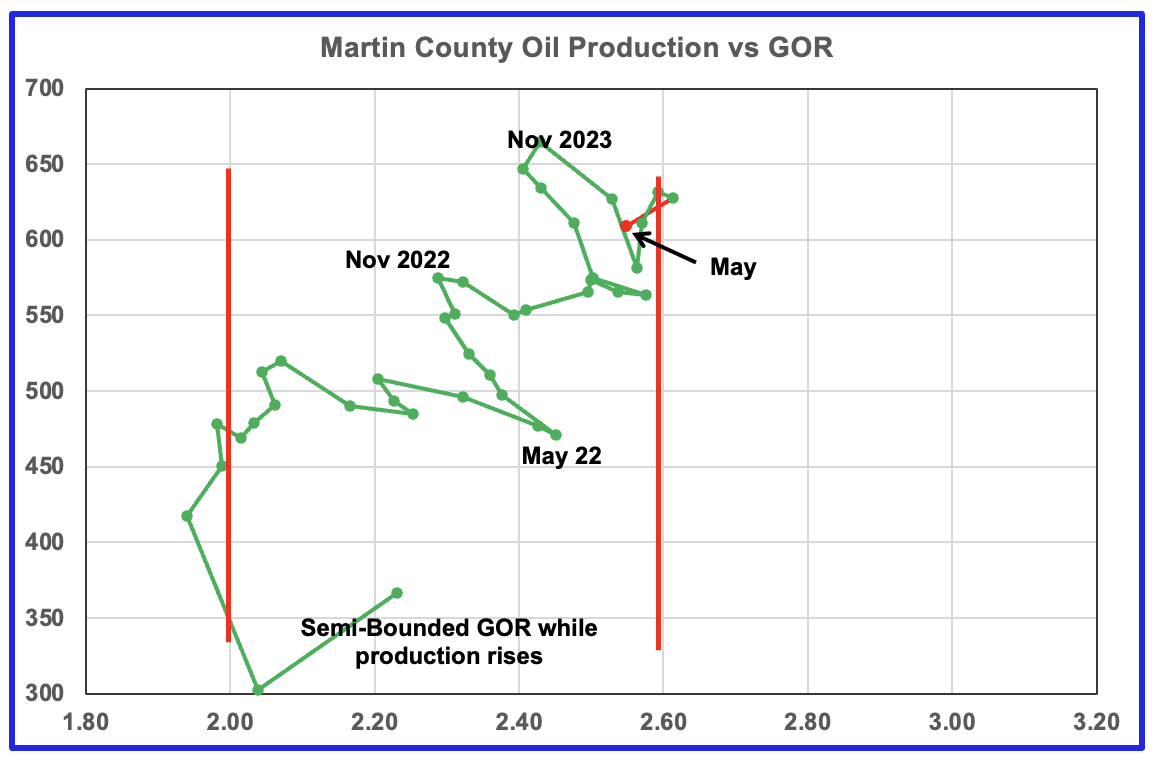
Martin county’s oil production and GOR up to November 2023 stayed within the semi bounded range and near peak oil production. However January, February and March saw production move higher while the GOR remained essentially unchanged at close to 2.6. May’s preliminary gas and oil production indicates that there was a small decrease in the GOR to below 2.6, red marker. Martin county has the lowest GOR of the four counties at a GOR of close to 2.60. Martin County may be on the verge entering the bubble point phase that should result in a dropping oil production trend.
Exactly where to put the right hand red GOR boundary for Martin county is not exactly obvious. It is possible that the right boundary should be closer to a GOR of 2.5.
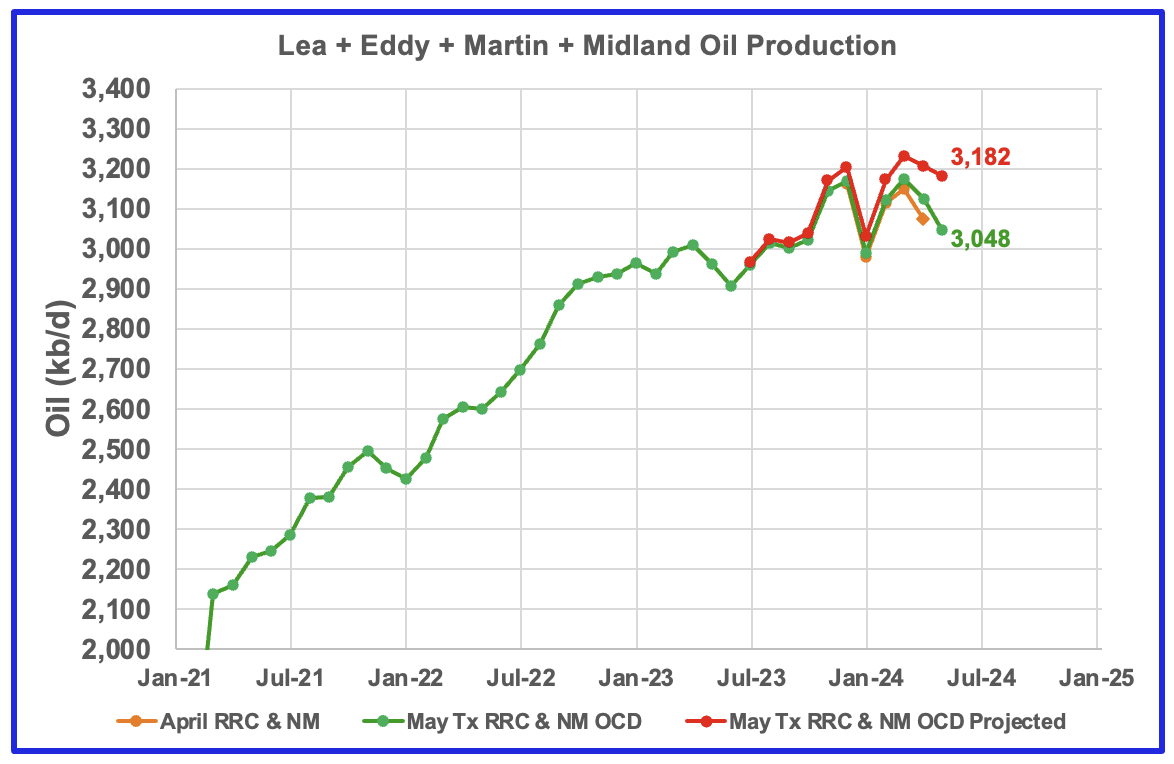
This chart shows the total production from the four largest Permian counties. Assuming that current May Permian production is close to 6,300 kb/d, these four counties account for 50% of the total. If their combined production has peaked, the Permian has peaked. A few more months of data is required to confirm that the Permian has also peaked.
The April and May initial production data is shown in the orange and green graphs respectively. The red graph uses the April and May data to project an estimate for the final May production.
Findings
– Lea County production in June will be flat or negative, provided it follows the decline in rig count.
– Eddy County oil production peaked in February 2024
– Midland county peaked in July 2023
– Martin County is on a plateau prior to heading into its decline phase.
A note on assumptions. In the above charts of production vs rig count, the rig count has been shifted forward by 7 to 8 months and the assumption is made that production follows rig count. The underlying assumption for doing that is that no more or very few DUCs are being used. Also implicit in making the above calls is that the drillers and frackers are using the latest technology, i.e. 3 mile laterals, max proppant and chemicals and some refracs. I have no basis for assuming this assumption is correct.
Two Texas Counties
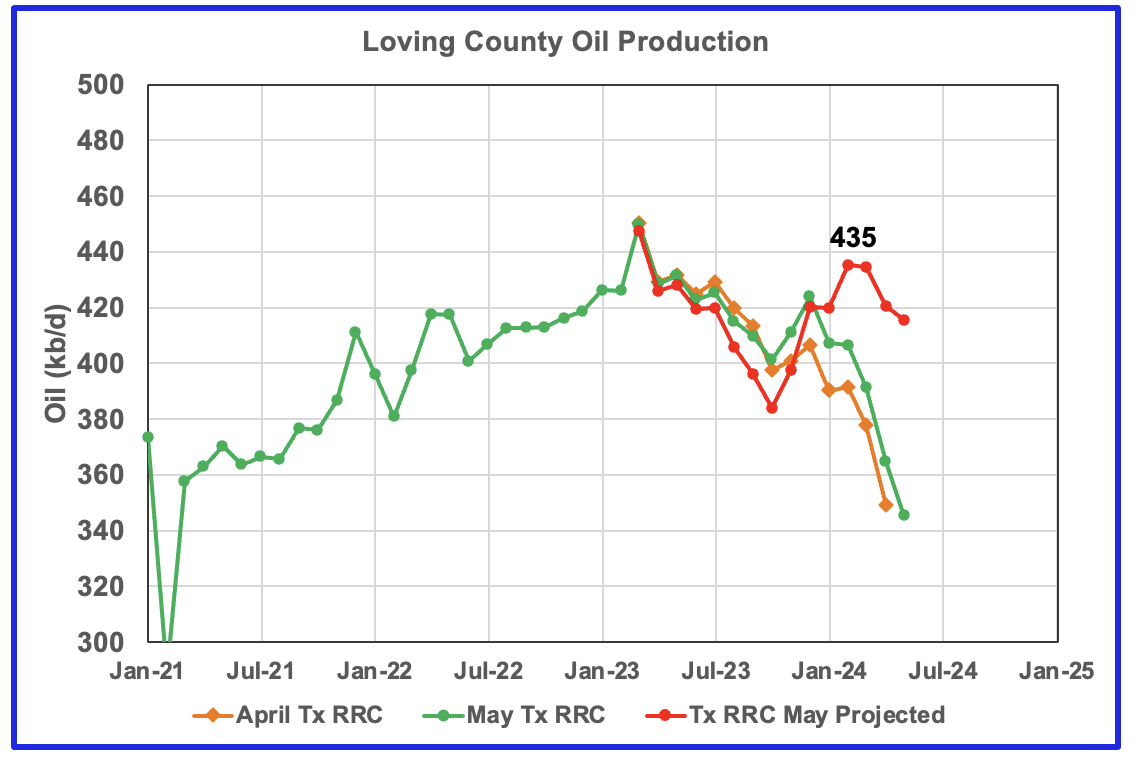
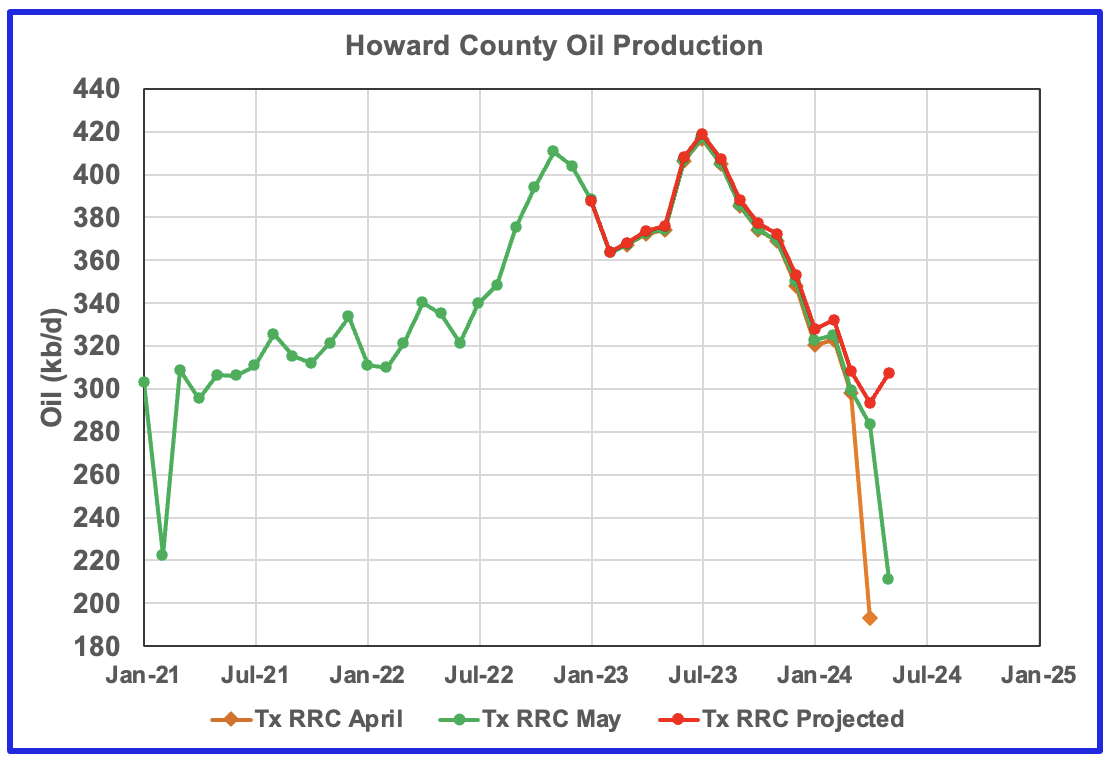
These two counties are ranked #4 and #5 in terms of Texas oil production. However while Howard county is showing a small increase in production, Loving production has dropped from 470 kb/d in February in the previous report to 435 kb/d in this report. This is not an isolated case and has led me to believe the May Texas reports for some counties have not been fully processed or the drillers have been late in submitting their reports.
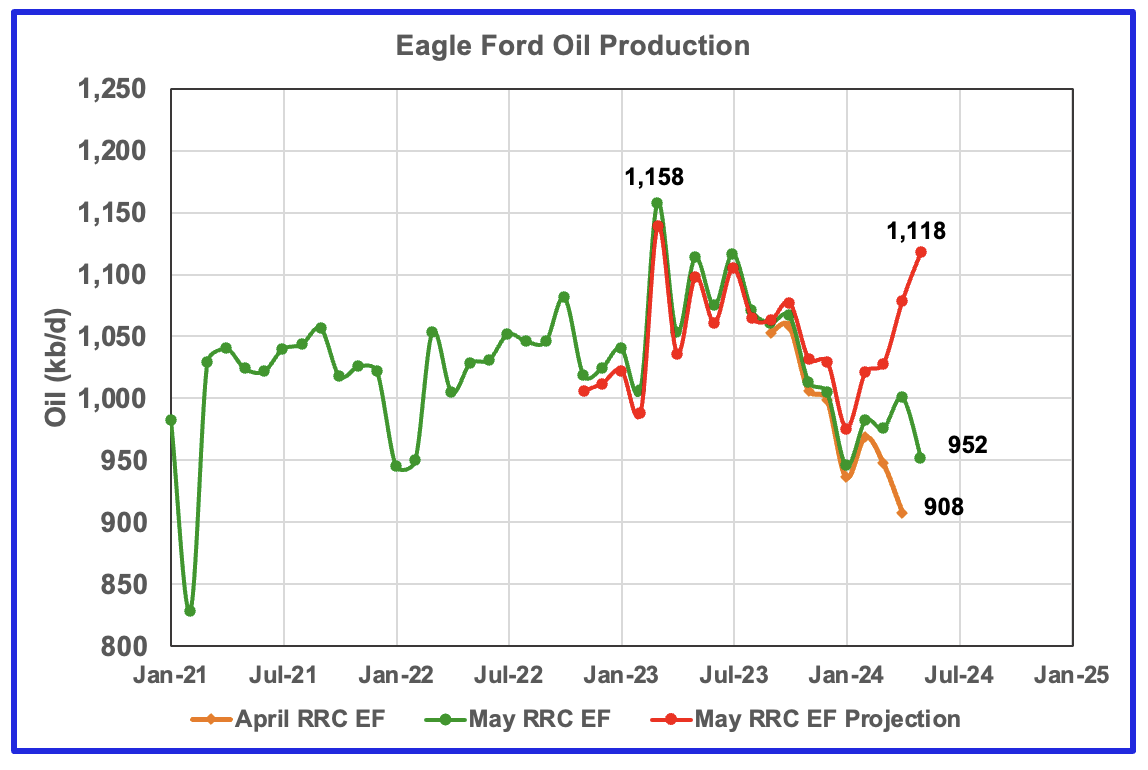
This chart captures Eagle Ford production by summing production from Districts 1 and 2 which cover most of the Eagle Ford basin. Production in the Eagle Ford is down from the March 2023 peak but has continued to rebound in 2024. Production increased by 39 kb/d in the EF projection graph to 1,118 kb/d.
Drilling Productivity Report
The Drilling Productivity Reports that were published in June/July were in a new format and were included as part of the STEO and were not updated. It also appears that the DPR will only provide production information up the month preceding publication as opposed to the earlier version that provided data for the upcoming month after the publication.
The Drilling Productivity Report (DPR) uses recent data on the total number of drilling rigs in operation along with estimates of drilling productivity and estimated changes in production from existing oil wells to provide estimated changes in oil production for the principal tight oil regions. The new DPR report in the STEO forecasts actual production to June 2024 and projects output to December 2025. The DUC charts and Drilled Wells charts are updated to June 2024.
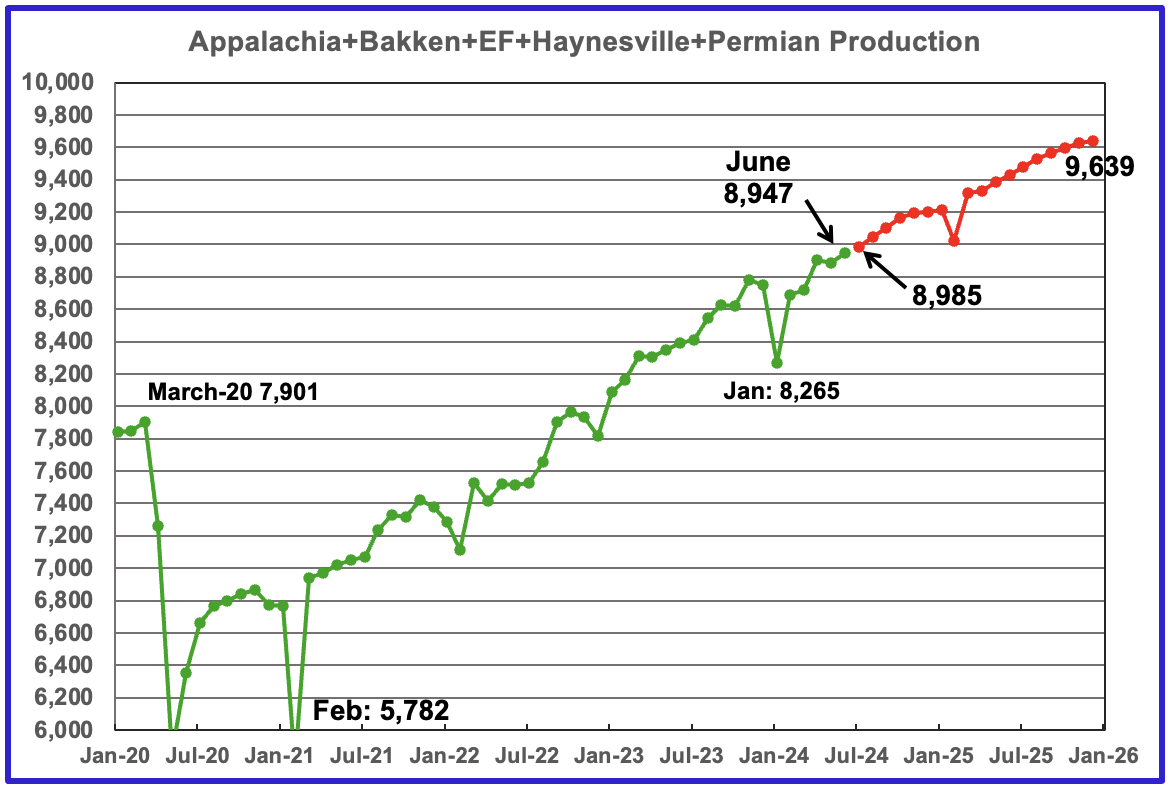
The total oil production to June 2024 for the 5 DPR regions that the EIA tracks is shown above. Also a projection by the STEO to December 2025 has been added, red markers. Note DPR production includes both LTO oil and oil from conventional wells. Production for the Anadarko and Niobrara regions is no longer available.
The DPR is projecting oil output in June 2024 for these five regions will increase by 60 kb/d to 8,947 kb/d. Production is projected to grow almost linearly to December 2025 to 9,639 kb/d.
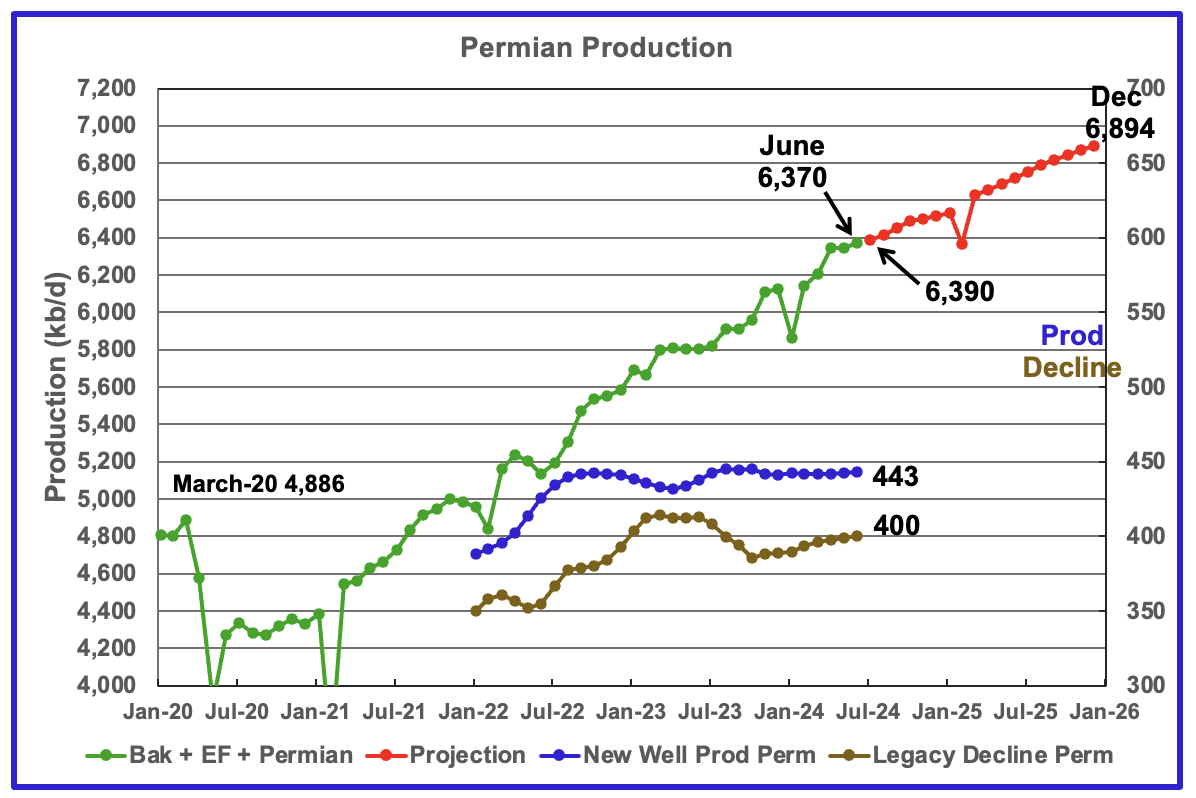
According to the EIA’s July DPR report, Permian output will continue its slow rise in June and going forward. It is expected to increase by 22 kb/d to 6,370 kb/d in June. June production has been revised up by 183 kb/d from 6,187 kb/d in the original DPR report. By December 2025 output is expected to be 6,894 kb/d. The DPR is projecting that production is expected to rise by an average of close to 29 kb/d/mth going forward.
Note that this DPR Permian projection is totally opposite to what is reported in the Permian section above.
Production from new wells and legacy decline, right scale, have been added to this chart to show the difference between new production and legacy decline. For comparison, in the previous DPR report new well production was 444 kb/d and legacy decline was 426 kb/d, a difference of 18 kb/d vs the newly reported difference of 43 kb/d shown above. The major change is in the legacy decline.
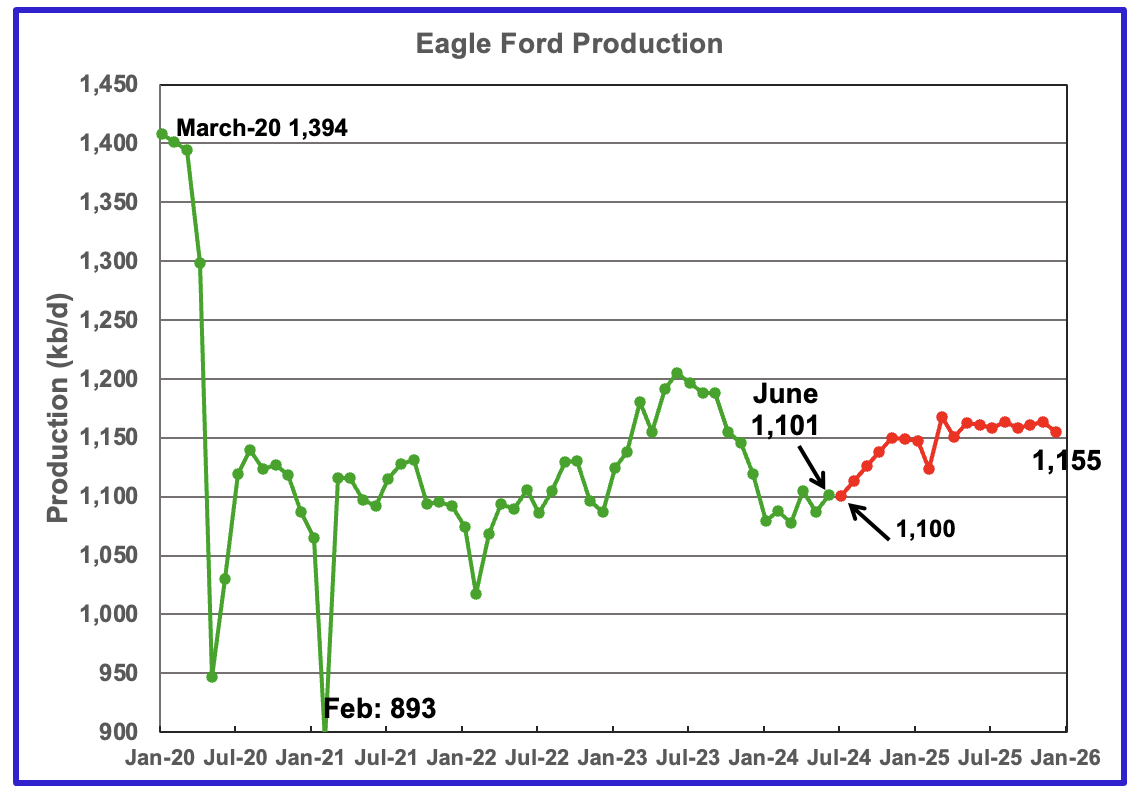
Output in the Eagle Ford basin has been on a plateau for the last 5 months. For June production is expected to increase by 14 kb/d to 1,101 kb/d. However production is expected to reach 1,150 kb/d in November and remain there till December 2025. The red graph is a projection by the STEO.
Since the beginning of 2024, the Eagle Ford rig count has been close to 47 ± 2 rigs. The current rig count is 44 which may account for its relatively flat output.

The DPR/STEO forecasts Bakken output in June will rise by 18 kb/d to 1,287 kb/d. However June production has been revised down from 1,113 kb/d in the July STEO by 26 kb/d to 1,287, so actually June production may be down by 26 kb/d. The STEO projection out to December 2025 shows output varying between 1,300 kb/d and 1,350 kb/d over the next 18 months.
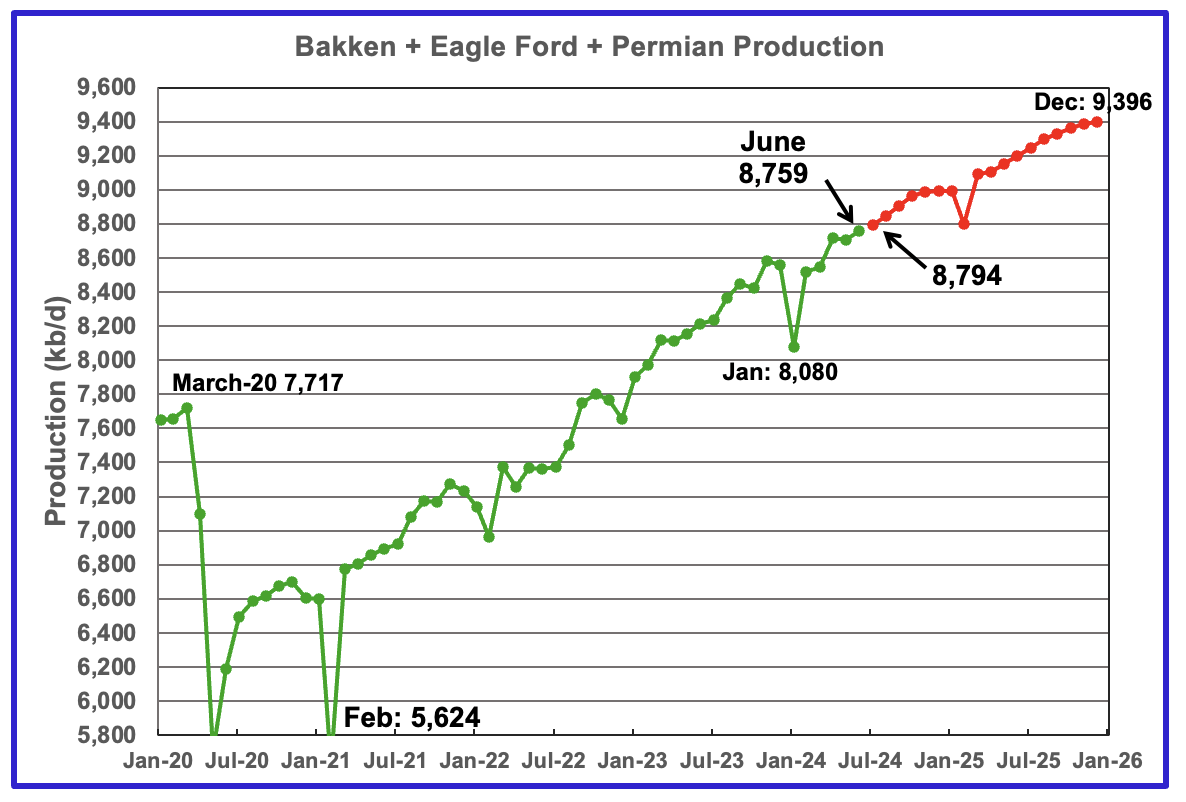
This chart plots the combined production from the three main LTO regions. For June output rose by 56 kb/d to 8,759 kb/d. Production in December 2025 is expected to reach 9,396 kb/d.
DUCs and Drilled Wells
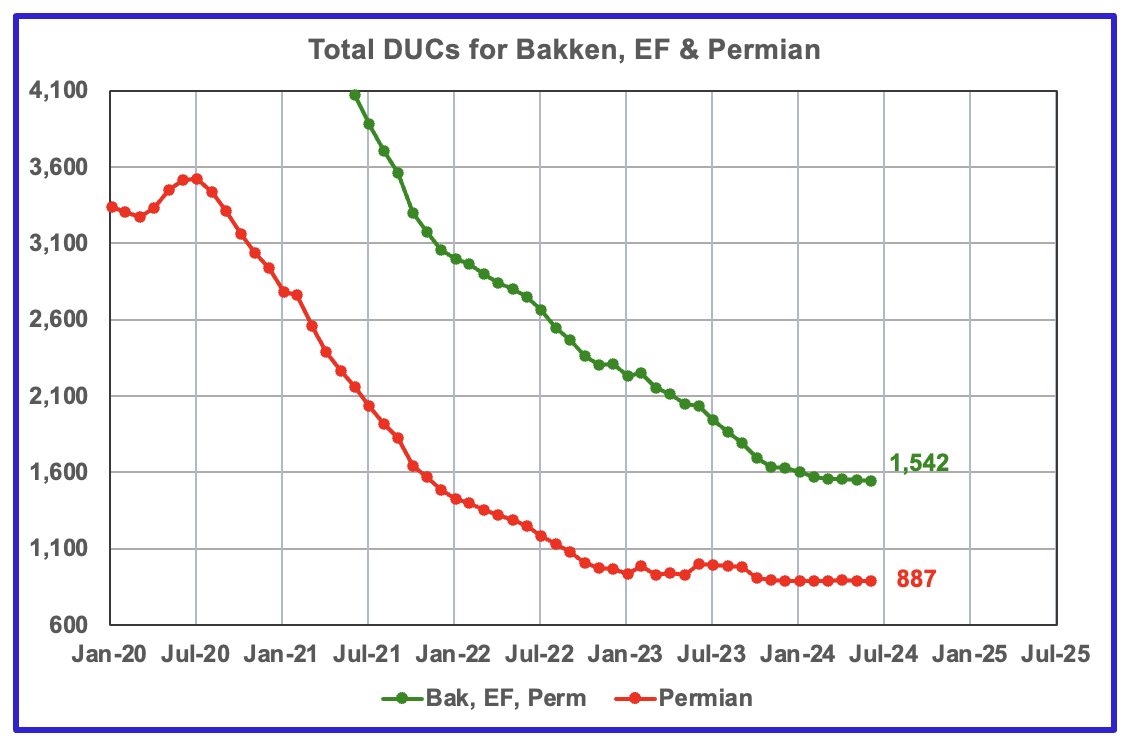
The number of DUCs available for completion in the Permian and the three major DPR regions has fallen every month since July 2020. June DUCs decreased by 11 to 1,542. In the Permian, the DUC count decreased by 5 to 887, a rare event.
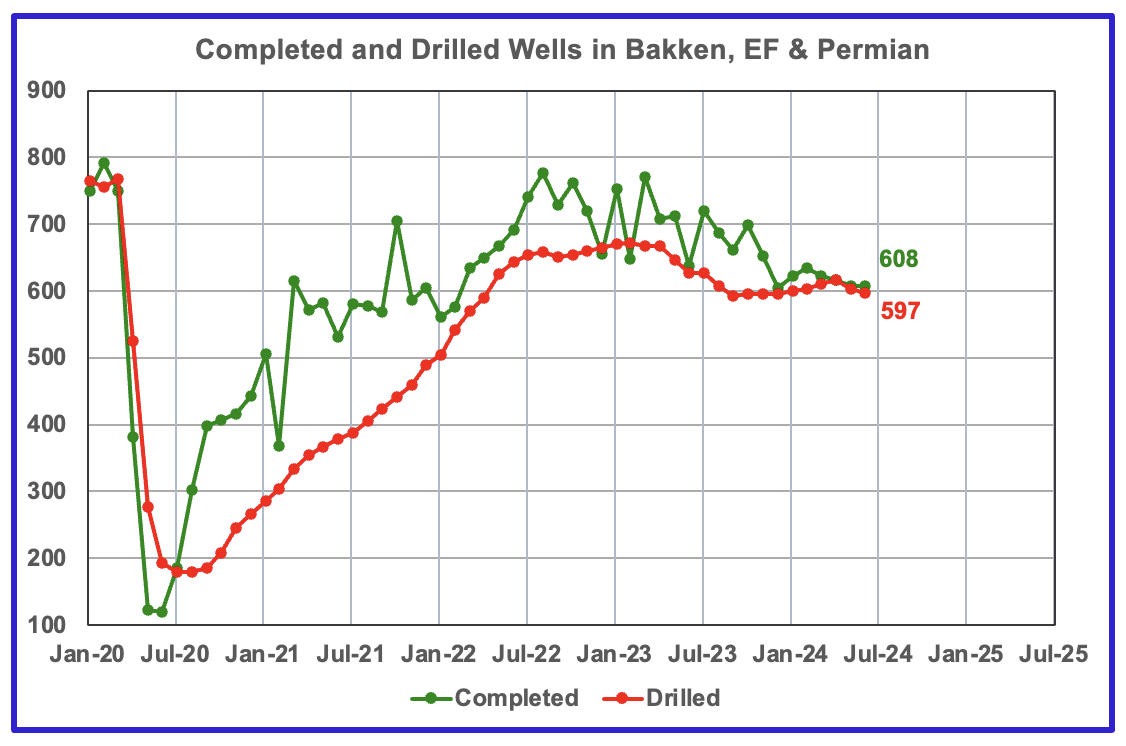
In the three primary LTO regions, 608 wells were completed and 597 were drilled. This indicates that there are still some profitable DUCs available.
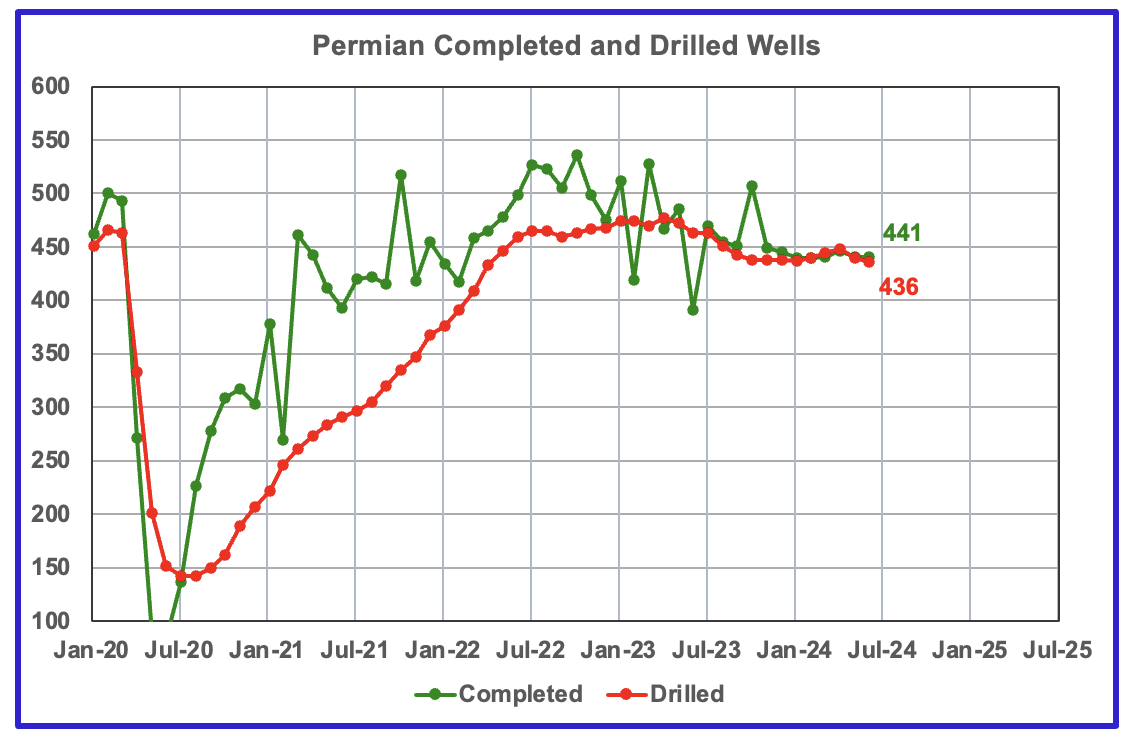
In the Permian, the monthly completion and drilling rates have been both stabilizing in the 430 to 450 range over the last eight months.
In June 2024, 441 wells were completed while 436 new wells were drilled. This is the second month in which the number of wells completed exceeded the drilled wells.
83 responses to “US May Oil Production Lower Than September”
It would be useful to see the STEO historical prediction also compared with the actual production.
I don’t understand how STEO goes up when all the fundematals of the fracking decline rates say US production is headed for a cliff, we shall wait and see.
But I was in the band that said the growth will slow down and it did, now that the red queen cannot keep up, it will stumble eventually
Svaya
Attached is the first chart in the post with an additional January 2023 STEO prediction for 2024.
As you can see the STEO has been too conservative. Compare the two December 2024 production figures.
I am also having difficulty rationalizing the latest STEO prediction while comparing it to the Lea Eddy Martin Midland production chart in the post.
Interesting, thanks for the work to graph it out,
I wonder how a Jan 2019 STEO would graph out on it.
Makes me also think how STEO is even calculated. The problem I have with STEO is that it cannot account for Black or Gray Swans like the 2020 Covid Pandemic. And now we are in an environment that anytime can turn everything into a 2020 like event.
IMHO we are in for some rocky terrain this fall, I mean the season
Svaya
I am also very curious to see what happens over the next 6 months. Too many inconsistencies. We need a Novi update to get a handle on what is happening in the Permian.
It would help in checking my latest county charts.
At this point I don’t trust Novi, not because of data, but because the thing I fear will happened cannot be immediately deduced from the data. Unfortunately is the nature of the predicament. When you have decline rates so big you still can see the begining of the cliff only in the rearview mirror. I mean most of us will see the cliff before but will be impossible to argue with the decision makers and their technical advisers!
If the US Economy is headed into recession, look for WTI to drop below $70, maybe below $60.
Given the current focus of returning income to shareholders, I assume prices below $70 WTI will drop rig counts and frac spread counts further.
and at what point this becomes a self-reinforcing cycle like it happened during the COVID lockdown, we all have seen what a big dent did that did to oil production, only after 3 years it recovered that levels in US and worlwide the peak is pre-COVID
SS
Don’t low oil prices also mean that rig renters and frackers will also lower their prices?
We have a very strange situation happening Toronto that has gone from a very hot real estate market to almost cold to frozen. In the 1980s when house prices were in the $100k price range, the typical real estate listing fee was 5%. As prices increased, the 5% didn’t change and two years ago when the average home price was closer to $1M, the fee was still 5%. The agents now drove around in high end Porsche’s and Mecedes and people were flocking to real estate courses. So for the same work that was done in the 80s and 2023, the listing charge went from 5k to 50k.
Currently, while home sales are in the cold and frozen state, we are getting mailers from real estate agents for listing rates of 0.5% and 1%. Back into the $5k to $10k charge for $1M home. We have a friend who is trying to sell a $3M home. It is not moving and I don’t know what the listing rate is but will ask at some point.
Not oil related but may have some similarities if WTI gets too low.
With XOM and CVX being big players, they may cut back to control prices. However this time they may not exchange emails to avoid being investigated like Pioneer,
Well done Ovi, thank you for sharing your analysis.
There is one thing you may want to consider in estimating whether some counties have peaked. The extremely low natural gas prices for much of 2024 has resulted in a lot of gassy oil wells being curtailed in some way. This is especially bad in the Delaware Basin. I think it will be hard to know how much is curtailed until the gas prices recover some.
DC. How bad are the current gas prices in the various shale basins at the well head?
Waha hub prices have been negative 1 to 2 dollars quite a bit. I believe the Delaware mixed stream wells are affected the most.
Rates may fall, but keep in mind that oil services firms have not been a good investment since 2014. The exception would be if one had the nerve to buy them in 2020.
WTI is $71 this morning. My gut tells me it’s going to drop fast from here. Maybe even sub $60.
I don’t see companies drilling more sub $60. The exception would be if Trump wins and the Republicans control Congress. I could see some huge environmental roll backs that would mandate more drilling to be realized. In other words, you don’t get the environmental roll back for your company if you don’t drill. Which would hurt little guys like us. The problem is, the states handle most environmental stuff, so it would depend ultimately on which states you operate in.
Trump has been quoted that $40 is a fair price for oil. Not sure he can get it that low, but prices were low 2016-2020. We had some of our worst years financially with our oil companies while was Trump was President. Although stripper operators typically are among the most conservative people politically, we did discuss in the wake of 2020’s collapse that Biden would be better for oil companies. And he was.
Much better financially under Biden. Granted some of that was due to the Russian invasion of Ukraine. 2022 was our best year since 2013.
Actually, there has been some deflation in the oil patch already. There could be some more, but I just don’t see the majors and large independents wanting to grow US production aggressively into an oil price collapse.
Last point, I see natural gas is under $2 for Henry Hub. So in the shale fields this probably means practically worthless. That does really hurt the bottom line as these basins become more gassy.
Shallow sand,
What leads you to believe the price will drop? With the turmoil in the Middle East, I would expect the opposite. Note that US commercial crude stocks were about 7 million barrels below the level a year earlier on July 26, 2024. Total commercial stocks (crude plus products) are up from a year ago, but the level a year ago was near the low end of the 5 year average.
Perhaps you expect a recession and a lack of demand for oil.
I agree not many new wells will be drilled and completed at and oil price of $60/bo or less and natural gas prices at near $2/MCF at Henry Hub.
I think people may be overreacting to one employment reading, there was a time when 5% unemployment eas considered full employment, at the end of July the rate was 4.3%. Essentially this is what the Fed has been hoping to achieve, now they will gradually reduce interest rates in hopes of not seeing inflation spike. If one ignores shelter costs (which are poorly estimated in the government data as there is a huge lag in shelter cost survey compared current rental costs for housing) inflation has already been reduced to the Fed target, eventually the Fed may realize this or may become worried about causing a recession so interest rates will ease.
Lower rates will move houses off the market as mortgage rates fall, it may increase constriction of new homes and offices and it will increase auto sales. All of these will tend to stimulate the economy as it increases employment and spending.
I expect a recession unless interest rates are cut quite a bit shortly.
Shallow sand,
Got it thanks. I was not focused on economic news for the past few days, things do look bad currently looking at international stock markets, particularly Japan, this could bleed into the real economy. Stock markets can reverse direction quickly so I think it is too early to make a judgement.
Concerning turmoil in the ME, markets won’t take that seriously unless there is an actual physical shock (for example, if Israel militarily prohibits Iran from exporting oil.)
Israel should probably do that quickly, assuming the Israeli government wants a Trump win.
I don’t think Israel will take out Kharg island export terminal unless Iran (Hezbollah) steps over a big line. Iran probably has a strong sense of what that line is.
Shallow sand,
I agree the market looks at future risks, to me the risk of a severe recession is similar to the risk of a more intense war in the Middle East (a major attack by Iran on Israel for example in response to an assasination on Iranian soil). So oil prices would decrease in one case and increase in the other, to me it is a coin flip as to which occurs.
The USA Navy shot down 99% of the missiles/drones shot at Israel from Iran’s last strike.
I don’t think Iran was giving its best shot and even communicated to the USA Navy about the attack.
I think people greatly underestimate the power of a USA Carrier fleet.
There are ~11 of them and what’s under water could end your nations existence.
I agree. 2022 completely changed the way geopolitical risk is viewed. You had the #3 oil producer in the world engaging in the hottest war since WWII and the oil flows barely budged. War or no war, exporting nations find a way to keep the flows flowing and getting that hard currency that is twice more valuable during wars….
Kdimitrov,
Nobody is making any serious attacks on Russian oil fields (though Ukraine has tried to hit some refineries with drones). If Israel went after Iran’s oil fields they could probably reduce Iran’s output significantly. The war between Iran and Iraq in 1980-1985 reduced World crude oil output significantly (roughly 9.5% lower in 1985 than in 1980 for World annual C plus C output). My guess is that oil prices would be higher if World output falls by 2% in a year’s time due to a conflict in the middle east.
Iran and Iraq’s combined output in 1979 was 6645 kb/d and by 1981 at the height of the war had fallen to 2380 kb/d. The ensuing price spike led to less oil being burned to produce electricity, and more efficient and smaller light duty vehicles and a drop in World demand for oil that did not return to the 1980 level until 1993.
Shallow Sand. I greatly appreciate your on the ground and honest commentary. Thank you.
Can you share what those environmental rollbacks would look like? More flaring of methane into the atmosphere? No responsibility and ability to just walk away from unprofitable wells, leaving the public to assume those costs (as discussed below, would anyone take the bet that the USA has more abandoned wells than the rest of the world has wells altogether??)? Just dumping polluted waste water, or re-injecting it, wherever?
There is a lot of glossing over on here about the real effects of production, it’s very clinical and impersonal when folks discuss these things.
Where exactly is the muchly increased pollution going to go??
Israel is the biggest albatross around the neck of America since The Ancient Mariner.
Does anyone think that oil companies won’t step up to produce the gas and oil in the Mediterranean for whoever’s god declares them the chosen few??
Watch and see how quickly Israel appropriates every BTU they can steal.
DC
Thanks. Much appreciated.
Good point regarding the price of natural gas.
For Midland and Martin, most of the gas is dissolved so NG price would have little impact. From the Lea and Eddy county data I cannot tell whether the gas is from a gas well or dissolved gas in the oil.
Ovi.
You might be able to get some idea from rig counts for horizontal oil rigs vs horizontal gas rigs in Lea and Eddy counties. If there are no or very few horizontal natural gas rigs operating in those counties, then it may be safe to assume that most of the natural gas produced is associated gas. My guess is that most of the natural gas produced in these counties is from “oil” wells and the low natural gas prices probably hurt the profitability for LTO producers in these counties.
From the Aug 1 EIA Natural Gas Weekly update they had this on Texas natural gas prices:
Price changes in Texas were mixed this report week. The price at the Waha Hub in West Texas, which is located near Permian Basin production activities, decreased 65 cents from $0.43/MMBtu to -$0.22/MMBtu yesterday. The Waha Hub traded $2.15 below the Henry Hub price yesterday, compared with last Wednesday when it traded $1.60 below the Henry Hub price. At the Houston Ship Channel, the price rose 10 cents from $1.63/MMBtu last Wednesday to $1.73/MMBtu yesterday.
Report at link below
https://www.eia.gov/naturalgas/weekly/#tabs-prices-2
For Eddy County in September and October 2023 (would by April and May 2024 with 7 month lag) horizontal gas rigs were 3 and 6 respectively and horizontal oil rigs were 37 and 36 respectively. For Lea County there were no horizontal natural gas rigs after June 2023 and horizontal oil rigs were 59 and 56 in September and October 2023. There were more natural gas rigs operating than I suspected, it is difficult to sort out the county data gas vs oil production and what comes from gas wells vs oil wells in New Mexico.
Dennis
Thanks. Great idea to check out NG rigs in the counties.
Attached is a chart that shows rigs in Eddy county. Eddy is the only county of the four being tracked that is drilling for gas. Currently there are 2 gas rigs operating, down from 6 in February and March.
This table shows operating NG rigs in the last three months of 2023. No NG rigs in Lea, Loving, Martin and Midland. Drilling in Reeves stopped in November.
Goehring & Rozencwajg
The Permian Basin Is Depleting Faster Than We Thought
06/30/2023
The most crucial development in global oil markets is depletion in the Permian basin. We first warned about this in 2018, predicting the Permian would peak in 2025. In retrospect, our analysis was too conservative. We now believe the basin could peak within the next twelve months. The implications will be as profound as when United States oil production peaked in 1970, starting a chain of events ultimately sending prices up five-fold over ten years. If we are correct, this could not come at a worse time for oil markets: inventories are tight, production in the rest of the world is declining, and investors are incredibly complacent.
The shale revolution changed everything. By 2014, non-OPEC production growth reached 2.2 mm b/d, the most robust growth since at least 1966 — driven entirely by the shales.
As the shales ramped up between 2010 and 2018, they seemed limitless. However, even in the early stages of field development, there were warning signs that shale basins adhered to the same depletion principles as conventional fields. Enormous is not the same as infinite, we argued and warned that depletion would eventually take hold.
The shales seemed to defy the laws of physics: they could grow materially despite much lower drilling activity. The industry appeared to have entered a world where it no longer needed increased drilling to boost production.
How was this possible? The answer was drilling productivity. Between 2013 and 2017, the average shale well went from averaging 70,000 barrels of oil over the first twelve months to 140,000. On the Midland side of the Permian basin, the primary source of supply growth, twelve-month productivity nearly tripled from 50,000 to 140,000 barrels.
Modeling well performance is hugely complex. Shale basins are highly nonlinear with high degrees of variable inter-dependence. As a result, traditional statistical techniques, such as the linear regressions used by most analysts, fall short. We turned to advanced methods, including machine learning and neural networks, and achieved surprising results. Instead of improved drilling techniques, we concluded that two-thirds of the improved productivity between 2013-2018 came from favoring the best drilling locations. In 2013, 22% of Midland wells were Tier 1. By 2018, Tier 1 represented 50% of all wells. Since a Tier 1 well is nearly twice as productive as a Tier 2 well, the migration from lower to higher quality areas drove a massive amount of the improved well productivity.
The industry was not turning Tier 2 into Tier 1 but, instead, was aggressively depleting its inventory of top-quality wells.
Between 2013 and 2018, Permian productivity increased by 153%, with three-quarters of the increase explained by improved geology—moving the drilling rig from a tier 2 to a tier 1 location–and increased lateral lengths. When we wrote in 2019, we predicted that Permian per-well productivity was likely nearing its maximum, and, in retrospect, that was correct. Between 2018 and 2021, per-well productivity growth slowed dramatically, advancing by only 20%, all of which was due to longer lateral lengths. On a per-lateral foot basis, there was no growth at all.
King Hubbert hypothesized that a hydrocarbon basin would peak once half the recoverable reserves were produced. Even though his theories referred to conventional basins, we have long believed that shale basins should behave similarly. The difficult task is estimating the recoverable reserves from each basin. Luckily, our models can help here as well. We count 7 and 9 billion barrels of recoverable oil in the Eagle Ford and Bakken, respectively, of which 65% and 55% have been produced. Consistent with Hubbert’s theories, both basins have been unable to grow after crossing the 50% mark. The Eagle Ford produced half its recoverable reserves in August 2019; production has fallen 18% since. The Bakken produced half of its reserves in 2022, and production has since been flat. Our models tell us the Permian will ultimately recover 34 bn barrels of oil, of which 14 bn or 41% have already been produced. At current production levels, the Permian will have produced half its recoverable reserves sometime in late 2024; at this point, it will most likely stop growing, just like the other two basins.
https://blog.gorozen.com/blog/the-permian-basin
Huntingtonbeach
Maybe this article confirms that the L + E + M + M production chart in the post is reasonably accurate and that the Permian may be past peak production.
As noted in the chart’s comments “A few more months of data is required to confirm that the Permian has also peaked.”
Ovi,
Much depends on the price of oil, natural gas, and NGL. If prices remain where they are now or they fall to lower levels, the Permian could be near a peak. Higher prices could lead to increased rig counts, completions and higher output. We don’t know what future prices will be.
A scenario with higher future prices (maybe rising to $100/bo in 2023$ and $4/MCF for natural gas) presented below.
Dennis
I was just pleased to know that the chart that was posted was consistent with what Goehring & Rozencwajg published. Totally surprised that no one commented on that chart.
Agreed that price could change things but Goehring & Rozencwajg’s main point is that the Permian is running out of good drilling locations.
Ovi,
It is not clear to me that the G & R analysis is accurate. Their 34 Gb estimate seems quite low as the TRR of the most productive areas of the Permian has a mean estimate of about 50 Gb and the F95 TRR estimate is about 45 Gb for the Permian basin. Unless oil and natural gas prices are very low in the future, it seems likely that the URR will be at least 40 Gb and more likely about 45 Gb for the Permian basin. The mean TRR for the Permian as estimated by the USGS is 75 Gb so even a 60 Gb URR is not out of the question for the Permian Basin with high prices. It seems early to be calling a Permian peak to me except under the assumption of very low oil and natural gas prices due to a lack of demand, a severe recession or transition to electric transport might cause such a scenario, but I don’t think we get there until 2035 or later. As always, I am likely (perhaps certain) to be incorrect.
The peak is determined more by the completion rate than by when 50% of URR is reached (this explains the early peak in the Bakken). An analysis in Dec 2021 by Saputra (a student of Patzek) has Permian URR at about 54 to 62 Gb for core areas only the URR is 32 Gb, similar to G&R’s estimate, see
https://www.mdpi.com/1996-1073/15/1/43
Dennis
Difficult to know what the roll of management decisions is in the current environment of WTI in the low $70/b range. Maybe XOM and CVX want to husband their assets. Different thinking between the big corporations and the little guys.
I guess we will have to see what happens over the next 6 months. In about 30 days another data point will be added to the 4 county production chart and we can discuss it again. It is painful to watch grass grow.
Ovi,
Agreed, difficult to predict the decisions that will be made. My guess is that they will take advantage of high oil and natural gas prices if and when they occur, the future may be one with low oil prices where fewer new wells are completed. We won’t know until we get there, in the mean time I expect that the Permian has reached a temporary peak, my model has it in May 2024, but the data suggests December 2023 was the monthly peak (though the data may be revised in the future). If the completions follow the wells drilled (no change in DUC count) and the drilling rate remains 1.4 wells per rig per month, my model suggests a slow rise to a new peak in March 2025 assuming an 8 month gap between start of drilling and first production flow. I assume new well EUR starts to decrease in Jan 2025 for my scenario (at a 1.75% annual rate of decrease). The assumptions will certainly not be correct.
Ovi,
Exxon said last week that they were planning to grow liquids production from the Permian by 200 kbpd per year, for the next 3-4 years.
Liquids includes NGL, however.
Kdimitrov,
Exxon’s Permian footprint is mostly in the Midland basin where the output has lower GOR than the Delaware basin so NGL output wont be a high proportion of liquids output, probably on the order of 9% of total liquids, so of the 200 kb/d of liquids increase about 90% (180 kb/d) would likely be C plus C output. For my scenario presented above the increase in 2025 is only about 1% which reflects the falling rig count in 2023 and 2024.
XOM had output of 875 kb/d in Nov 2023 according to Novolabs (this includes Pioneer and XOM output), so 180 kb/d per year is a pretty large increase (about 20% in 2024), if it is realized.
Note that the rig counts don’t reflect such a large increase for the Permian Basin as a whole. Output looks like it will be up by about 300 kb/d in 2024 vs 2023(annual averages), an increase of about 5% for the Permian Basin as a whole.
Dennis,
Not sure if NGL is only 10%, but in any case the target does look quite aggressive. We will have to see if they can deliver. As I have been saying, the Permian growth going forward hinges on a single company. Everyone else is either at maintenance or at decline.
Dennis,
My mistake. The 200K growth number per yr till 2027 is BOE, not liquids. That includes 30% gas.
Also, 2024 is a transition year for Exxon. In the first 4 months the increase was only up to 75 kboe/d, so I think they start counting the 200 kboe/d growth from 2025 on…
Kdimitrov,
Ok so let’s say 60% is C plus C (30% natural gas and 10% NGL), that makes it about 120 kb/d per year out of 875 kb/d of tight oil output in Nov 2023 (Novilabs estimate) which is 13.7% annually. Perhaps only XOM has any growth, I think there will be others such as the three companies in the chart below (also see https://public.tableau.com/shared/PMJGYX7JH?:toolbar=n&:display_count=n&:origin=viz_share_link&:embed=y ) .
Diamondback, Endeavor, and Occidental as a group increased output in the Permian by about 105 kb/d from November 2022 to November 2023, an increase of about 12%. Perhaps they will decide to slow things down beyond 2024. I expect output in the Permian will not grow by much in 2024, even my high completion model (with higher completion rates starting in 2025) only has about 60 kb/d of growth from 2024 to 2025 (roughly 1%).
Took a quick look at top 20 Permian producers in the Permian basin using Novilabs data published in April 2024. The top 20 produced about 80% of all Permian output, also from November 2021 to November 2023 the top 20 producers increased output by 24.6%, while the remaining producers (not part of top 20 group) increased output by about 4.3%.
This suggests most of the increase in Permian output is coming from the large oil companies with the percentage increase in 2022 and 2023 roughly 6 times greater for the large (top 20) operators (25% vs 4%).
An alternative scenario with new wells ramped up to 500 new wells per month from March 2025 to December 2027 (increase in wells completed by 3 each month, similar to the rate of increase in 2022 (39 well annual rate of increase in 2022). Again assumptions about the future are certain to be incorrect.
The annual rate of increasein Permian LTO output in 2026 and 2027 for this scenario is about 3.5%.
Checked in on recent comments at OilyStuffBlog and the mood is quite pessimistic.
A revised Permian scenario based on that pessimism (which seems well grounded to me). This assumes completion rate reflects the rig rates through Aug 9, 2024 for Permian and that the rigs continue to decline at the rate of the past 12 months which leads to about one less completion per month, also new well EUR is assumed to decline starting in Jan 2025 at about 1.6% per year.
This scenario is likely not pessimistic enough for those at Oilystuff.
Pessimistic because of lack of escalating prices/lack of demand growth for oil,
or lack of production potential even at higher prices?
Lack of future vision outside technology of the past. They think they can “Make America Great Again” by going back in history. “Drill Baby Drill” is just “Hell Baby Hell” for everyone.
“We aren’t going back”
Hickory,
Many factors, depletion, high GOR, lack of profits at current prices, water disposal costs, just to name a few. Mr Shellman implies there may be 2 to 3 years left at current completion rates then I think he expects a more rapid decrease in rig counts than in the scenario I have presented.
So I am nearly certain he would consider this “pessimistic” scenario to be too optimistic.
He has forgotten more than I could ever hope to know about the oil industry, I expect he will be proven correct.
Well (no pun intended), it sure looks like a setup for higher prices.
And also I believe we are in for a setup for long term higher prices for most important things. Limitations to growth in a finite world get expressed via higher prices. I think we are in the pregame phase of that global trend.
Goering analysis is totally at odds with IEA 2024 medium term outlook.
https://iea.blob.core.windows.net/assets/493a4f1b-c0a8-4bfc-be7b-b9c0761a3e5e/Oil2024.pdf
OPEC+ has over 4 million barrels per day of spare capacity and new production is coming online from several countries. At the moment even with the OPEC cuts oil prices have fallen and are now lower than 10 years ago. The scale of electric vehicle sales is making peak oil irrelevant.
Interesting article about the difference between May 24 weekly and monthly gasoline consumption statistics released by EIA.
https://boereport.com/2024/08/05/large-revisions-to-us-energy-data-leave-traders-and-analysts-befuddled/
DCLonghorn,
The EIA Weekly output estimates have never been very good, this is nothing new. Also what I find for last 4 weeks of may is 9071 kb/d of gasoline supplied for weekly data vs 9396 kb/d for the May output reported for PSM, a difference of 220 kb/d. The author of the report must be looking at net refiner and blender output which includes 700 kb/d of exports. Often it is the journalists who are befuddled.
The data is not perfect, especially the weekly data, but it gets it roughly right.
Re. Alaska, ~10 years ago or so there was talk of a MOL at 500k BOPD in winter to prevent freezing in the TAPS, but apparently there´s been heating stations added. So a thought that came up in my head, I guess there might be some EROEI/EROMI/MRMI limit there somewhere?
But even at 3-400 BOPD I guess you can still burn quite a bit along the way…
DC
I think the problem on this data, was that the weekly data released in May seemed to indicate a slowing demand for gasoline. A slowing demand for gas was taken to indicate strength in electric vs gas vehicle sales. The monthly data which just came in is enough of a difference to change some interpretation’s of the data.
If we were seeing a difference between monthly and weekly oil production of 200,000 to 300,000 bpd it would bother me more.
DCLonghorn,
The weekly data should never be taken to be correct in my opinion, sometimes it is accurate and sometimes it is not, in my view it is best ignored or taken with a pound of salt. It is often wrong by 200 to 300 kb/d and we only know this two months down the road. This has been true since 1991.
Yes, also worth noting that weekly “product supplied” numbers are only implied and not directly measured/surveyed.
The EIA collects data on refinery/blender output, stock levels, imports and also uses export data from U.S. Customs. When they add these together, the resulting number is “product supplied”.
OK oil companies aren’t particular generous when it comes to cleaning up messes:
https://www.propublica.org/article/oklahoma-energy-resources-board-refunds
What a surprise!
rgds
Vince
I don’t understand why they ask for a refund. It’s not much money. We have the same thing in our state, and it has restored a lot of abandoned tank battery sites over the years, as well as providing educational programs regarding the oil & gas industry.
I’m surprised Hamm would do this. Is there more to the story?
I don’t normally write here any more, but the piece on Oklahoma caught my attention, and stirred my ire. The entire Tulsa area was pockmarked by shallow wells after Glenn Pool was discovered (oil had seeped onto a limestone picnic site near where the Trail of Tears had emptied out). There was one hell of an oil boom. Nobody monitored it. It attracted lots of people from all over. George Getty drilled wells all over Osage county, back in 1903 before Oklahoma became a state. As a native Oklahoman, I would imagine that there are many more orphan wells than counted, probably tens of thousands in oil-rich Osage county alone.
Most of them were drilled in a frenzy, well before Harold Hamm (Continental) and Tom Ward (Mach) were born. In fact, both of these gentlemen are philanthropists to the state of Oklahoma. My friend, the dean of the medical school, nervously approached Mr. Hamm at a black tie gala. There was a deep hole with several cranes surrounding it, near the veranda where they were drinking their scotch. Mr. Hamm asked what was going in that hole. My friend commented that the new diabetes research center would go in, if they could find the extra funds. Mr. Hamm asked how much that might be and my friend cleared his throat and mentioned a very large sum, whereupon Mr. Hamm wrote out a check for that sum. Tom Ward has been equally philanthropical. The late Aubrey McClendon (Chesapeake) did more for the state of Oklahoma than any other person.
I don’t think any of these men felt that they should plug the holes dug by George Getty, when grandson Gordon, a San Francisco socialite and maybe the most liberal person in America, doesn’t seem too interested in doing his part. There’s always more to a story like this.
Thanks for this!
Thanks Gerry, nice recap of oil wealth generosity. Same thing in my neighborhood… the Southwest Research Institute and Texas Biomed Research Institute would never have been created without Tom Slick. Turned Oklahoma oil discoveries from his father into scientific nirvana. Still punching out amazing work, decades after Mr. Slick’s death.
It is interesting how some children/grandchildren of highly successful oil producers wind up ultra-liberal politically.
Since we are discussing Oklahoma, I suggest readers here might find interesting T.N. Barnsdall and his daughter Aline.
Barnsdall’s father drilled the second commercial oil well at Titusville. T.N. was a very successful wildcatter, who also hit it big in the shallow fields in OK in the early twentieth century. There is a town in NE OK named after him.
From what I’ve recently read, Barnsdall’s daughter inherited around $15 million in assets. She was a big theatre person, lived in Los Angeles, and commissioned Frank Lloyd Wright to build a huge home there. She also notoriously had a daughter while not being married, intentionally, which was a huge scandal over 100 years ago.
Very interesting is the history of oil production and the people involved in the USA.
Lots of very wealthy people have been philanthropists after becoming very wealthy, Carnegie (Steel) and Rockefeller (Standard Oil) come to mind as obvious examples, but there are many others. Some of the wealthy are conservative and some are liberal. And there heirs won’t necessarily share the same ideology.
Henry Ford would be appalled at how his foundation is spending his money. Try as you might, it’s hard to control the future from your grave.
His descendants are OK with it.
Ervin,
People sometimes change their views over time, difficult to know how Henry Ford’s philosophy might have changed over time if he were still alive. A man of science might change his view in the face of overwhelming empirical evidence suggesting his view was incorrect.
Edsel designed a fairly modern car for its day, being a guy that might change took a sledge hammer to the car like any considerate father willing to change would do. The point. Some people are incapable of change.
It is interesting how some children/grandchildren of highly successful oil producers wind up ultra-liberal politically.
And some don’t. The Koch family has done enormous harm with their radical “conservative”, long term project. The father founded the John Birch society ( which specialized in weird conspiracy theories), and the brothers have continued their father’s pursuit of autocracy.
Wealth tends to isolate people, surrounded by sycophants who can’t tell truth to power. It takes strong character to keep one’s balance, and to resist believing that one is a genius in all things. If you became wealthy because of a money obsession and sociopathic methods, you won’t get much help resisting the dark side.
I suspect Elon Musk is a victim of this isolation, and a conservative echo chamber. He started out doing great good, and it appears he is becoming unhinged.
I have seen that close up and personal. The degree of sucking up to people that you think may be helpful can be mindboggling both in their persistence and extent. And I agree – it takes wealthy / powerful people a consistent effort to relate to people who are not in the inner circle to keep a semblance of perspective.
And it certainly looks like Elon has created a pretty tight echo chamber around him. Shame, really.
Gerry
We miss you.
https://www.youtube.com/watch?v=4BsB8breRdg
5 minutes
Why does Russia have oil supply problems?
Why can’t Ukraine take Russian oil refineries offline?
This is really good (note 1 year old)!!!
https://mishtalk.com/economics/california-files-a-lawsuit-against-big-oil-whats-the-logical-response/
California launches lawsuit on Big Oil
Mish seems to be an aggressive minion of the .1%.
CA wants oil companies to be transparent and honest about oil pollution. Just as FDA requires drug companies to disclose side effects. Mish proposes oil companies boycott CA for being so…uppity.
I’m not agreeing or disagreeing with Mish. It was just an OIL topic.
“Chevron CVX -0.57%decrease; red down pointing triangle is relocating to Texas, deserting California, its home state for more than 140 years, where the business climate has soured for oil companies.”
Sure. But, we have limited time, and a lot of information sources to choose from. It’s good to know one’s sources and choose carefully.
Diamondback discloses that it has shut in some of its gassy oil wells in second and third quarter because of low gas prices. Paywall, doesn’t appear to quantify how much oil it has held back.
https://www.hartenergy.com/exclusives/diamondback-curtails-permian-oil-output-amid-associated-gas-glut-210064?utm_source=daily-wrap&utm_medium=email&utm_content=read-more&mkt_tok=NDMzLU9ESy04ODkAAAGU0pG7p9lFkziJwoqiyFAbnIqEh43J_O-m2uvRfK6w5j9w7X_u-qM9H2sKVf45Pke3CiiiIQbQjR3b9RmvcHs5DDMm3y_xzKp3OBcw5fRzmZBWxw
A small update from Norway regarding exploration wells so far in 2024. Behind a paywall (https://www.tu.no/)
“19 exploration wells are drilled so far this year. Nine of them were successful. In addition there were some appraisal wells and one well for data gathering purposes. 7 wells were dry.”
All of the successful wells were small in the big picture (below 50 million barrels proven). Nevertheless the success rate is very high due to technology. I see that investments are tilted towards the old giant fields still, probably because new technology reveal ever more potential.
And so it goes. If it is like this in Norway, I can only imagine the potential in other regions due to new technology not having being utilised fully. It is a dangerous game overall – very longwinding and unfortunately not very sustainable in the end.
The Rig Report for the Week Ending August 9
– US Hz oil rigs rose by 2 to 434 and are down 25 rigs from April 19. This week is tied with January 2022 when the count was 434 and rising after the Xmas break.
– The Texas rig count was unchanged at 234 rigs and is down 92 from January 2023.
– Texas Permian was unchanged at 187 while the New Mexico Permian dropped 1 to 101.
– In New Mexico, Lea has held steady at 50 rigs for the last 9 weeks while Eddy dropped 1 to 50. Since March 29, the average number of rigs operating in the NM Permian has been 101, note 20 weeks. What is so different about the NM Permian that keeps the number of operating rigs at 101 for 20 weeks?
– In Texas, Midland was unchanged at 18 and Martin dropped 1 to 30.
– Eagle Ford was unchanged at 44.
– NG Hz rigs dropped 1 to 85. (Not shown).
Frac Spread Report for the Week Ending August 9
The frac spread count dropped by 3 to 240 and is down by 22 from one year ago. It is also down by 32 spreads since March 8.
Ovi
Drilling productivity seems to be a little bit of a wild card in the projected production. For example, Baytex has reported an 8% improvement in drilling efficiency over the last twelve months. Not clear if that includes squeezing drillers for lower rates.
Old Chemist
The EIA has lowered their projection to December 2025 in the August report across the board, basins and overall US. Maybe they are starting to see some slowing.
The Baytex efficiency is not showing up in the stock price.
“‘Drill, Baby Drill…’ Donald Trump On Oil Extraction In America at RNC 2024, | World News”
https://www.youtube.com/watch?v=Q6uV785X-pU
‘Drill, Baby, Drill’: Crowd Explodes Into Cheers As Trump Promises To End Biden’s ‘War’ On US Energy
https://www.youtube.com/watch?v=1u7bvl7AGC8
What a Trump presidency means for Big Oil and energy stocks
https://www.youtube.com/watch?v=p0jhzA6nrtY
There it is. Trumps economic plan is to flood the market with American oil until the price is $40 a barrel.
Wierd
Huntingtonbeach
Besides being weird he is not smart enough to realize he is crippling American drillers. That is how you make America great again by bankrupting the drillers.
The US is not capable of flooding the world market with oil. Trumpites do not realize that oil is a world market. What the whole world produces determines the price of oil. Of course, most Trumpites are stupid so what can you expect?
An update to Non-OPEC and World Oil Production has been posted.
https://peakoilbarrel.com/april-non-opec-and-world-oil-production-drops-2/
A new Open Thread Non-Petroleum has been posted
https://peakoilbarrel.com/open-thread-non-petroleum-august-11-2024/