A post by Ovi at peakoilbarrel.
All of the oil (C + C) production data for the US state charts comes from the EIAʼs Petroleum Supply monthly PSM. The charts below are updated to March 2021 for the 10 largest US oil producing states.
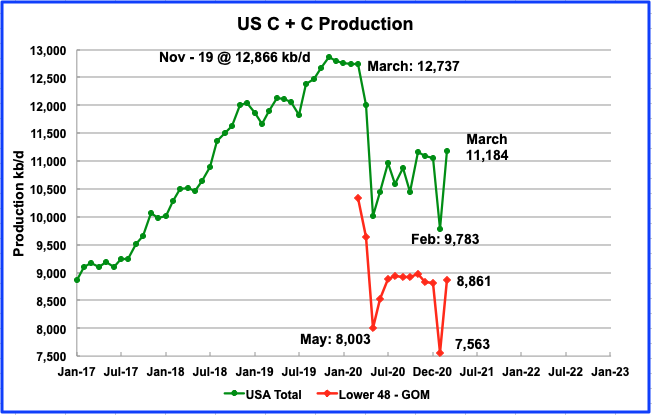
U.S. March production increased by 1,401 kb/d to 11,184 kb/d from Februaryʼs output of 9,783 kb/d and was also 128 kb/d higher than January’s. The increase was due to the rebound from the severe winter storm that hit the four US southern states, Texas, New Mexico, Louisiana and Oklahoma. Note that February’s output of 9,862 kb/d in the previous report was revised down by 79 kb/d to 9,783 kb/d in the current report.
The May STEO report forecasted US March output would be 10,939 kb/d vs the reported actual output for March of 11,184, an under estimate of 245 kb/d. Note that March output was 57 kb/d higher than January.
In the onshore lower 48, March production increased by 1,298 kb/d, red graph. The 103 kb/d difference between the two was largely due to the 107 kb/d increase from the GOM.
Ranking Production from US States
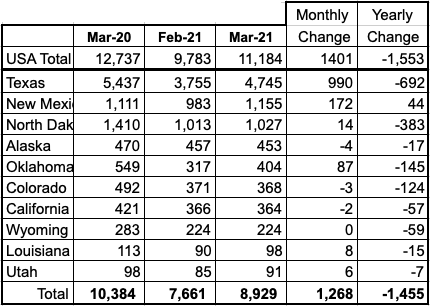
Listed above are the 10 states with the largest US production. These 10 accounted for (79.8%) of US production out of a total production of 11,184 kb/d in March 2021.
Of these 10 states, Texas, New Mexico and Oklahoma had the biggest percentage output increases relative to February. On a YoY basis, all states except New Mexico had a lower output than last year. Note also that New Mexico surpassed North Dakota in output and moved into second place.
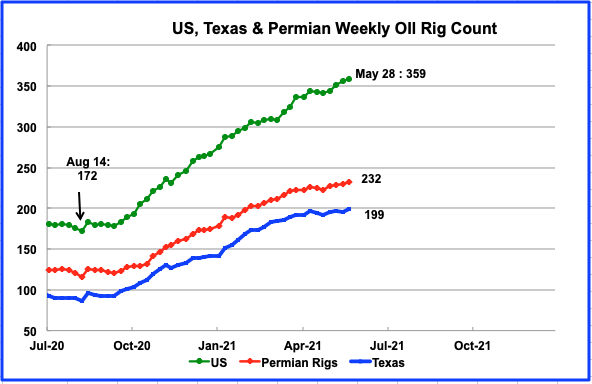
Rig additions continued in the US from the August low of 172 to 359 in the last week of May. Over the last month there is a hint of slowing in rig additions in Texas and the Permian.
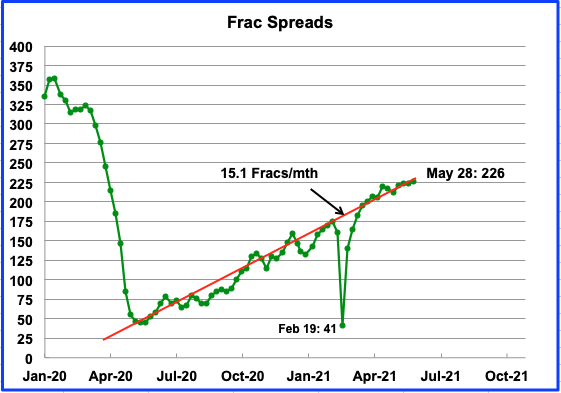
Frac spreads continue to increase at an average rate of close to 15.1/mth.
Production by State
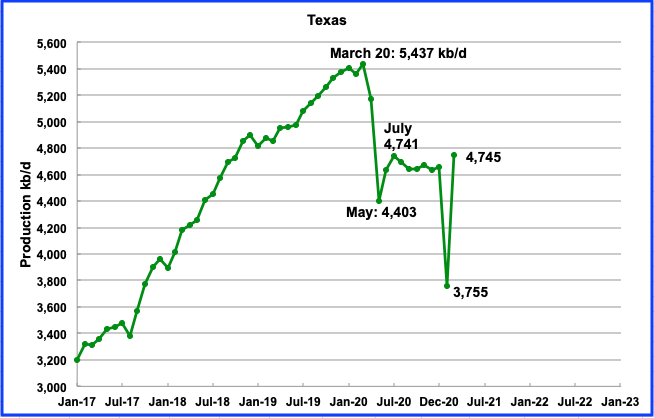
Texas production increased by 990 kb/d in March to 4,745 kb/d after rebounding from the February winter storm. March output was 84 kb/d higher than January.
From the end of March to the end of May Texas added 10 oil rigs.
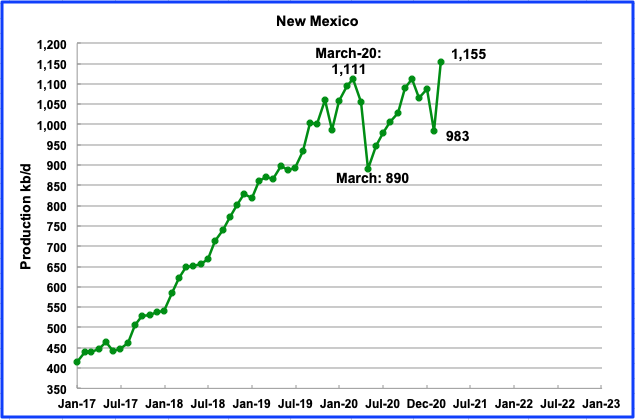
March’s New Mexico production increased by 172 kb/d to 1,155 kb/d after recovering from the February winter storm. March’s output is a new record. How will New Mexico’s tougher emissions rules on oil and gas wells, which calls for 98 percent natural gas capture, affect its output growth rate going forward?
New Mexico is home to the most prized portion of the Permian basin shale formation. From the end of March to the end of May, 14 oil rigs were added to the New Mexico portion of the Permian.
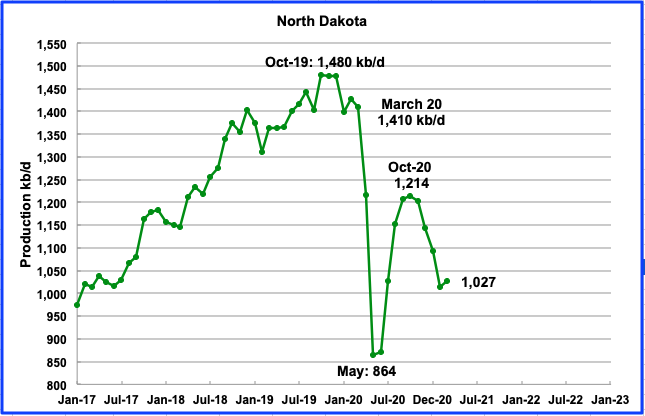
According to the EIA, March’s output was 1,027 kb/d day, an increase of 14 kb/d from February. During March, North Dakota had 13 rigs operating and by the second week of May had increased to 16.
The North Dakota Oil and Gas division reported that March’s output in the Bakken was 1,065 kb/d. It is surprising that the EIA reported total March output for North Dakota to be lower than the Bakken alone.
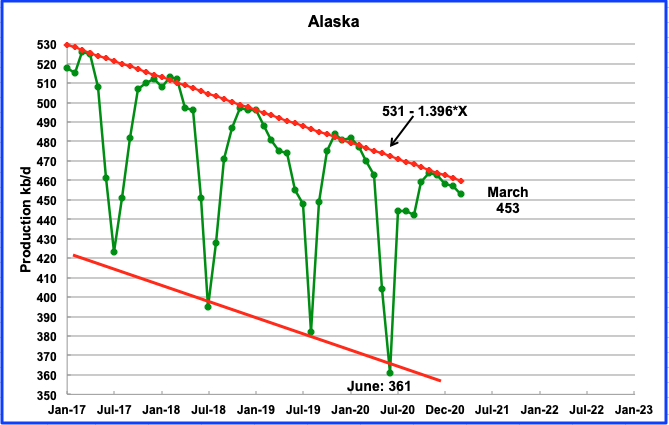
Alaskaʼs March output decreased by 4 kb/d to 453 kb/d. The EIA’s weekly production report shows that output in April was close to 450 kb/d, an indication of further declines. Drilling continues in Alaska to try to keep oil output close to 500 kb/d according to this source.
According to this source, U.S. President Joe Biden’s administration defended on Wednesday, May 26 a proposed ConocoPhillips (COP.N) oil development in Alaska, backing the drilling project which was approved under the administration of former President Donald Trump.
The Willow crude oil project holds 590 million barrels of recoverable oil and could produce up to 160,000 barrels per day as soon as 2024, according to ConocoPhillips’ previous estimates.
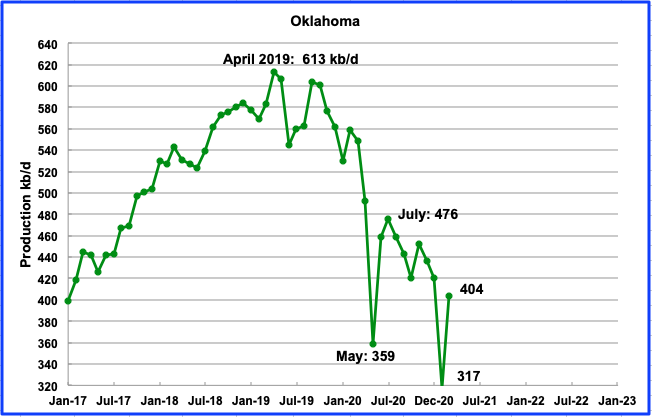
March’s Oklahoma output increased by 87 kb/d to 404 kb/d after recovering from the winter storm. During March 17 rigs were operating and by the end of May they had increased to 28.
For 2021, Oklahoma’s production is expected to drop by 25% according to this source. It is not clear why this will happen with increasing rigs.
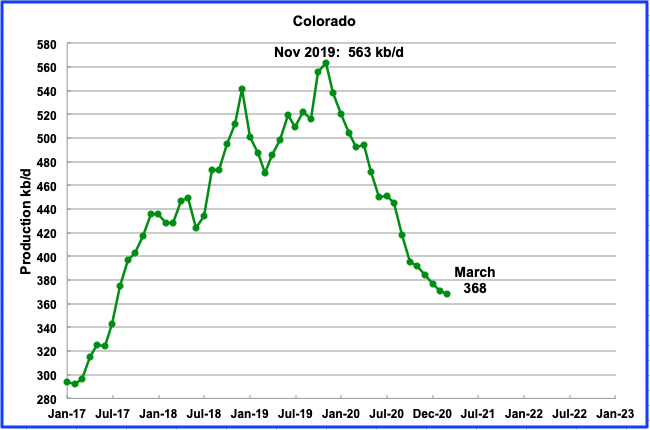
Coloradoʼs March output decreased by 3 kb/d to 368 kb/d. Colorado operated 7 rigs from mid-January to mid-March but increased them to 9 in May.
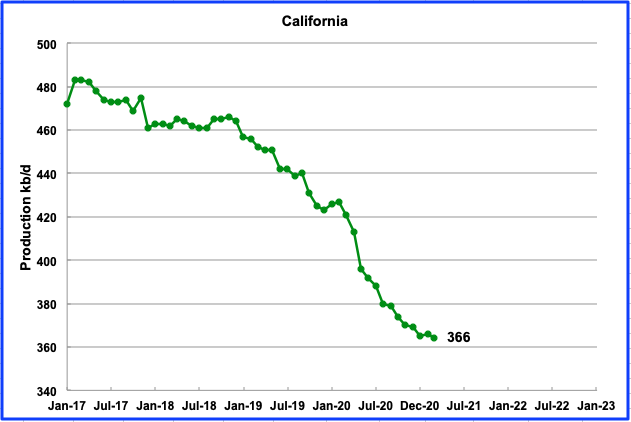
Californiaʼs slow output decline continued in March. Its production decreased by 2 kb/d to 366 kb/d.
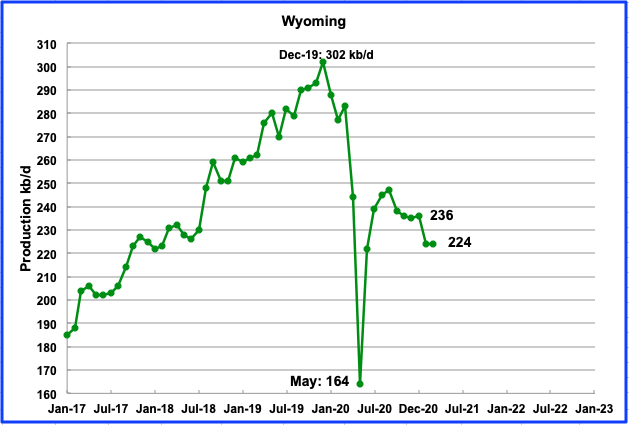
Wyomingʼs production in March was unchanged at 224 kb/d. Wyoming had 3 oil rigs operating in January and they were increased to 4 in February through to the end of March and then back down to three in April and May.
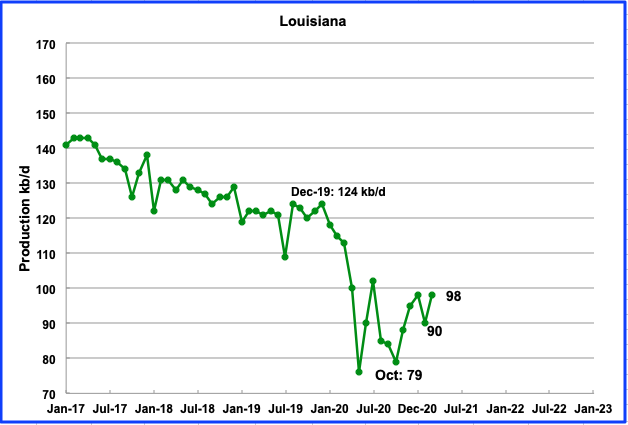
Louisianaʼs output increased by 8 kb/d in March to 98 kb/d and was the same as January’s
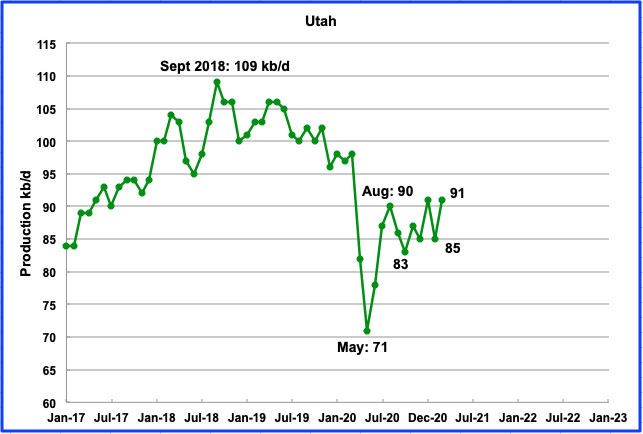
March’s production increased by 6 kb/d to 91 kb/d. Three oil rigs were operational from January to mid-March. However by the end of May, 9 were operational.
Utah joined 12 other states in a lawsuit against the federal government challenging the Jan. 27 executive order issued by President Joe Biden to ban any new oil and gas leasing on federal land and offshore waters.
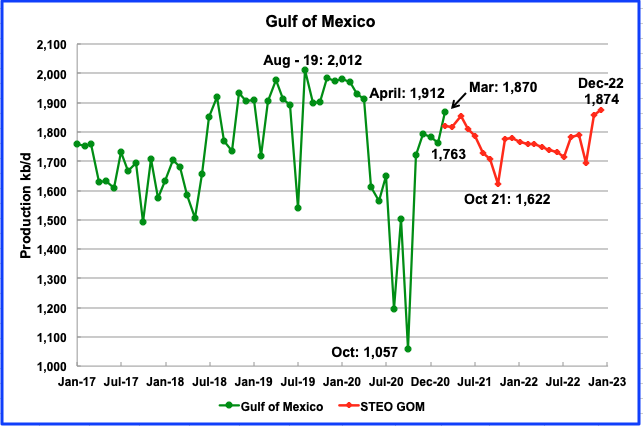
Production from the GOM increased in March to 1,870 kb/d, an increase of 107 kb/d from February. If the GOM were a state, its production would rank second behind Texas.
The May STEO projection for the GOM output has been added to this chart and projects output to be 1,874 kb/d in December 2022. This is an increase/revison of 59 kb/d over the previous April report.
Note that the STEO forecast an increase of 58 kb/d in the GOM output in March 2021 to 1,819 kb/d. However the reported actual increase was 107 kb/d. Is the March increase the result of one of four new projects that are expected to begin production in 2021?
Short Term Energy Outlook
The STEO provides projections for the next 13 – 24 months for US C + C and NGPLs production. The May 2021 report presents EIAʼs updated oil output and price projections to December 2022.
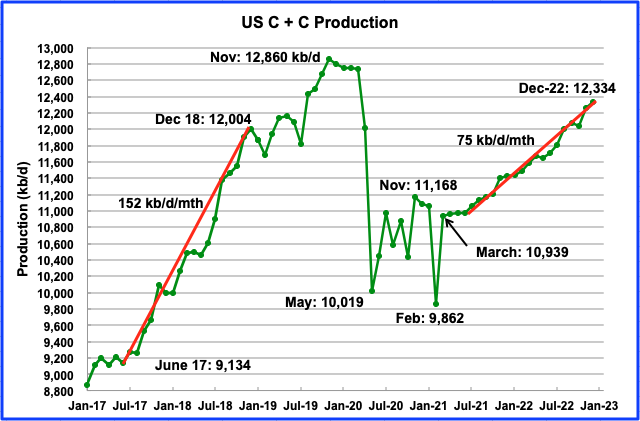
According to the May STEO, US output is projected to increase in March 2021 to 10,939 kb/d after recovering from the February low of 9,862 kb/d. The May STEO has also revised up the December 2022 estimate by 67 kb/d to 12,334 kb/d. Actual March output was 11,184 kb/d
US production will be essentially flat from March to June 2021. It is flat due to decreasing Alaska output offsetting increasing production in the L48. After June, output is forecast to increase at an average rate of 75 kb/d/mth.
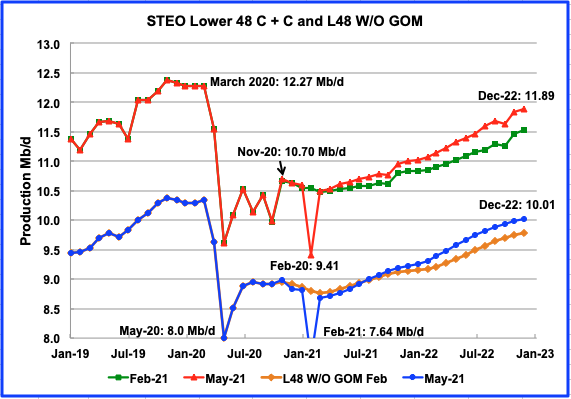
The May STEO output projection for the L48 states is essentially the same as the one provided in the April except for the revised big output drop in February. The December 2022 output forecast was unaltered at 11.89 Mb/d.
The EIA continues to project a significant increase in production in the L48 starting in March 2021. From March 2021 to December 2022, the US will add 1.4 Mb/d by going from a daily production rate of 10.49 Mb/d in June to 11.89 Mb/d in December 2022.
In the onshore L48, L48 W/O GOM, production starts to increase in March 2021 from 8.67 Mb/d to 10.01 Mb/d in December 2022, an increase of 1.34 Mb/d. The average monthly increase in production rate is 63.8 kb/d/mth.
The STEO forecast March output to be 8.670 Mb/d for the onshore L48. The actual output was 8.86 Mb/d, higher by 0.21 Mb/d.
This indicates that onshore L48 production is increasing at a rate faster than expected, based on recent CEO comments.
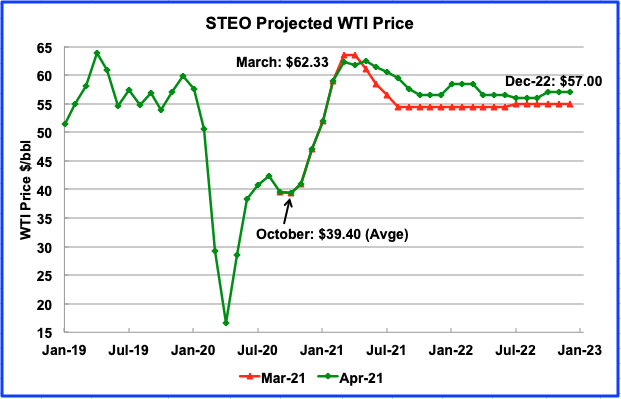
The May 2021 STEO price forecast is very similar to April and continues to project a WTI price of $61.50/bbl in June 2021. It drops to a low of $56.50/b in October.
The July WTI contract settled at $66.32/bbl on May 28, higher than the EIA projection of $60.50
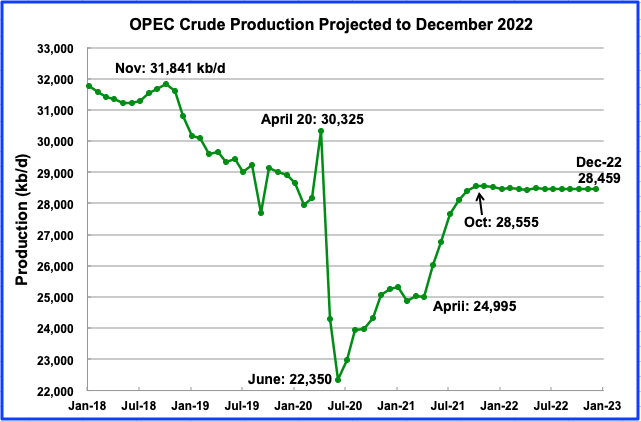
This chart shows the STEO’s forecast for OPEC crude output to December 2022. OPEC’s crude output is projected to increase from April to October by essentially 3,500 kb/d. After October output remains flat. The October output is virtually the same as OPEC’s output on January 2020, just prior to the onset of the pandemic.
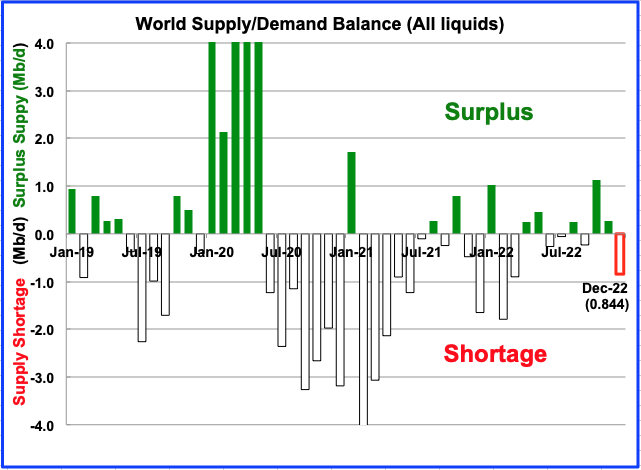
This chart show the historical supply/demand situation up to February 2021 and after that, the EIA’s forecast out to December 2022. After the supply surplus from February to June of 2020, world oil supply was intentionally reduced by OPEC and its partners. The US also reduced its output but the reduction was more related to the low price of oil.
The May 2021 IEA report states that as of April 2021, world oil inventories have been restored to where they were pre-pandemic. The magnitude of the shortage that was required to return world inventories back to their normal five year average levels can be seen in the shortages from July 2020 to July 2021.
From July 2021 to December 2022, the average deficit is close to 110 kb/d. To get an idea of how this forecast changes, a record will be kept of the December 2022 shortage to see if it rises or falls.
Drilling Productivity Report
The Drilling Productivity Report (DPR) uses recent data on the total number of drilling rigs in operation along with estimates of drilling productivity and estimated changes in production from existing oil wells to provide estimated changes in oil production for the principal tight oil regions. The following charts are updated to June 2021.
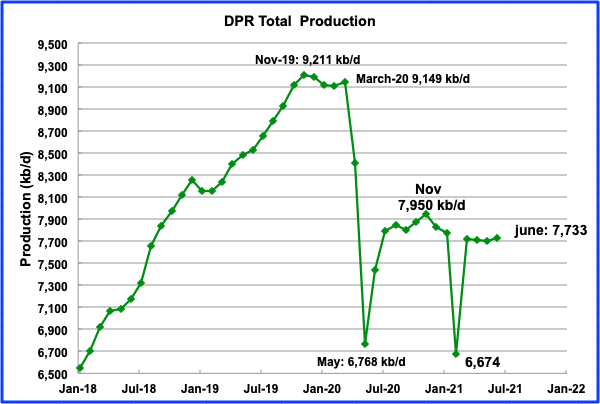
Above is the total oil production from the 7 DPR basins that the EIA tracks. Note that the DPR production includes both LTO oil and oil from conventional fields
The DPR is projecting output for June 2021 to increase by 26 kb/d over May to 7,733 kb/d and higher by 1,059 kb/d from February’s snow storm induced low. It should be noted that the May DPR has revised up the May output in the April report from 7,612 to 7,707 kb/d, an upward revision of 95 kb/d.
Output is essentially flat from March to June because the Permian’s increase is currently being offset by declines in the Eagle Ford, Bakken and Niobrara basins.
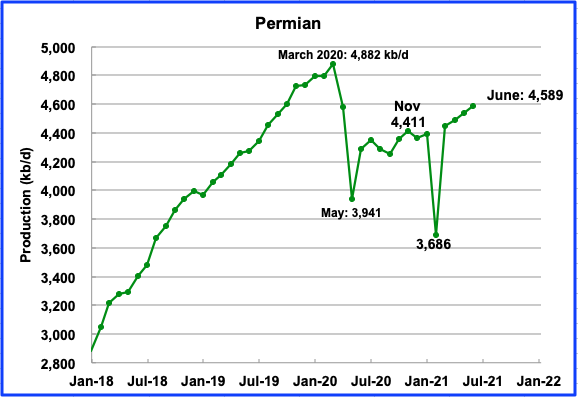
Permian output in June 2021 is projected to be 4,589 kb/d, up by 54 kb/d from May.
During April, 225 rigs were operating in the Permian, up from 100 in November. These 225 rigs are clearly sufficient to offset the decline from older wells and are increasing production. During May an average of 229 were operating.
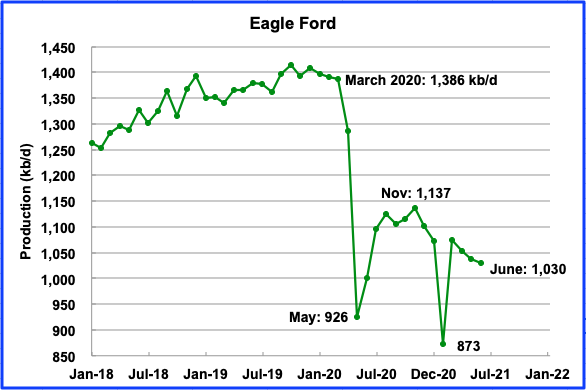
Eagle Fordʼs output reached a recent peak in November after shut in wells were brought back online and then began to decline. In June, Eagle Ford’s output is expected to drop by 8 kb/d to 1,030 kb/d.
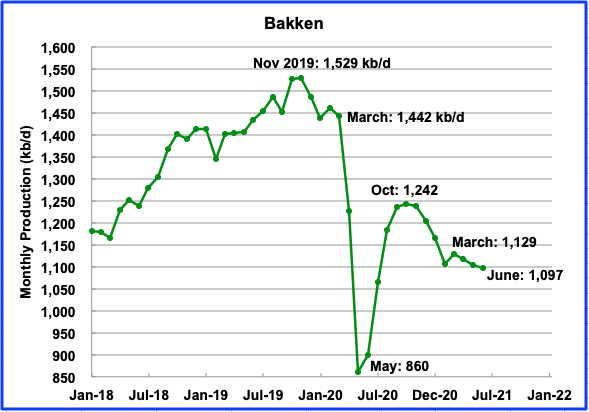
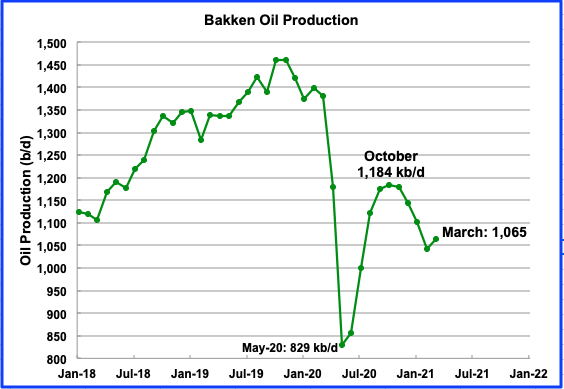
The DPR forecasts Bakken output in June to be 1,097 kb/d a decrease of 7 kb/d from May.
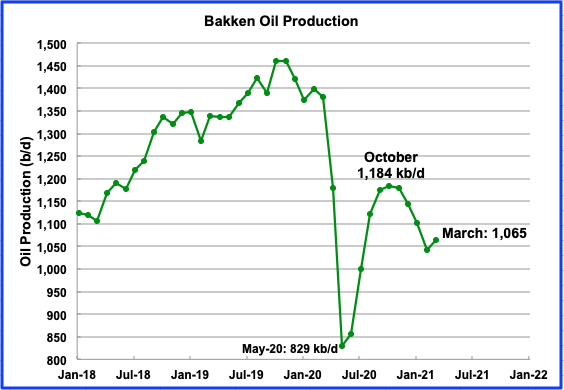
According to the North Dakota Oil and Gas division, March output in the Bakken was up by 24 kb/d and the number of wells increased by 324. Output per well was 76 b/d down from a high of 108 b/d in November 2019.
Note the difference in March output between the ND O & G division and the DPR, 1,129 kb/d vs 1,065 kb/d
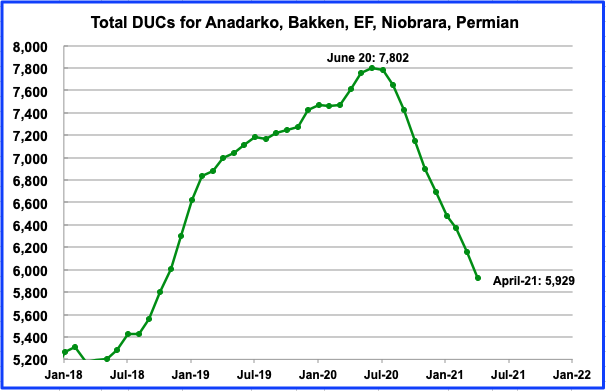
Above are the DUCs from the primarily oil producing basins. In April, DUCs declined by 230 to 5,929. Of the 230, 121 came from the Permian.
LIGHT TIGHT OIL (LTO) REPORT
The LTO database provides information on LTO production from seven tight oil basins and a few smaller ones. The May report projects the tight oil production to April 2021.
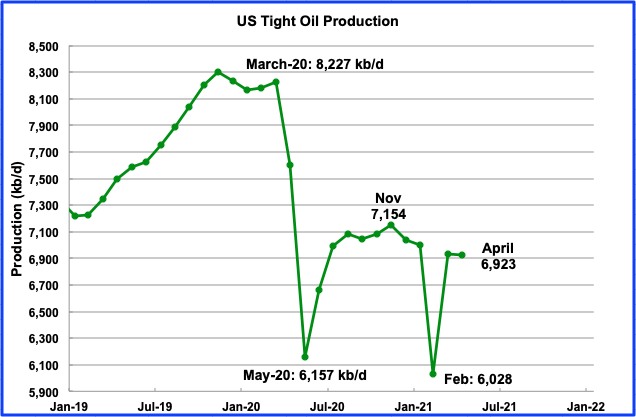
April’s LTO output is expected to decrease by 9 kb/d to 6,923 kb/d. Note that April’s output is still lower than November’s output by 131 kb/d.
The May report made a significant revision to February’s output level. February output was revised down from 6,517 kb/d to 6,028 kb/d, a reduction of 489 kb/d.
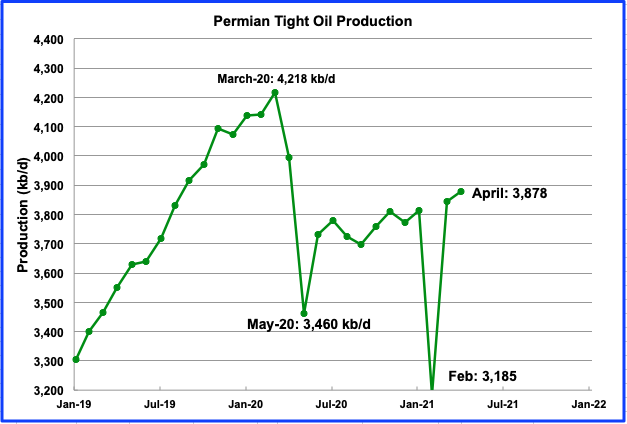
Permian LTO output in April is projected to increase to 3,878 kb/d, an increase of 35 kb/d. From the September low of 3,698 kb/d, LTO output in the Permian is increasing at a an average rate of 25.7 kb/d.
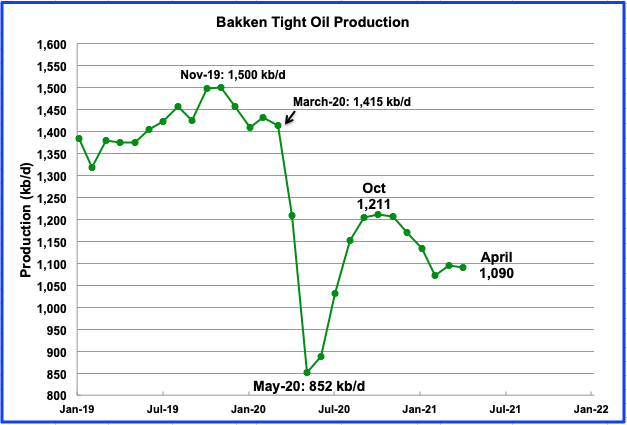
After March’s increase in output, the Bakkenʼs April output is expected to decline. April production dropped by 6 kb/d to 1,090 kb/d.
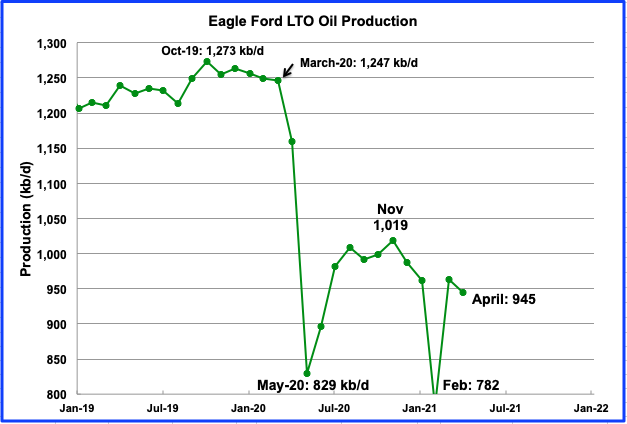
The Eagle Ford basin is expected to produce 945 kb/d in April, a decrease of 19 kb/d from March. April output continues the decline that started in December 2020.
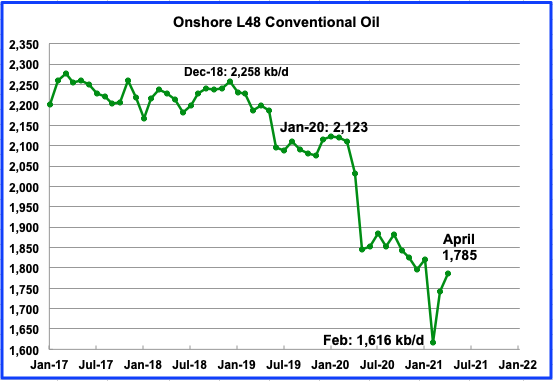
Conventional oil output in the On-shore L-48 is expected to increase by 43 kb/d to 1,785 kb/d in April 2021. This estimate is based on a combination of the April LTO output and the May STEO report that projects US on shore L48 to April.
World Oil Production
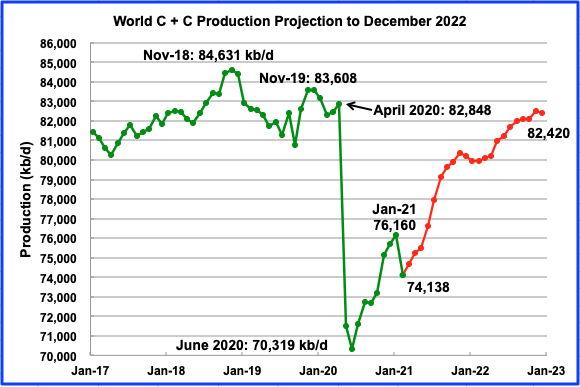
February’s world oil production decreased by 2,022 kb/d to 74,138 kb/d according to the EIA. The biggest contributors to the decrease were the US 1,198 kb/d and Saudi Arabia 900 kb/d.
This chart also projects world production out to December 2022, red graph. It uses the May STEO report along with the International Energy Statistics to make the projection. It projects that world crude production in December 2022 will be close to 82,420 kb/d. This is 2,200 kb/d lower than the November 2018 peak of 84,631 kb/d.
Note that the December 2022 output was revised up from last month’s report by 352 kb/d.
150 responses to “US March Oil Production Rebounds Strongly From Winter Storm Low”
Thanks Ovi,
GOM production is higher than I expected at 1.87 mmbopd, and higher than EIA expected. Not sure what’s behind that – not sure if we are seeing the cumulative effect of a number of new wells scattered throughout the GOM, or from the ramping up of a project or two, or both.
BOEM recently released their 2021 assessment of undiscovered resources in the entire OCS. They update this every 5 years. The biggest change is their view of the GOM – going from 48 BBO to 30 BBO. See attached.
https://www.boem.gov/sites/default/files/documents/oil-gas-energy/resource-evaluation/2021%20Fact%20Sheet.pdf
SouthLaGeo,
The udpated resource estimates look pretty reasonable to me. What do you think?
For oil at $60/b and NG at $3.20/MCF they have GOM at about 20 Gb for UERR (risked undiscovered economically recoverable resources.)
“UERR (risked undiscovered economically recoverable resources.) ” . One word ” Bullsh^t” . How can you calculate risk on something which is undiscovered ? Typical jingoism . Been searching for some ” undiscovered ” money in my bank account from the last several years , perhaps I will ” discover ” it someday . Hope lingers . 🙂
Dennis, I still think its a bit high, but much more reasonable.
Hole in Head – How can you calculate risk on something which is undiscovered? One way is to look at the exploration success rate of a trend and apply that to undrilled prospects. I suspect the geologists and geophysicists at BOEM do that. Oil companies do it all the time to risk undrilled prospects.
SLG , ” Oil companies do it all the time to risk undrilled prospects. ” Where is the risk calculation ? It is 50 % ? When I step out my house I will have a 50 % risk everyday that I will have an accident ? I think we must differentiate between ” possibility ” and ” probability ” . In one my earlier posts I have mentioned that the tragedy of the oil industry has been the defining of the various components example BOEPD , total liquids , DUC ‘s etc . Smoke and mirrors to hide the decline of oil production . UERR falls in the same category which is ” meaningless ” .You and Mr Kaplan are my” go to” guys when it comes to GOM stuff . Greatly appreciated what inputs you provide . Be well .
So how is risk calculated on an undrilled prospect? First, what are you risking? Usually, in the Gulf of Mexico, for an smallish undrilled (20-40 mmbo) prospect that you plan to tieback to an existing facility, you are probably risking the probability that you will find enough hydrocarbons to justify completing the well (and pay for the tieback itself). A good example would be a well imaged undrilled Miocene bright spot in Mississippi Canyon that is outboard of salt. Water depth is maybe 4000′, and well depth is say 16,000′. These are the kind of prospects that made LLOG. They typically have a pretty high probability of success – say 60-80%. If successful, you will tie it back to an existing facility. Unfortunately, there are not too many of these left.
Another GOM prospect type is an undrilled subsalt Wilcox prospect in Keathley Canyon where success is probably defined by finding enough reserves to justify a new facility. it’s probably not too well imaged because it’s subsalt, so there is a fair bit of structural risk. Water depth could also be 4000′, but the well depth is 30,000′. You need at least 150 mmbo of recoverable reserves to justify a facility. POS is probably around 20-30%, and you would need at least one additional appraisal well to consider development. Now, even these are becoming harder to find, and, more and more, these are being looked at as potential tiebacks to existing facilities. In that case, maybe 40-60 mmbo of recoverable reserves will work.
I didn’t actually answer how risk is calculated. It’s calculated by estimating the probability that the key petroleum system elements will be present. Those include:
reservoir, geometry, seal and hydrocarbon charge.
You estimate these, and then multiply them together. For example it you think there is a 90% probability for all 4 of them, your POS would be 66%.
A great deal of effort can go into this.
Thanks SouthLaGeo. Some people think statistics are BS, they are wrong, thanks for answering the question posed by HIH, I believe you are correct and you know far more than me, so even if I disagreed, I would likely be wrong in that case.
HIH,
You ask this question as if nobody had ever asked it before. In fact, mathematicians have been thinking about how to deal with probability in situations of incomplete information for centuries.
You might find this introductory video interesting.
https://www.youtube.com/watch?v=BrK7X_XlGB8&ab_channel=JuliaGalef
SLG – I think one of the things they don’t consider properly is timing. Most of these resources will only be developed on the back of existing infrastructure (as tie-ins to platforms and using existing pipelines and on-shore gas plants for natural gas). At present discovery rates much of that will have reached end of life, uneconomic lo maintain, and therefore decommissioned before it could be utilised by any of the new resources.In the eastern area, and a lot of the far western, there is no infrastructure in the first place and the whole estimate depends on getting some major anchor developments (100,000 bpd at least, maybe .5Gb reserves) before anything could get bootstrapped up). There has been no evidence of anything like this at these margins as far as I know. The E&Ps won’t even risk exploration at any price in these circumstances.
I also think they don’t account fot maturity in exploration of the plays. Many of these areas have been poured over repeatedly and rejected repeatedly in successive licensing rounds, but I don’t think that gets reflected properly in the risk parameters put into the monte carlo models. Ultimately these have to come down expertise and experience and tend to use a coarse, one size fits all approach over a region (of course things may have moved on since my time, and BOEM may have more sophisticated methods, but I doubt it – those sort of nuances would have to come down at the individual field and even well level which only local company engineers would have knowledge of).A look at the creaming curve for licences or exploration wells shows howcthings have changed.
Around 5 Gb of oil seems reasonable, which matches a guess I made (I’ve made a few so not surprising one is close). On the gas side I think they are far too high unless they know of some attractive dry gas prospects (shallow water presumably) that have yet to be explored.
Tks SLG and Mr Kaplan for explanations . So much to learn from you .
Thanks George,
Ever since the price crash in late 2014 industry’s GOM exploration model has focused on tiebacks vr. new facilities. Part of that is due to how quickly a tieback can provide a return on investment, but another part is due to your point about the exploration maturity of the northern offshore GOM. There just aren’t alot of big exploration opportunities remaining. That’s why its not a big deal that the Biden administration is canceling offshore lease sales. Most of the attractive leases that are available have already been either leased and never drilled because the operators had more attractive prospects in their exploration portfolio at the time, have been drilled with the result being either a complete dry hole, or a subcommercial discovery, or acquired as protection acreage.
Having said that, a potential trend opening well is currently being drilled – Mississippi Canyon Block 35, Chevron operated Silverback well. The primary objective is in the Mesozoic – I think the Tuscaloosa.
If successful, it could open up this trend in the central/eastern GOM. This part of Mississippi Canyon is very heavily leased up, so operators will look deeper on their seismic to see if this section looks prospective on their property.
I do have one quibble – in your first paragraph you suggest that for a new facility you would need to be able to justify 100 kbopd of production and 500 mmbo of reserves. 500 mmbo seems too high to me. I suggested 150,, maybe that’s a bit low in today’s environment? Maybe something in between? 200-250?
SLG – yes you’re probably right, 200mmboe would support 100kbpd, maybe with a decent upside, so to cover for myself let’s say 500 as a 3P plus some contingent possibilities and nearby exploration prospects.
SOUTHLAGEO
Thanks for the info. What do you think of the STEO forecast out to October 2021? Is the decline related to maintenance and a few hurricanes. Also do you know what the typical decline rate is of the deep water GOM wells.
The decline between now and October seems too steep to me. Having said that, I don’t think it’s maintenance related, but the low in October is probably hurricane related.
You mentioned a number of projects coming on line in 2021, and that could be contributing to this early production boost. Murphy has a few slated to come on line this year – Ourse and Calliope, but those are both 1-2 well projects. That’s at most 15-20 kbopd new production.
BP expansion projects at both Thunderhorse and Atlantis are projected to come on pretty soon – if they haven’t already. That’s 50-100 kbopd new production.
The next big new facility projects, Shell’s Vito and BP’s Mad Dog 2, are coming online in late 2022. I think that is what is contributing to the boost in the EIA’s projection at the end of 2022. That’s 150-250 kbopd new production.
I’m going to say 10% as a typical decline rate for a deepwater well, but with alot of caveats. If the well is drilled high on a big structure in a strong water drive reservoir, it may produce at high rates (15-20 kbopd) with very little decline for a few years before water production starts, then the decline could increase.
Well, I’m not one to say “I told you so”, but I did, didn’t I. 🙂 Bold mine.
This Time Is Different: Outside OPEC+, Oil Growth Stalls
“This time is different” may be the most dangerous words in business: billions of dollars have been lost betting that history won’t repeat itself. And yet now, in the oil world, it looks like this time really will be.
For the first time in decades, oil companies aren’t rushing to increase production to chase rising oil prices as Brent crude approaches $70. Even in the Permian, the prolific shale basin at the center of the U.S. energy boom, drillers are resisting their traditional boom-and-bust cycle of spending.
The oil industry is on the ropes, constrained by Wall Street investors demanding that companies spend less on drilling and instead return more money to shareholders, and climate change activists pushing against fossil fuels. Exxon Mobil Corp. is paradigmatic of the trend, after its humiliating defeat at the hands of a tiny activist elbowing itself onto the board.
And what they don’t realize is that the two largest producers in OPEC+, Russia and Saudi Arabia, are on the ropes also. Russia has admitted it but Saudi is still trying to deny the fact.
Ron
Great find.
For me that article was behind a paywall. Yahoo has it here.
https://ca.finance.yahoo.com/news/time-different-outside-opec-oil-040000053.html
Ron,
If non-OPEC+ output grows slowly or not at all, oil prices are likely to rise. Eventually the price may rise to a level that entices non-OPEC+ producers to invest in new oil production. My guess is that a $75 or $80/bo Brent oil price might change things, we may know by November 2021 whether my guess is correct.
Dennis,
You assume that oil price is independent of the general condition of the USA economy and is determined by supply and demand. I think this is a fallacy.
Oil is the strategic resource and all dirty tricks with “paper oil” and the power of Wall Street financial behemoths will be used to keep price low. Rise of oil prices is an invitation to the recession which Biden administration is determined to avoid.
The only established fact now that the rise of oil output probably will never happen and the countries need to adapt. The USA put all eggs into EV backets and is toying with wind and solar; which means that it probably will be burned because the increase of the number of EV on the roads above single digits will destroy the stability of the USA electrical network.
In 2020, there were 286.9 million cars in the US. Of them the plug-in are less then 1.4 million. Forty-five models were sold in 2019 (the last “normal” year), but the all-electric Tesla Model 3 was the most popular by far, with over 154,000 vehicles sold — or 47% of total plug-in electric sales in 2019.
So currently EV are less then 0.5% of the total car fleet despite all the noise.
Consequences of reaching 10% are tremendous both for electrical grid and for consumers (lion share of those cars are luxury personal cars, exemplified by Tesla and are badly suited (even dangerous; somebody here proposed Norway as a counterexample, but that’s plainly stupid as they have their share of problems (dead Tesla in airports car lots after a week or less, strangled vehicles on country roads, etc) and is a tiny country with climate determined by Golfstream ).
EV in northern states (think not only border with Canada like Chicago and Alaska but even NY, PA and NJ ) or a state with very hot summer (think Texas, Florida) and generally outside California (or any similar region without harsh winter and/or very hot summer) are very problematic.
Building of new nuclear stations is politically incorrect and that will have consequences of EV deployments. Burning natural gas to produce electrical energy, while gas can be used as a car fuel directly is plain vanilla stupid. But this is the path the USA had taken.
As neoliberal elite lost legitimacy political stability in the USA is also an interesting question to ponder. The rise of gas price might serve as a yet another tipping point.
Likbez,
Wrong on almost all counts. The demand for oil is determined by the state of the economy to a very large degree, only a fool does not realize this.
As to grid being strained by EVs, doubtful, lots of excess capacity at night when most EVs will b e charged. As to EVs not working in cold climates, I own and EV and live at about 45 N latitude, not far from Canada, no problems with the EV, California is very hot and no problems there, so basically you’re wrong in every respect. Perhaps EVs would be a problem in Antarctica. 🙂
Dennis.
Do electrical storms damage EV? Any difference between them and ICE in electrical storms?
Thought of that recently when big storm hit while I was on the road. Pulled into a hotel. Power was out. One Tesla was plugged in there.
Power came back on after about an hour. Early next morning the Tesla was gone.
As Rivian and Ford are getting closer to something I’m interested in, was wondering about this.
Shallow sand,
I don’t think EVs are any more prone to damage by electrical storms than ICEV. The EV pickups may be very nice, I am more of a sedan/SUV driver so not really something I would buy. Keep in mind that at present the charging network is far better for Tesla in the US than for other companies, though things can change quickly. The Cyber truck has pretty good specs, but is a look you may not find appealing
Tesla’s closest service center is almost 3 hours away from me. I am aware that they allegedly never need service, but that is still a big ask when Ford and GM both have service in my community. I also personally know the owners of these dealerships, and will wait till they offer the products. I assume Ford May offer Rivian products as they own a stake, maybe not?
I will be ready to trade in 2023-2024. I suspect that will still be an ICE truck given how rural we are? So I’m probably 10+ years away, unless gasoline prices super spike or other factors change more rapidly.
I do see more and more Tesla all the time in urban areas. I do think there will be a big urban/rural divide on EV given not only practical considerations, but also political ones.
Dennis
The current electrical grid is not prepared for the increased load associated with EV charging at night. Electrical equipment is designed to operate on a specific duty cycle which affects the temperature of components and its effect on the insulation. The transformers are the issue. The current in place transformers were designed with the condition that they will cool over night. As more EVs charge overnight they will not cool as much and will have a shortened life as the insulation degrades.
In our area, they have doubled the incoming voltage supply and are replacing the transformers. Doubling the voltage cuts the incoming current in half and reduces the associated resistive heat.
Yeh, the grid needs a lot of work, and only a poorly managed country would tolerate such a shabby system that is woefully unprepared for what is on the immediate horizon. The grid needs a lot of attention, planning and funding.
It called national security, economic security, climate resiliency, domestic industry, and general stability.
Meanwhile people are obsessed with all kinds of BS.
I believe, nevertheless, that there will be problems with the power grids. Since they were not designed for charging electric vehicles. If at the peak of daily consumption, a 110 volt network was calculated, say, for an average household based on a current of 40 amperes. Charging a car battery for 60 kilowatts at such a voltage will require a current of 60-70 amperes for 8 hours, not counting that refrigerators and air conditioners are operating in the household. Then it is impossible to calculate when they will connect the charging all together. And someone else can turn on charging during the day. Thus, peak loads will increase, which means reserve power must be increased.
I believe in the next 10 years the demand for gasoline generators with a capacity of 5-10 kilowatts will increase …
Alexander,
EVs charge at 240 V, an outlet needs to be installed, typically about 400 US dollars, typically a 40 Amp circuit will do. Most people drive about 40 miles per day on average and typically I need 250 Whr per mile for a Model 3 (average over 2.5 years). So that is 40 times 250=10000 Whr= 10kW-hr. At home my car charges at 32 A at 240 V or 7.68 kW, so only 1.3 hours of charge for a typical day. Peak to trough change in electrical load is about 5 GW in New England (data from 2010 at EIA), this is about 33% of peak demand. For the US as a whole there is about a 30% difference from peak to trough in July (month with largest swings) note that other months are cooler so transformer overheating would be less of an issue. For US the July peaks are about 650 GWhr with a swing down by about 200 GWh, so as we need only 10 kWh per car per day, we currently have the capacity for 200 billion WH divided by 10000 Wh or 20 million Model 3 type vehicles.
An alternative way to look at this is to look at light duty vehicle miles which can be covered with about 83 GW (assuming 250 Wh/mile as achieved by model 3), the average grid net output of the US is about 450 GW over the course of the year, if we assume about a 30% peak to trough that would be 135 GW which could easily cover charging for light duty EVs. To cover most heavy duty trucks may require more grid output, though some might come from electrified rail which might be more efficient and require less electrical energy per ton-mile of freight moved.
None of it happens overnight, we will adjust the sails as needed. 🙂
People express their worry that electric grids are not ready for the huge addition of EV charging that will happen (without any doubt) over the next couple decades.
“The current electrical grid is not prepared for the increased load associated with EV charging at night. ”
“I believe, nevertheless, that there will be problems with the power grids. Since they were not designed for charging electric vehicles”
I will not trivialize these concerns, and am certain there will be at least some growing pains.
But these problems/challenges will be very small compared to losing affordable transport capability as oil depletes.
The grid/charging challenge is not some insurmountable engineering challenge that requires some new discovery. Its basic industry, appropriate planning and policy making, and good management- the kind of thing China can do. Can the USA?
Dennis Coyne, Hickory Hope I’m wrong But:
1. It is not likely that all owners of electric vehicles will charge them at night, or at the time of the lowest load. There may be moments when, during peak loads, suddenly many people decide to charge their car.
2. With a large concentration of owners of electric vehicles in one area, there will be an overload not only of electric transformers, but also of power grids.
3. With an increase in the number of green power plants, there will be less room for maneuvering loads. With an increase in green power plants, the gap in reserve capacities will be negative. It is necessary to build a “hot reserve”. Probably gas or diesel power plants, this will increase the cost of electricity.
4. If there is a lot of traffic using electric vehicles in winter, the electricity consumption will be higher. for heating. Also in hot weather.
5.In the USA, of course, there is an advantage that the power grids are high-voltage and everywhere (it seems so) they put separate transformers for each household …
Alexander,
I did not say everyone will charge overnight, but it is likely that most will because it is cheaper to do so. In my area electricity is 29% lower cost during off peak hours (9 pm to 7 am) vs peak hours, so I charge during off peak periods to save money.
No there is not a separate transformer for each house. There may be some charging during the day, but for those that want to save money they will get a cheaper rate overnight by using time of use rates, so wealthy people will charge when they want, frugal folks like me will do most of their charging during off peak periods. In the winter in the US, electricity demand tends to be lower than during the summer as most heating is with natural gas and a bit of diesel (called home heating oil when used for heat) but almost all cooling is with electricity. During summer there will be more solar electric available as that expands, in winter there will need to be NG backup, though potentially excess output in summer could be used to produce and store synthetic fuel for winter months. It is likely demand could be shifted with power rates that vary based on demand and consumers would have a readout of current electicity price in their home to base their decision on whether to charge or not.
Typically in US most outlets are 120V, but 240 outlets can be installed for specific uses, typically cooking in the kitchen and electric dryers, and now EV charging. For average light duty vehicle use of about 40 miles per day, only 1.5 hours of charging is needed, I typically charge once or twice per week at 4 or 5 in the morning near the demand low. In the future as their is more overnight demand rates will vary throughout the night and consumers can choose a low price period for their charging, (maybe 2 AM to 4 AM).
I doubt it will be a problem in the near term and if it becomes a problem there are many possible solutions.
In short, I disagree that this is likely to be a serious problem without a solution.
Dennis. Thank you. I always thought that in the US the power supply for households is not like in Europe. It comes from a small transformer on a high-voltage line. I was wrong.
—
“For US the July peaks are about 650 GWhr with a swing down by about 200 GWh, so as we need only 10 kWh per car per day, we currently have the capacity for 200 billion WH divided by 10000 Wh or 20 million Model 3 type vehicles. ”
____
The situation may change, there will most likely be more than 20 million electric cars. It is important not only how much energy is needed for charging, but that at peak loads the capacity of power plants to cover the load and the power grid to withstand it. And it is also possible that trucks will also switch to electricity, this will aggravate the situation.
It does seem like we are at an inflection point here.
On one hand you can purchase a Ford F-150 Lightening here in the USA.
On the other hand we are just starting to see the emergence of teeth at the gum line on international activism aimed at the big oil companies- “Many in the industry fear a wave of lawsuits elsewhere, with western oil majors more immediate targets than the state-owned oil companies that make up much of OPEC production…“We see a shift from stigmatization toward criminalization of investing in higher oil production,” said Bob McNally, president of consultant Rapidan Energy Group and a former White House official.”
While it only fear (of activism/lawsuits) currently, it will likely affect decision making on reserve replacement attempts.
And “As non-OPEC production increases less than global oil demand, the cartel will be in control of the market,”
Article linked below suggests a Goldman Sachs estimate of $80/bo by the end of 2021.
https://oilprice.com/Energy/Energy-General/Oil-Rises-After-Cataclysmic-Boardroom-Showdown.html
Ovi, great work as usual .My POV is that it is GOM that is the major factor in the comeback , not “shale plays ” that are supposedly going to be the saviors of Industrial civilisation . Confirms my argument ( and of many others )that shale is all juiced out . Better to lower expectations from LTO for the future .
Thanks HH
I know the general opinion seems to be that the shale plays are finished. Looking at the data that is in the post doesn’t confirm, at this time, that shale is overblown. Let’s look at the two states at the top of the post, Texas and NM and the onshore L48 first chart.
Looking at the Texas increase from January to March one gets 4,745 – 4,661 = 84 kb/d or 42 kb/d/mth.
Looking at NM from November to March, one gets 1,155 – 1,112 = 43 or 11 kb/d/mth.
The total being 53 kb/d/mth.
Looking at the total onshore L48 increase from January to March, one gets 8,861 – 8,814 = 47 or a net of 23.5 kb/d/mth. So within the onshore lower 48 there is 30 kb/d/mth of decline.
I would not bet much on my two month or four month analysis, but I think we will need to monitor what is happening in Texas and NM for another six months to get a better idea of what is happening in the Permian. The price of oil will be the determining/critical factor.
Ovi,
In my opinion GOM will be relatively flat (or down a bit) as SouthLageo has predicted. Tight oil output will increase if oil prices gradually rise to $75/bo by 2022 as demand increases and supply remains restrained. Eventually this will lead to increased tight oil output (my guess is that this starts in July 2021 with output rising gradually to previous tight oil peak by 2024.) Time answers many questions.
Dennis
As I have noted in the past, what will be critical to OPEC plus is the rate at which the US adds oil into the world’s supply/demand situation. If the US increases its output at an average rate of 50 kb/d/mth and world yearly demand gets back to 1.0 Mb/d or say 85 kb/d/mth, then OPEC will be happy because they will be able to slowly increase their supply, until they can’t.
It is not clear to me how unhappy OPEC is with US supply. For the past four years, the US has relieved them of the need to deliver more oil. With the big sisters cutting back on exploration and the increasing push by NGOs to reduce oil production too fast, in my opinion, we may be moving into a world that only the few of us on this board are already seeing and thinking about and OPEC plus may begin to feel the stress of increasing output.
There is a famous saying along the lines of: “Be careful what you wish for.”
Ovi,
I think you are saying that in the medium term (say 2025 to 2030) we are likely to see demand outstrip supply in the World oil market at current oil price levels (about Brent $70/bo as I write this), I agree. That is why I expect oil prices to increase, probably to $85/bo (in 2021 US$) for Brent crude by 2025, the oil price needed to match supply and demand is harder to guess for the 2025 to 2030 period, but my WAG is $85 to $100/bo, it depends in part on the speed that the transition to electric transport occurs (which will limit demand growth to some degree).
Regarding the last point, here is the 5 year chart of the national fleet for one country, showing vehicles with a plug growing from 6 to 19% of the total on the road.
And the rate of growth is increasing.
For example, in May 84% of the new vehicle sales had a plug. with Ford Mustang and VW ID4 being the front runners.
This country (Norway) is not representative, but nonetheless is an example of what all countries will be seeing as this decade unfolds.
Hickory,
The case of Norway is encouraging, but to me it is unrealistic to expect such rapid progress in the US, Canada, and the EU. I hope I am wrong, but believe reality will be perhaps 50 to 60% of light duty vehicle (GVW less than 3 metric tonnes) miles travelled will be with electricity by 2035 and perhaps 85% by 2045. Heavy duty vehicles will lag behind this by about 5 to 10 years and some long haul transport may move to rail which might be electrified over the next 20 to 30 years. By 2050 we might have reduced land transport oil ( C plus C) use to about 5% of what is used today.
Yeh, the vehicle retirement in Norway will be quicker than USA, since they have a higher level of wealth than most us states, and seem a lot more gung ho about the process of shifting to electricity. But the same general trend applies, and some of our big states will shift faster than the rest, like California.
LTO drilling locations are diminishing faster and faster. Look for massive consolidation as E&P companies can only grow through M&A. Many companies have drilling inventories of less than four years. The LTO revolution is over as we knew it and the number of E&P companies will shrink dramatically. There will be minimal growth and much less than 75kbd per month.
The energy transition will be painful and longer than anticipated. Criminalization of an industry that embodies national security and that gives the “haves” a competitive advantage in favor of hopes and prayers is folly and irresponsible.
China will bury us as they try to capture as much of the hydrocarbon as they can knowing that energy equals power. A few years ago I heard Chinese venture capitalist speak at the Aspen Institute. He claimed that democracy is not a form of government but instead a religion. He gave the example that in Nigeria, the US is concerned about human rights while the Chines could care less who dies in Nigeria as long as they can get the oil. He also stated that the Chinese only care about how they can feed, shelter, move, and run their economy and human rights are not remotely introduced into their paradigm.
Something to think about.
The reason why they will disappear.
China is the new Japan. Look at the reproductive rate for South Korea, that’s where China is heading. Be nothing but a bunch of old farts with any innovation crushed by a totalitarian government. Their statistics are a joke, building entire cities that no one wants to live in but yet adding it to the GDP. The US is a hot mess and always will be but at least we allow free expression and entrepreneurial freedom. China will never catch up, already a has been.
LTO Survivor,
you said many companies have less than four years of inventory. Could you into more details? Which companies are you talking about? Thank you!
Best
Toby
Devon, Matador, Colgate, Oasis, CDev and there are more.
MIke S in a post said 3 years of extractable shale oil . 3 or 4 is just statistical chatter . The gist is , not a long way to go for this to run .
LTO Survivor,
are you talking about the locations in the Permian? OAS has a lot of acreage in Bakken – most is tier 2 & 3 – and that is more than 4 years of inventory. Do you have an estimate of inventory for companies in the Permian?
Best
Toby
To be clear I have suggest that PDP-R/P is two of the three major shale oil basins is around 3. Which should make sense to anyone, I would hope, given the large number of shale oil wells now making 20 BOPD, still declining at 10-15% per year and soon to reach economic limits. It would also make sense, I hope, because the weighted decline rates in all shale oil basins is 85% or more the first 3 years of production life.
Almost anybody looking to take on more debt in a merger or acquisition, and/or who is willing to dilute stakeholder equity in the process is, running out of A locations. Diamondback, comes to mind, and numerous others. “Drillable” seems to be confusing. Most A locations can’t make money, enough money to pay back debt and replace reserves without having to borrow more money…who is going to keep drilling B and C locations on the flank, goat pasture stuff… and with what? Where’s the money going to come from? $70 doesn’t help anybody with debt.
Toby , you said ” OAS has a lot of acreage in Bakken – most is tier 2 & 3 – and that is more than 4 years of inventory. ”
2&3 tier is crap stuff . That is why it is classified as 2&3 tier . Probably they will need to shovel this out . Is it even worth at $ 70 ? I doubt it . Just noise to fill in the blanks in the narrative ” all is well “.
Hole in Head,
I am not saying it is profitable at 70$, but I don’t think that oil is going to be that cheap for years. As demand continues to recover supply has to increase or the price has to go up. At higher prices all of that tier 2 acreage will be drilled – sooner or later. I don’t see OPEC pricing shale out of the market in long run. They need the petrodollars.
Best
Toby
Toby, prices will go up ?? How up ? The limit will be set by ” affordability ” and not by ” supply / demand . Diamonds at $ 1000 a carat are ” affordable ” for Jeff Bezos , diamonds at $ 10 are “unaffordable” for me ,so no demand from me . I will give you a real life example . In India the extremely poor buy a packet of biscuit which contains 6 pieces . It costs $ 0.10 cents . This is basic with a cup of tea for the extremely poor . Due to the economic crisis the sales of this crashed by 15% . Why ? The extremely poor could not even afford the $ 0.10 . It was not that there was a supply issue and there was no demand issue but the key was affordability . Oil is as essential to our economic system just as the packet of biscuits is to the extremely poor . So the next question is what will happen ? Just as the man will go hungery or maybe buy a packet and consume 3 pcs at one time and 3 pcs with the next cup but will not have a full stomach , similarly parts of society that will not be able to afford the high prices will have to forego/ cutout some of the benefits that oil provides by consuming less . This exclusion is going to be painful but then “peak oil” was never going to be pleasant . Learning from history when oil touched $ 143 there was talk of $ 200 . Even respected individuals like Matt Simmons were saying this but the price crashed because the economic system could not afford it .
For the US from 1997 to 2020, the proved developed producing reserve to production ratio is shown in chart below.
Hole in Head,
India is not the world. I agree that there are people who can not afford higher oil prices but there are billions of people who can. We are going to see a boom in travelling over the next months imo and a lot of money will be spent on infrastructure projects in the US and around the globe. On the other hand investment in new oil production capacity was delayed or cancelled.
As bad as it is, the market doesn´t care what prices of oil poor people can afford. Time will tell where the price will go. If I had to make a bet, I would say up is more likely than down in the mid term.
Best
Toby
Holeinhead,
Oil price went down in 2008 because of financial crisis which was not caused by the high price of oil, it was due to poor regulation of the banking industry. Oil price averaged $110/bo in 2019$ from 2011 to 2014, it fell from this level not because oil was unaffordable, but primarily because supply was too high at that price level for the demand at that price level.
Yes affordability matters, but at the World level demand for oil at $100/bo(in 2021 US$) may match supply at that price level in 2025 or so when supply may be constrained due to depletion and lack of investment in the oil industry. Potentially demand may be lower as the World moves to electric land transport so there may not be the demand for $100/bo, but $85 to $90 may be a reality from 2025 to 2030.
Toby and Dennis , I guess we will just have to ” wait and see ‘” whose line of thought is correct . There are too many ” black swans ” flying as can be seen with my latest post regarding the Iranian situation . Any minor event can flip the scenarios we have laid out .
In reply to HH who wrote:
It was not that there was a supply issue and there was no demand issue but the key was affordability.
Hey! Just a cotton-picking minute here. Affordability is part of the supply-demand equation. If you say “It’s not a supply-demand issue, it’s affordability” you are talking nonsense. Supply and demand always determine the price. If there is a supply of any product but the price is too high for people to afford, then the price will drop until it is affordable. Either that or the supply will dry up until only enough is produced to fill the demand level of the price offered.
LTO survivor,
Are you in Texas Permian? Seems there is a lot of potential there at WTI around $70/bo. There are some older leases with high NRI which could be very profitable at current prices based on comments in the past by Mike Shellman.
My analysis suggests the average 2018 well pays out in 39 months at $10 million per well at $60/bo at wellhead.
LTO survivor,
The analysis I refer to above is for Permian basin average 2018 well based on shale profile data. The EUR of the average well is about 377 kb of C plus C over a 17 year well life (shut in at 202 months from first flow), at a nominal annual discount rate of 40%, the net present value of future cash flow is equal to well cost (assumed at $10 million in 2020 US$) at a wellhead price of $70/bo and well pays out at 25 months. As I write this the futures contract for WTI is trading at $69.44/bo and LLS was at $70.94/bo on June 2, 2021.
There is money to be made in the Permian basin at these prices.
OPEC oil output rise in May limited by Nigeria, Iran losses -survey
“The 13-member Organization of the Petroleum Exporting Countries has pumped 25.52 million barrels per day (bpd) in May, the survey found, up 280,000 bpd from April. Output has risen every month since June 2020 with the exception of February.”
Call om OPEC according to OPEC Monthly Oil Market Report for May 2021:
q2: 26.48
q3: 28.70
q4: 29.54
Unless there are some heavy OPEC revisions for April and May, in order for OPEC to average 26.48 million barrels per day in the second quarter, they will have to pump 28.85 million barrels per day in June. I just don’t believe that is going to happen.
I am extremely skeptical of the call on OPEC for the third and fourth quarters also. I just don’t believe either call will be met.
Ron,
I think OPEC could potentially meet the Q3 call on OPEC, if a deal with Iran is reached and they are able to ramp their output to the 2017 level prior to US pulling out of JCPOA, I agree the Q4 level will be tough to reach give decline in Algeria, Angola, Venezuela and the small OPEC producers (Equatorial Guinea, Gabon, and Congo).
Dennis,
If all sanctions on Iran are lifted, very soon, they may reach 3.5 million barrels per day by Q1 2022, but no way before then. I doubt they will ever reach 3.8 million again.
At any rate, to get to 29.54 million bpd by Q4 OPEC would need to increase production by 4.5 million bpd from April’s production level. Dennis, we both know that is not going to happen.
Ron,
That is why I said I agree that the Q4 call on OPEC will not be met, my expectation is that oil prices will rise and that oil demand will be lower than OPEC has forecast as a result of the increased oil price.,
Iran is saying they can increase oil production to 6.5mmbpd pretty quickly.
https://oilprice.com/Energy/Crude-Oil/Iran-Says-Its-Oil-Production-Could-Jump-To-65-Million-Bpd.html
There has been a lot of activity in Iranian oilfields since late last year (seen from satellite images) – after Trump’s defeat. You must have seen the rumour about Iran already exporting 1.2-1.5mmbpd to China with the oil branded to come from other countries (Oman, Malaysia, etc). They have been working there. They will increase the production to what it was in 2018. Though whether they can reach 6.5mmbpd is anyone’s guess
Iran Claims Its Oil Production Could Jump To 6.5 Million Bpd
It is truly amazing that there are people in the world who actually believe that.
Note: Since sanctions were enforced a few years ago, Iran has put a lot of oil in storage. They could produce several million barrels per day above what they are producing now but only for a very short time.
The above EIA Iran C+C chart looks totally different than the OPEC crude-only chart. Condensate is supposed to be the difference but there is no way condensate could make that much difference. Either the EIA or OPEC has a problem here.
Ron,
I agree Iran is not likely to reach 6.5 Mb/d in the future, but perhaps they will get to 4 or 4.5 Mb/d for C plus C output, Iran produces a fair amount of natural gas so their condensate output is likely higher than other big OPEC producers (KSA, Kuwait, Iraq and UAE) on a percentage basis (condensate divided by C plus C times 100).
Chart below uses EIA monthly data to find centered 12 month average for Iranian C plus C from July 1973 to Sept 2020.
Click on chart for larger view, true of every chart in comments.
There have proclamations made here that the global economy would not recover from the pandemic indefinitely, and that long lasting depression was the theme to get used to.
Well, that is not what the scene looks like, on a global perspective.
“Global economy will return to pre-pandemic level by 2022, says OECD
However, the OECD also warned that the recovery would be uneven and living standards in many developed economies will still fall well short of the levels expected before the pandemic.”
Energy demand will be higher in 2023 than in 2019. Unless something new happens to disrupt the global economy.
Current around of stimulus has run it’s coarse. I look for jobs numbers and inflation numbers to soften over next few months. Which means more QE and lower interest rates for longer. Higher stock prices.
But for the real economy. We pulled 5 years worth of GDP forward. Unless governments are prepared to spend even more on a monthly and yearly basis going forward than they did since March 2020 until now. And put more money into the hands of average people. We roll over first then fall off a cliff economically. Private banks just aren’t going to create the money via loan creation in volume needed to offset or match what the government has done over past year. So without further massive stimulus we get massive credit contraction.
With the debt burden not just public debt but private debt hanging over the economy we likely never return to pre-pandemic levels of Global GDP
Price action for oil is still bullish but that can change in a hurry when jobs and inflation data turn soft.
HHH, ” With the debt burden not just public debt but private debt hanging over the economy we likely never return to pre-pandemic levels of Global GDP ” . Been parroting this from a long time but few want to admit that
the BAU is over . Life is(was) a party and all parties must end .
Yeh. Someday the excessive debt game will be over.
Nobody knows when.
If I predict it will be one of any day in the next 100 years, I will be correct at least once.
But I don’t like being wrong on all the rest of the days, so …
cheers to a stable tomorrow, and the day after as well.
This video is by a Canadian oil market Fund Manager.
He make two interesting comments. He briefly mentions satelitte imagery of Iranian oil fields that shows many are working. He also thinks that OPEC is close to capacity once they return to their pre covid levels.
https://www.bnnbloomberg.ca/video/eric-nuttall-s-market-outlook~2211436
Ovi, refer Iranian oilfields . I have always said that Iran is producing and selling all the oil it wants to sell or can sell . The regime has outlived 10 US administrations and 6 US presidents inspite of sanctions . They are having to sell at a discount but at the end of the day the oil flows . Just some road bumps and a zig zag route . I doubt they have a lot of spare capacity .If and when the sanctions are lifted all what is ” unofficial ” will become ” official ” . As to OPEC or OPEC+ that they are close to capacity viewpoint is more prevailing by the day .
I cannot see the main story here nor in the previous main story…?
S,
Yes the website was down from around 6 PM May 31 to 6 AM June 1 when I messed things up.
The web site hosting service got me back up early on June 1 replacing the public_html directory with an old backup from May 27. I asked then not to restore the old database so I would not lose content and comments which had been posted from May 27 to June 1, but I must not have been clear enough in my email and they eventually restored the old database back to May 27 around 3 PM on June 1. I had a backup database stored from 3 AM June 1 and was able to restore comments and posts to that point, so we lost about 12 hours of comments which I cannot retrieve.
Thought I had dodged a bullet from 6 AM to 3PM when things were looking ok, in the end I screwed up. First world problem.
Thank you for your speedy effort to bring articles back, and generally a big thanks for keeping this site running. My nearly every morning coffee company for interesting info…
You’re welcome.
Interesting article about the possible impact on the oil market following the Shell ruling.
https://www.reuters.com/business/sustainable-business/opec-russia-seen-gaining-more-power-with-shell-dutch-ruling-2021-06-01/
Hi all,
I had a problem with the website yesterday and had the webhosting service help me fix it by about 6:30 this morning.
Unfortunately someone at the webhost company followed up later today and reset all the data back to May 27, deleting comments and posts back to that date. Luckily I made a backup at 3 AM today (Monday June 1) and was able to restore comments to that point in time. Unfortunately all of the comments from 3 AM to 5PM which were made today have been lost.
I am sorry.
Relax Dennis . S^^t happens . All is well that ends well . Take care .
Thx Hole in head. I am far from an expert, obviously.
Maybe I am all wrong, but I am not seeing where in the heck the labor is going to come from for US oil and gas production.
Where I am at, there just aren’t enough workers. Our oilfield is competing with every factory within a 60 mile radius. They are now paying $20+ per hour to start w signing bonuses and decent benefits for people w little to no work experience.
Restaurants here are closing and/or offering limited menu’s. No workers. Every single factory has a help wanted sign. The only business of any size not hiring is the oil refinery.
Oilfield work has a significant learning curve. I am not seeing the labor force there for it now, or long term.
I have a son in his 20’s who I ask for leads regarding possible workers. He says there aren’t and won’t be any serious people, because all of the people his age don’t want to go into a dying industry.
Of course, none of our next generation has any interest at all.
Had I guy call me yesterday who has a really good lease. He’s too old to pump it. His pumper quit, went to work elsewhere. He can’t find anyone. I told him, good luck. I suspect he will try to hang on till he finds someone.
We aren’t talking bad pay, pumpers here making six figures now or close, but it’s outdoors w weekends required. Not many people want to work on weekends or outdoors.
I think over 70% of Americans say they want to be able to work from home at least part of the time. Can’t work from home for most oilfield jobs.
Shallow Sand- do you think this labor situation is a reason to allow immigration (legal/selective) to increase? I am hearing about labor shortage in other industries as well.
And yet many citizens don’t want to go back to work.
Don’t know how long their savings will last.
When Trump blasted immigration I wondered just how many farms and meat packing plants he had visited. Without immigrants from S of USA, there would be massive food shortages.
Go to any vegetable or melon farm in the lower 48 or go to the meat packing plants in KS, OK and NE.
I suspect many immigrants work in the oil fields already in most states. Not so much here, but our field is much more local, and I suspect that will continue to evolve as well.
Have read Toyota is looking for thousands of employees to work on EV lines and is having trouble.
He says there aren’t and won’t be any serious people, because all of the people his age don’t want to go into a dying industry.
I really don’t see the oil industry as a dying industry. Yes, production has likely peaked and will decline for a long, long time. But the renewable revolution will not happen on schedule. Perhaps by mid-century but not likely even then.
What will happen, I believe, as production drops prices will rise, oil in the ground will become a very profitable asset. There will be a wild scramble to recover every last drop. I think becoming an oil worker today will lead to a rewarding profession in a few years.
Ron. That is not the narrative the younger people are receiving at all.
There are four 20 somethings who have had their college paid for, in part, by petroleum income. They all believe it is a dying industry.
One of my best friends has two smart kids, everything they have is due to oil income. Same deal.
Just telling you what I am observing in our small field.
Something like less than 10% of the students at the Colorado School of Mines have any intention of working for a FF company. Maybe that is a better stat.
” But the renewable revolution will not happen on schedule. Perhaps by mid-century but not likely even then.” In Europe, we are going to be forced to be more quick than that. We are going to take 12 to 20% decrease of oil supply in the teeth by 2030, almost 14% for France with a rough personnal calculation based on the numbers in the last Shift Project report.
ZAD Zen
I’m unsure how some kinds of depletion rates and levels will affect/support the lifestyle ostensibly required for ‘pseudorenewable’ buildout, if or however it makes any sense.
As a related aside, I’m also unsure many people realize the kinds of abject dehumanization (to say nothing of destruction) of industrialism in general, and with certain forms and concepts of ‘work’ and ‘lifestyle’. See also here.
Zone to Defend (Zone À Défendre)
Hey, you did the right thing of having backups. That’s more than some boards and blogs have that I’be been on. I’d never have noticed we had a technical glitch.
Kleiber,
Thanks for your understanding. I have increased backups to every 8 hours, though I will try to avoid playing with the website live. My son knows software better than me and informed me I need to create a test site that I play with and if I mess up, only the test site goes down, I will do this at some point.
I imagine those whose comments got lost/deleted are less happy, my sincere apologies to all of them, I will try to do better in the future.
Test sites are essential. Also remember two bits of wisdom:
1. If its not broken, don’t fix it.
2. If you can’t fix a bug, call it a feature.
Thanks Schinzy,
Wise advice, the website is feature filled. 🙂
This really makes sense. Ban drilling on Federal land, stop Keystone XL, try to shutdown Line 5, convince Exxon and Chevron to produce less oil so that the US can import more oil from friendly Russia. Guaranteed to reduce use of fossil fuels. 😕😕
“In the U.S., the biggest winner from President Joe Biden’s drilling moratorium is Russia. Bloomberg News reports that American imports of Russian crude and refined products continue to climb, reaching almost 750,000 b/d in March, (to put it in context, the US imported 110% more oil from Russia in March than from Saudi Arabia) according to Bloomberg using IEA data.
https://blog.pricegroup.com/2021/06/01/reopen-the-energy-report-06-01-2021/
Educate me Ovi. Your quote says that Bidens drilling moratorium makes Russia the big winner.
As far as I know, the moratorium is only for new wells on Federal land.
Is that a significant affect on USA production, or essentially no significant affect at all?
Dennis- thank you for all the work you do to keep this site up and running. Everyone who comes around is very appreciative.
Thanks Hickory,
I do my best, but will try to do better.
If you are already doing your best, then are you at ‘peak better’? ‘u^
One needs to be better than their best in order to improve.
And maybe a tad hyperbolic? ‘u^
Hickory
The impression I get is that a lot of LTO drilling is on Federal land. Twelve states are challenging Biden’s executive order. Louisiana is the lead challenger, followed by Alabama, Alaska, Arkansas, Georgia, Mississippi, Missouri, Montana, Nebraska, Oklahoma, Texas and West Virginia.
Maybe some US experts with direct knowledge could provide some additional info.
“Utah joined 12 other states in a lawsuit against the federal government challenging the Jan. 27 executive order issued by President Joe Biden to ban any new oil and gas leasing on federal land and offshore waters.”
https://www.deseret.com/utah/2021/3/24/22348725/utah-joins-a-dozen-other-states-in-lawsuit-over-oil-and-gas-leasing-ban-biden-environment-land
From what I see- the current leases held by oil and gas companies on Federal lands give them a good tens years of new drilling, if they continue at the rate of drilling on these leases over the last 5 years.
The Biden pause in new leases will not have any impact on USA production this decade.
Federal land fuel production leases expire in 10 years.
Hickory
Since you had all of that detailed information it would have been more appropriate to have posted it and updating my meager knowledge rather than asking me.
I am not an oil and drilling expert with deep knowledge and don’t pretend to be.
I didn’t find out that info until after your reply Ovi. I looked it up because I felt like the topic deserved some clarity, and the political spin on it left me wondering if there was also some truth in that blogspot claim. Frankly, I still don’t know much about the issue since I didn’t look too deep. Maybe someone else knows more.
Pardon the inconvenience sir.
Yea, thanks Dennis, not an easy gig, and very much appreciated.
Hightrekker,
You’re welcome.
I need to abide by the old adage, if it ain’t broke it don’t need fixin.
When I fix, I break. 🙂
Oil Prices Hit 2-Year High
Oil prices rose by 1 percent early on Monday, driven by expectations that recovering demand with summer travel and reopening economies will easily accommodate the gradual increase in OPEC+ production.
– The average retail price for gasoline in the U.S. jumped above $3 per gallon last week, the highest price since 2014.
– Memorial Day travel is expected to be 50% higher than the same weekend in 2020.
– California saw the highest prices at over $4 per gallon, while Texas saw the lowest at $2.72.
No increase from Russia over the past two month:
Russian oil and gas condensate output 10.45 mln bpd over May 1-30 -sources
“MOSCOW, May 31 (Reuters) – Russian oil and gas condensate output stood at 10.45 million barrels per day over the May 1-30 period, almost unchanged from 10.46 million bpd in April, sources familiar with oil statistics said on Monday.”
From 2 May:
“Russia is set to increase production by 114,000 barrels a day from May to July, ramping up evenly over the period, Novak said last month.”
Note that production was even higher in the beginning of April:
“Russian oil and gas condensate output increased to 10.52 million barrels per day (bpd) April 1-6, up from 10.25 million bpd on average in March, two industry sources familiar with data told Reuters.”
Russian production was down 23,000 barrels per day in May. Their production now stands at 10,453,000 barrels per day. 23,000 bpd is not much of an increase but they were expected to increase production as OPEC+ reduces pressure on members to keep production down.
OPEC still plan to increase production.
OPEC ups crude production as economies recover
OPEC meeting yesterday confirmed that OPEC will gradually increase output by 2.1 Mb/d over the June 1 to July 31 period, it will re-evaluate on July 1. It is not expected that increased output from Iran (if a deal is reached with US on nuclear program) will be a problem.
https://www.cnbc.com/2021/06/01/oil-opec-meeting-in-focus-amid-concerns-over-iranian-oil-supply.html
Oil prices rose on the news to as high as $71/bo for Brent crude, though the close was lower at about $70/bo. As I write this at 8 AM ET Brent futures are trading at about $71/bo.
See also
https://oilprice.com/Energy/Oil-Prices/Oil-Tops-71-As-OPEC-Keeps-Output-Plans-Unchanged.html
“OPEC will gradually increase output by 2.1 Mb/d over the June 1 to July 31 period, it will re-evaluate on July 1.”
But that implies (for example) that Angola must raise its production to 1.319 mb/d, see figure below. That will not happen.
Pollux,
Only the total output of OPEC+ matters from the World perspective, the numbers in that chart are guidlines, the larger producers can make up deficits from smaller producers if needed, I imagine if output is deemed too low on July 1, the targets will be adjusted. Angola produced about 1.1 Mb/d in April, the extra 200 kb/d can come from KSA, Iran, Iraq, UAE, Kuwait, or Russia, the 4 large OPEC producers as a group could likely raise output by 3 Mbpd over several months above April 2021 output levels, thus raising OPEC output to about 28 Mb/d of crude.
I would agree that OPEC will have difficulty matching the 2019 average output level of 29 Mb/d due to falling output from smaller OPEC producers (Algeria, Angola, Nigeria, and Venezuela in particular ).
Dennis,
“…the larger producers can make up deficits from smaller producers if needed…”
But everyone knows that it will be needed. Why not plan for it today if they want to raise production by 2.1 mb/d over the June 1 to July 31 period? Why wait until July 1?
Pollux,
They can only guess what demand will be in June, so on July 1 they will see how things look and adjust, all they can do really.
Is this ” And let loose ” The Dogs of War ” . Worrying .
https://www.zerohedge.com/geopolitical/massive-blaze-engulfs-tehran-refinery-just-hours-after-sinking-iranian-warship
”the 4 large OPEC producers as a group could likely raise output by 3 Mbpd over several months above April 2021 output levels.” I agree : ”could”. When I see the behavior of Saudis during the last months (supplementary cut of 1Mb/d in February, announcement of a plan to reduce the domestic oil consumption of 1Mb/j in March; decrease of their oil stock of 70-80 kb/d since one year), they do not give the impression of people knowing that they can increase their production.
Jean-Francois,
I think KSA was trying to get the market in balance quickly and push oil prices higher, they have accomplished that and will now proceeed to play the role of World swing producer and control the price of oil as long as the other OPEC+ nations play along and abide by the quotas. As oil prices rise it will be difficult to maintain discipline, but on the other hand we may have a situation soon (2021Q4) where all OPEC+ producers can produce at maximum sustainable output (a level that can be maintained for 12 months or more) and demand for oil will still not be met. Probably Brent oil price will need to be $80/bo minimum by the end of 2021 to match supply and demand for oil.
World food price index surges in May to highest level since 2011 -FAO
“World food prices rose in May at their fastest monthly rate in more than a decade, posting a 12th consecutive monthly increase to hit their highest level since September 2011, the United Nations food agency said on Thursday.”
If this trend continues, I think many OPEC+ countries oil breakeven prices will also increase.
I was just about to write the same quote. I did suspect food prices to start to rise but not this fast. This doesn’t bode well.
I don’t hear many complaints from people about the prime land going for corn ethanol production, but plenty of people saying that solar is unrealistic since it takes up too much land.
Well, I put some real world numbers to it-
The USA grows corn for ethanol (2019) on 36 million acres- the size of Iowa. All on prime farmland. The yield of 15.8 billion gallons of ethanol has an energy content of 1.2 Quads (quadrillion btu’s). That’s 1.2 Quads/yr.
If current day average USA utility scale photovoltaic was deployed on the same amount of acreage [except lets move it to land ranked very poor for agriculture and forest], the btu output for the year would be 40.9 Quads!
That’s right- 34 times as much energy output from the same acreage total.
For perspective, the USA end use total consumption of all energy is 69.7 Quads (latest data), and the transportation sector at 24.3 Quads is 35% of the total.
note- the equation is actually poorer for ethanol since a majority of the energy content of the fuel is lost during combustion, whereas with the electricity that is not the case.
“EVs convert over 77% of the electrical energy from the grid to power at the wheels (includes battery cycling losses). Conventional gasoline vehicles only convert about 12%–30% of the energy stored in gasoline to power at the wheels.”
but plenty of people saying that solar is unrealistic since it takes up too much land.
Oh for goodness sake Hickory. I have heard a lot of complaints about solar but the amount of land they take up has never been one of them. Yes, I have heard a lot of people talk about how much land solar would have to cover to be a factor, but the complaint was never about the use of the land, it was always about the unbelievable huge amount of solar panels it would take to do the job. An example:
Yeah, it would take enough solar panels to cover New Jersey. Can you imagine that many solar panels?
No I really can’t imagine all that Ron. Some of it.
I also cannot imagine 86 million barrels of oil. Today. And another 86 million tomorrow. Did you ever picture that many barrels in one pile?
And I also have trouble imagining the turmoil when 8-9 billion people end up without enough energy. For goodness sake.
I’m also having a real hard time imaging how people could look at the changing situation and somehow feel that the effort to adjust just isn’t worth it. I suppose it is a form of fear.
This is FAO for June 2021:
Many factors influence these global food price baskets. One is the price of energy- nat gas (fertilizer/pesticides) and oil,
This recent price rise is occurring without a significant oil price rise (yet) . The price of oil is roughly at the late 2004 level, and the food price is much higher than at that time.
And the food price rise is happening without any severe weather related crop failures (as far as I have heard).
Is this a hint of generalized inflation? Other items are going up in price as well.
I would assume that there are several factors at play here. First, “the energy arbitrage” is probably lower now than it was in 2004 because of increased use of biofuels nowadays. This should increase the volatility spill over effect across markets (i.e. the relationship between ag and crude oil prices). Secondly, I think that we will start to see that necessities will make up a growing part of household budgets when compared to discretionary consumption. This should increase price inflation of the former – at least if economic stimulus continues. In my view this is a result of biophysical resource constraints and I do think that our current (neoclassical)economic models are poorly designed to guide us from here on.
There could also be some financial speculation involved. But, this is often short term so it usually do not have as big impact on the price direction as it is sometimes blamed to have.
Jeff,
In my view this is a result of biophysical resource constraints
You mean peak agriculture? Peak food? Can you elaborate please.
The problem is that this view is biased. Indeed, in past, a farmer could feed 1,5 people including him. Thus, food was costly. Industrial agriculture had had the result to make collapse the price of food. You must prepare yourself to the idea that in a not so far future, food will be more costly.
You have people jogging/running around the blocks burning calories in a sort of useless way after spending much of the day doing relatively-sedentary, even useless jobs, brought on by a pseudoeconomy based on surplus energy from FF’s.
So, over time, as the FF’s deplete/are reduced, maybe many of the relatively-useless/sedentary FF-created/supported jobs/activities will be replaced with more people doing farming and other local/classic/domestic, self-empowering and real/local community-empowering kinds of work, which can be good exercise, reducing the ‘necessity’ to jog/run around the blocks.
Of course, what we can grow/make locally is also imported from overseas or far away, so there is redundancy and additional, wasteful draws on that surplus FF energy. But it’s surplus energy, so who cares! Maximum power and plunder!
And then there’s that large drawdown of resources in the face of energy surplus, compared with walking or biking, known as the car. Think of how many drive around completely alone, dragging all that metal, glass, rubber and plastic around on the planet’s dime. Hilarious! Get out and try to push it home. Good exercise. Relatively-useless, but good.
We didn’t bargain for a non-real-time energy surplus battery in the way of FF’s, but if or as we experience decreasing energy surplus, so we may draw down less upon the planet. In this sense, too, I’m unsure that non-renewable renewable energy harvesting technologies will be very good for us if it presents us with still relatively-ample energy to continue on with overscaled wastes and drawdowns. That’s unless we can learn to rein it in. But a continued interest in such things as single-occupant large electric cars for everyone on an overpopulated world full of parking lots and freeways over valuable farmland seems to suggest otherwise.
The 2 of the 5 highest price growth sectors are oil (crop) followed by cereal crops.
Oil crops like soy and palm, and ethanol crops like corn and sugar cane, directly complete with cereal crop acreage planted.
The percent of harvest globally devoted to biofuel has increased rapidly over the past two decades. Often this is prime crop/forest land.
Since this biofuel sector uses a lot of great farmland, it removes cropland and product from the food sector (and forest).
This raises the price for foods.
Example- the USA is the largest corn producer in the world, and about 40% of the corn acreage is for ethanol production. This provides roughly 1 mbpd fuel. Any updated figures on this would be appreciated- mine are a few years old.
Who decides if the land use is appropriate?
Part of it is the market- a generally dysfunctional mechanism at such large and international scale.
Part of it is government policy in the form of mandates and incentives.
The world could come up with a lot more food if biofuels and meat consumption/capita were scaled back.
Well, it is a theoretical possibility to reduce meat consumption and biofuels to increase the amount of calories available for humans. However, this slightly misses the point and it is as likely to happen as all countries voluntarily steep up to mitigate climate change. It is more profitable for the farmer to grow crops for biofuel than feed the poor. However, it could also be that it is not profitable to grow food for the poor. Look at the situation back during the depression, people were hungry at the same time as land prices were low, underutilized and farms closed down.
Ag products trade on global markets so undernourished people in developing countries compete with SUV users in developed countries. In my view, the short and medium term problem is not that food and fuels will cost slightly more in rich countries but that it will be a lot more costly for the poor compared to what they can afford.
If the standard economic textbooks would work then this would be a temporary situation because higher prices should result in more supply, changed consumption and thus lower prices (temporary price discovery, prices reverts back to mean after a while). Also, the cost share of energy and food used to decline, this was the long term trend from the start of the industrialisation. But take a look at oil, crop prices and a lot of other commodities too. There was a trend break around 2000-2005 when their costs started to rise. As I wrote before, I think this is due to biophysical constraints from a finite planet imposed on an expanding global economy. Oldie but Goldie: https://www.americanscientist.org/article/the-rising-cost-of-resources-and-global-indicators-of-change
Very good points Jeff, and the article well worth reading.
Since the index was rebaselined 130 looks like it might be the threshold when Arab Spring like things might kick off (previously 220), which means it could be happening about now. Maybe Gaza, Myanmar, Chad Thailand etc. might all have some aspect of food prices in their ultimate cause which could escalate and spread.
https://carnegieendowment.org/publications/interactive/protest-tracker
Surprise weekly US production number. What info does the EIA have that would make them drop the weekly production number by 200 kb/d to 10,800 kb/d. Wondering if it could be related to the continuing drop in NGPLs over the last 4 weeks, see second chart.
Ovi,
It occurs to me that a centered 4 week average might track the monthly data a bit better.
Chart below has weekly centered 4 week average (I use week 2 as the center) and monthly data for US C plus C. When viewed in this way, the weekly data (as a centered 4 week average) has been pretty good for CplusC.
Dennis
Looks good but May 2020 is a total miss.
Ovi,
Agreed. I think the weekly estimates are largely based on STEO, which often misses big changes such as the steep drop due to the pandemic shutdown of April to June 2020, so I give them a pass on that.
NGPLs
Dennis
Thanks for reminding me. When I last posted this chart I noted that the May NGPLs weekly output was the same as the monthly February 2021 output. I think it has been put in later to get the yearly average right since the NGPL numbers for February are wrong. Can’t think of any other reason.
Thanks Ovi,
Looks like a similar problem in July/August 2020, the weekly NGPL numbers are even worse than the C plus C weekly estimates. 🙂
Ovi,
You should includ the monthly numbers for NGPL. The weekly data for the past few weeks for NGL is likely crap and should be ignored imo.
Monthy US NGPL (kb/d) from
https://www.eia.gov/dnav/pet/hist/LeafHandler.ashx?n=PET&s=M_EPL2_FPF_NUS_MBBLD&f=M
Enjoy it while it lasts .
https://www.worldoil.com/news/2021/6/3/opec-leaders-mock-iea-s-la-la-land-2050-net-zero-roadmap
Chevron on Cdn Oil Sands
Not much capital required.
“The oil producer’s stake in Canadian Natural Resources Ltd.’s Athabasca oil sands project generates “pretty good cash flow” without needing much capital “but I wouldn’t deem it a strategic position,” Wirth said at Bernstein’s 37th Annual Strategic Decisions Conference”
https://www.worldoil.com/news/2021/6/3/chevron-open-to-sale-of-canadian-oil-sands-stake-to-meet-green-goals
The Alberta Energy Regulator (AER) released its annual 2021 Alberta Energy Outlook this week, outlining key highlights from 2020, and its forecast for the province’s energy patch going forward.
https://www.oilsandsmagazine.com/news/2021/6/4/key-highlights-2021-aer-alberta-energy-outlook
Every June BP releases its World Statistical Review for the year. On a tablet and unable to find the exact day upcoming. This will be the definitive information on 2020
Watcher
Last one was June 18, 2020.
Is this significant?
https://theintercept.com/2021/06/01/texas-subsidies-oil-companies/?utm_medium=email&utm_source=The Intercept Newsletter
Schinzy,
Interesting, thanks. I imagine the effect of these moves would be higher refining costs that are passed on to consumers for gasoline and diesel and jet fuel. In the case of LNG projects, this may result in US natural gas not being able to compet on World markets, the gas will need to remain in North America and we might see natural gas production go down if shale gas production becomes unprofitable.
Thanks for your thoughts Dennis. We will see.
https://www.cnbc.com/amp/2021/06/04/climate-russia-saudi-arabia-reject-calls-to-end-oil-and-gas-spending.html?__twitter_impression=true
New posts are up
https://peakoilbarrel.com/annual-reserve-revisions-part-iii-larger-independents/
and
https://peakoilbarrel.com/open-thread-non-petroleum-june-5-2021/