EIA’s Electric Power Monthly – June 2019 Edition with data for April

A Guest Post by Islandboy

chart/

chart/

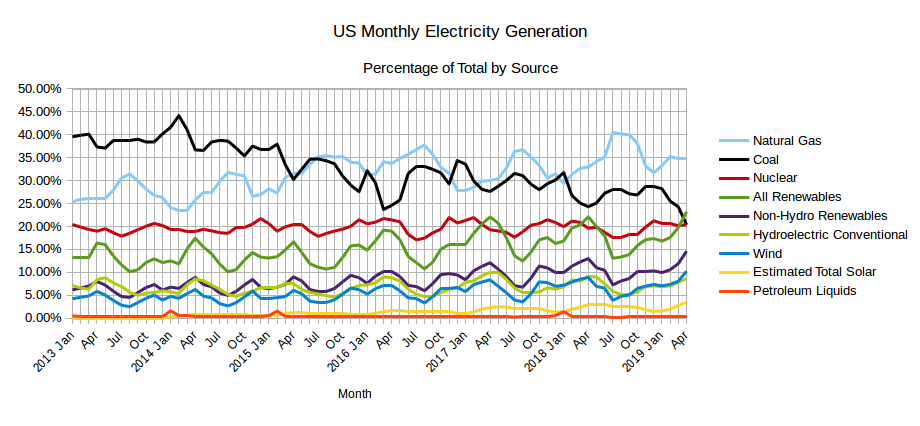
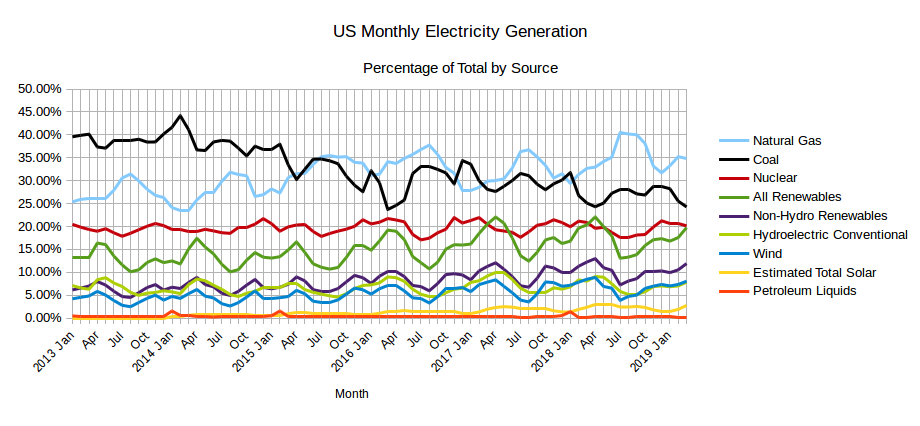
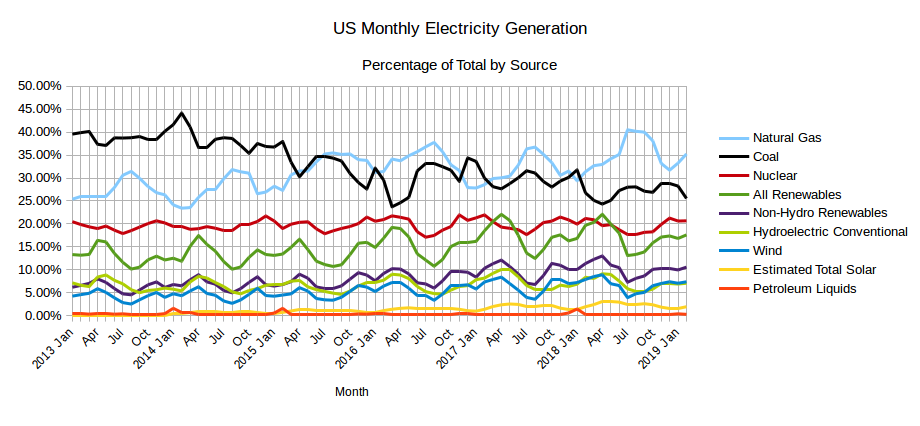
The EIA released the latest edition of their Electric Power Monthly on June 25th, with data for April 2019. The table above shows the percentage contribution of the main fuel sources to two decimal places for the last two months and the year 2019 to date. As was projected by the EIA in their Short-Term Energy Outlook in April (reported here), the contribution from All Renewables exceeded that from Coal for the first time ever. The EIA featured this news on their Today in Energy page on June 26th, the day after the data was published. Read More

World Oil Production, February 2019 Data.

The data for the charts below are from the EIA’s Monthly Energy Review. I will update this post Friday, May 31st with March data for the USA and charts for several states when the EIA’s Petroleum Supply Monthly is published. All data is through February 2019 and is thousand barrels per day.

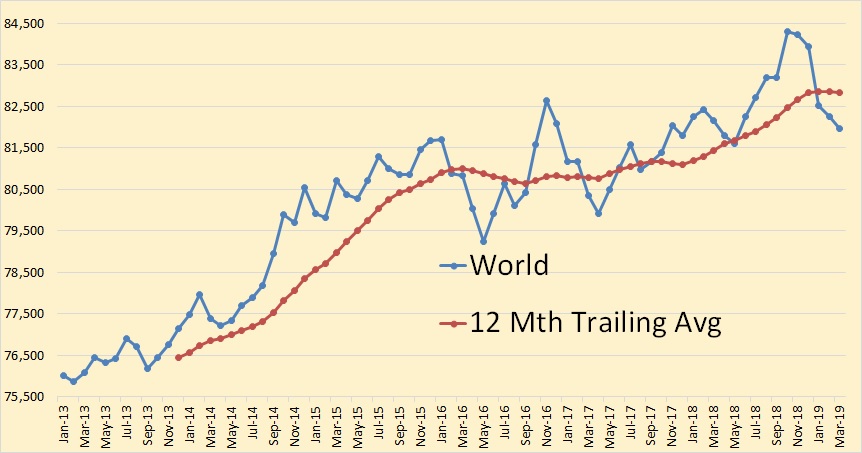
World C+C production was down only slightly in February, dropping only 87,000 barrels per day to 82,389,000 bpd.

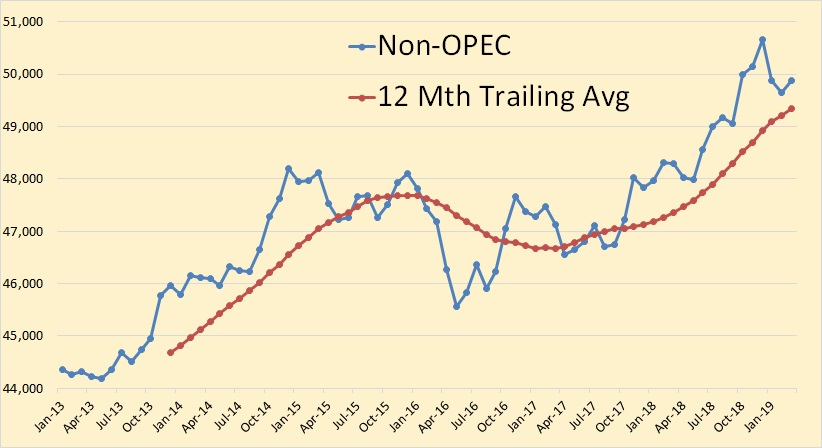
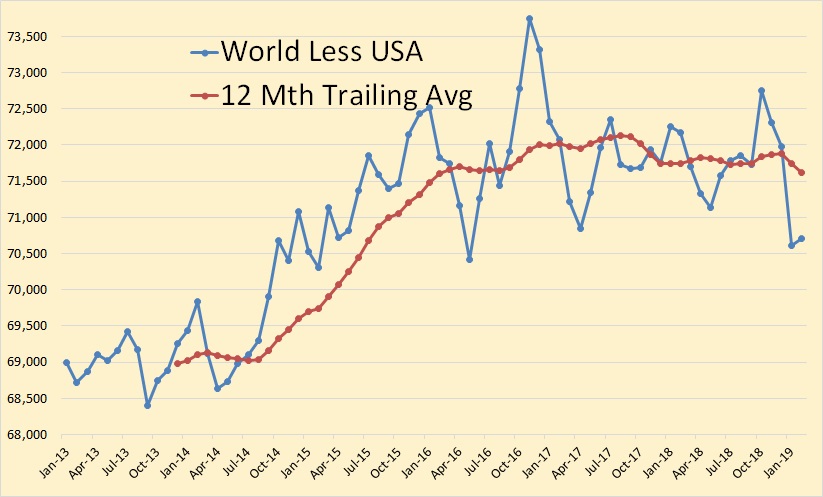
It is my contention that World, less USA peaked in November 2016 with the 12 month average peaking in 2017.

Read More