Petroleum Supply Monthly, Texas C+C estimate, Permian, and Eagle Ford

This post was written by Dennis Coyne and does not necessarily reflect the opinion of Ron Patterson.

I have considered an alternative way of estimating Texas oil (C+C) output using the Drilling info data provided in the EIA’s 914 monthly production reports.

TX/

The Texas estimate is a weak part of the EIA’s estimate for US C+C output. In the chart above I show the EIA’s most recent monthly estimate from the Petroleum supply monthly and compare with an alternative estimate that substitute’s my best estimate for EIA’s TX C+C estimate. The slope of the trend line needs to be multiplied by 366 to give the decline at an annual rate, for the EIA estimate it is 528 kb/d per year, and for the alternative estimate it is 364 kb/d per year. Read More

Texas Oil and Natural Gas- June 2016

Dean has shared his estimates for Texas Oil and Natural Gas output. Texas (TX) C+C output was revised lower by -10, -17, -22, -18, and -52 kb/d for Nov 2015 through March 2016 respectively. Output in April 2016 increased by 27 kb/d from the revised March 2016 estimate to 3511 kb/d. The EIA estimate for March 2016 is 3276 kb/d, and Dean’s revised estimate is 3484 kb/d, 208 kb/d more than the EIA estimate.

TXchart/

Read More

Texas Oil Production Still on a Plateau

The Texas RRC Oil and Gas Production Data is out. There appeared to be no decline in December production and may have even been a slight increase. 

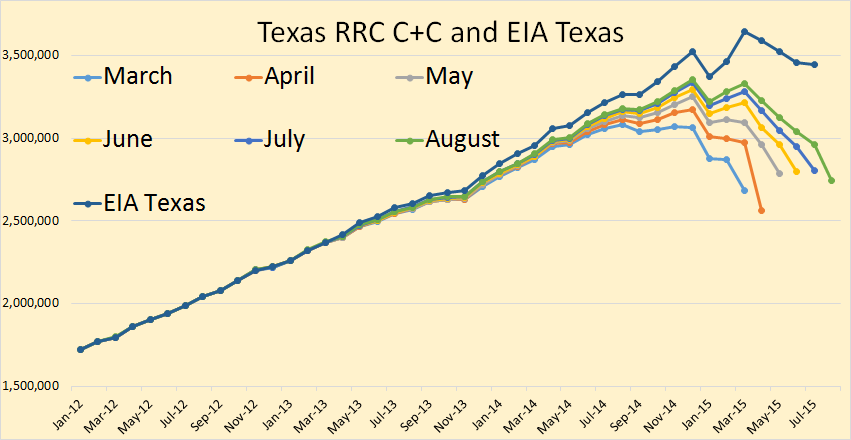
The Texas RRC data is incomplete and only gives an indication as to whether Texas production increased or decreased. The data appears to droop because each month the the Texas Railroad Commission receives a little more data and the totals increase, little by little, month by month, until after many months the data is complete.

In my charts I post the past six months of data in order to give some indication as to whether production is increasing or decreasing. The final data is through December and the EIA data is through November.

Texas C+C

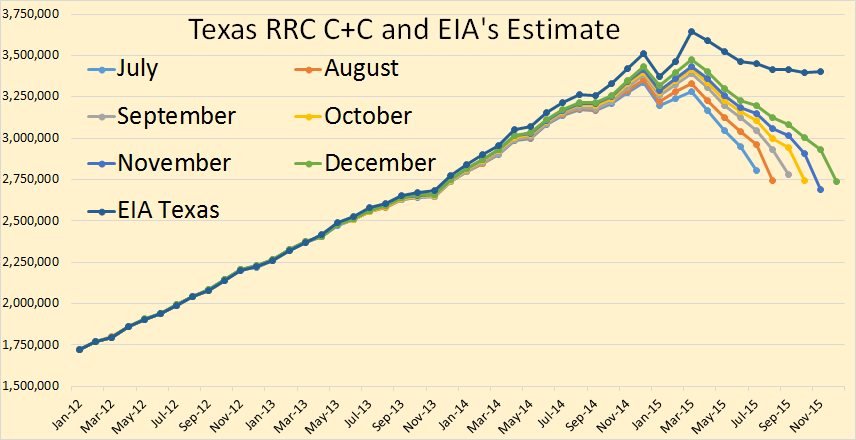
Texas crude plus condensate declined a little in November but seemed to make up that decline in December. Total Texas C+C seems to be on a flat plateau, declining in Eagle Ford but making up that decline in the Permian and the rest of Texas.

The EIA estimates the final Texas data through November. They have Texas peaking in March and down about a quarter of a million barrels per day since that point.

Read More

Texas RRC Oil and Gas Production Data

The Texas RRC Production Data is out. There appear to be no big surprises this month. All RRC data is through September but the EIA data is only through August.

Note: For all those not familiar with the Texas Railroad Commission data it is always incomplete. That is the reason for the drooping data lines you see in the charts. The EIA data is what they believe the final estimate will be.

Texas C+C

Final month production was just a little higher in September than August. That usually indicates a small uptick in production. But the data is so incomplete it is hard to tell.

Read More

Texas Oil and Gas Decline in August

The Texas RRC Oil and Gas Production Data with production data for August is out. 

Texas C+C

The RRC data is always incomplete but if this month’s incomplete data is less than last month’s incomplete data then that’s a pretty good indicator that production this month is down.

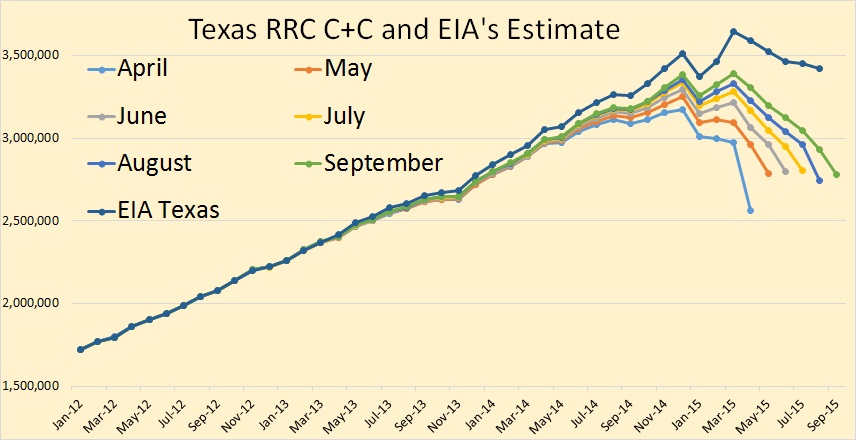
The EIA data here is only through July. They have Texas production peaking in March at 3,644,000 barrels per day and declining by 197,000 bpd to 3,447,000 bpd in July.

Read More