Texas RRC November Production Report

The Texas RRC Data Base came out a few days ago. The data is reported through September but of course it is incomplete. The data from the field comes in very slow in Texas and the RRC only reports the data they receive. All data is through September and is in barrels per day.

Texas Crude Only

Crude only has shown a slight downward trend for the last two months. After revision, when the final data comes in, production will likely still be up slightly but if this is any indication, it will be up less than in months past.

Texas Condensate

Texas condensate production started a dramatic slowdown in June of 2013. It actually declined three months in a row, June, July and August of 2013 but then started to recover. But production growth has slowed since that date.

Read More

The EIA’s Petroleum Supply Monthly

The EIA has just published their Petroleum Supply Monthly with US production, and other data, for July 2014. US C+C production fell by 3,000 barrels per day in July.

US C+C

After a big leap in April things have slowed down considerably in the last three months. US production in July was 8,537,000 barrels per day

UA Big Picture

This is US production since 1920. We are just over 1.5 million barrels per day below the monthly high of 10,044,000 barrels per day of in November 1970.
Read More

Texas RRC Data September Report

The Texas RailRoad Comission released their Oil & Gas Production Data with production data through July 2014. The data was actually released Thursday but was all messed up. They corrected their mistake Friday except for condensate. Then yesterday they updated everything. As I have stated before, the RRC data, for the last several months, is incomplete. Nevertheless we can gather some indication of what is happening.

Texas C+C

Texas C+C is still increasing at a pretty hefty clip. The EIA data is just an estimate of course but I think it is pretty close to what the data will show when it is all in. I have included six months of data to show how it is increasing month to month.

Texas Crude Only

Texas crude only was down in October and November but has been up every month since. The declines in the last few months is due to incomplete data.

Read More

Texas RRC Oil and Gas Data

The Texas Rail Road Comission has has released their production numbers for March. The data is always incomplete and the most recent data is always the most incomplete. Nevertheless one can glean quite a bit from the data even though it is incomplete.

Texas Crude Only

The May Report has data through March, April through February and the March report has data through January. You can see from this chart how Texas upgrades their data as data comes trickling in.

Texas Condensate

I looks like Texas condensate has peaked. May 2013 is the peak so far. October 2013 is creeping up but I don’t think it will overtake May. Regardless of whether May will be the ultimate peak or not there is no doubt that there has been a dramatic slowdown in Texas Condensate production.

Read More

EIA’s Petroleum Supply Monthly by State, Texas Reporting Problems

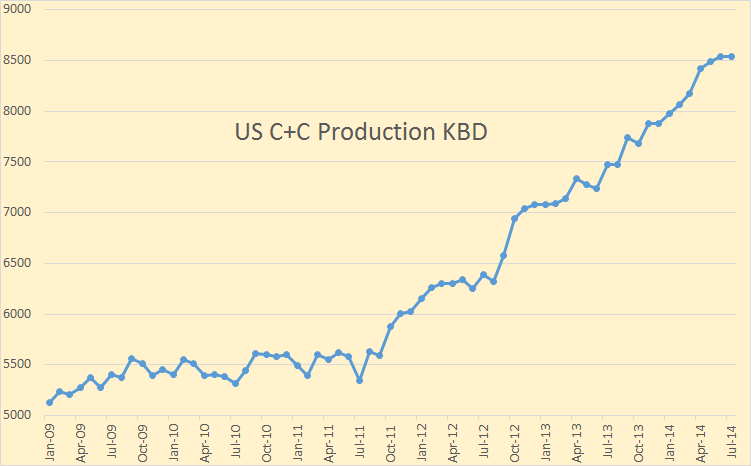
The EIA releases two monthly petroleum data sets for US oil production. The Monthly Energy Review which gives the US production and consumption of all forms of energy, oil, natural gas, coal and electricity.  The other, the Petroleum Supply Monthly deals only with petroleum but gives every possible statistic, production, refining, export and import from every state and district.

Concerning total US crude oil production the two should agree but they don’t. From December 2011 back they have the exact same production numbers but the near months differ greatly. I have found that the latter, the Petroleum Supply Monthly is the most accurate. The Monthly Energy Review usually changes their numbers to match the Petroleum Supply Monthly but both revise their numbers as more accurate numbers come in. They both are published the last week of the month but  the M.E.R is always a month ahead with their data.

Here are their the numbers in KB/d and the difference between the two.

Difference 3

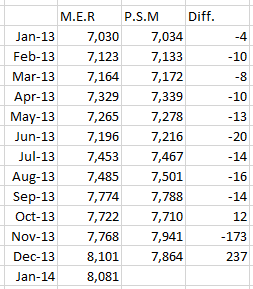
Notice that the former had US production up by 333 kb/d in December while the latter had US production down by 77 kb/d in December. But both will be revised to match what each state or pad reports later on.

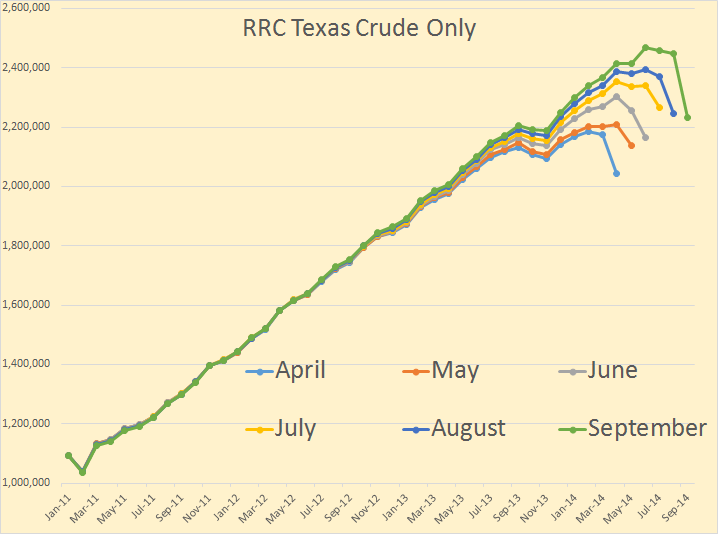
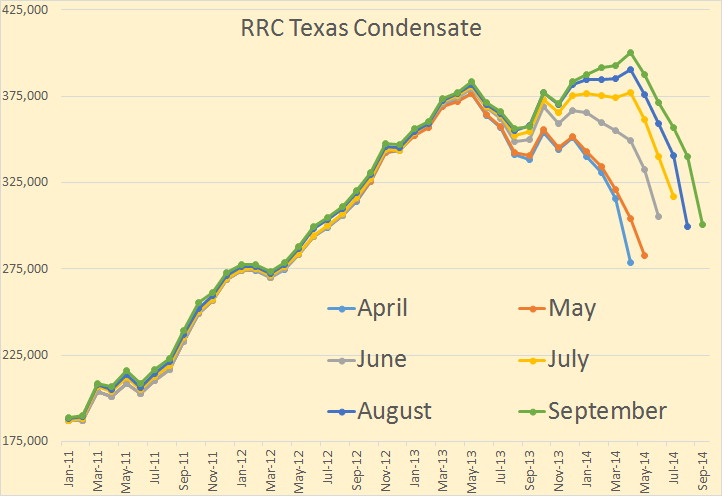
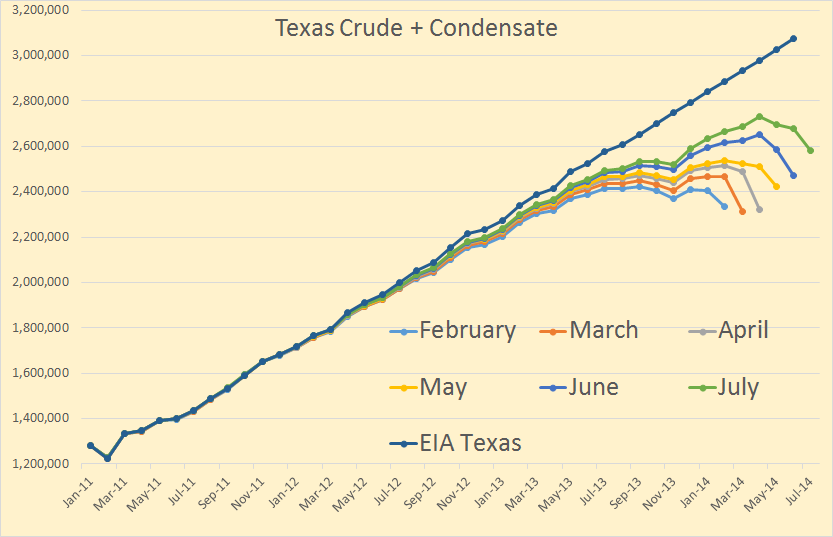
There is no uniform reporting strategy among different states. They all appear to do it differently and on a different time frame. For instance the PSM, which is the only one of the two that reports state by state production number, reports the exact same numbers for North Dakota that we get from North Dakota. But they get their Texas data from the Texas Rail Road Commission. And the Texas RRC is very delinquent with their reporting. They just report the numbers as they come in from the field and every month they change as more numbers come in, sometimes taking many months until all the numbers are in. So the EIA just guesses at Texas production numbers.

Texas and North Dakota daily C+C production in KB/D. The last data point is December 2013.

Texas + North Dakota

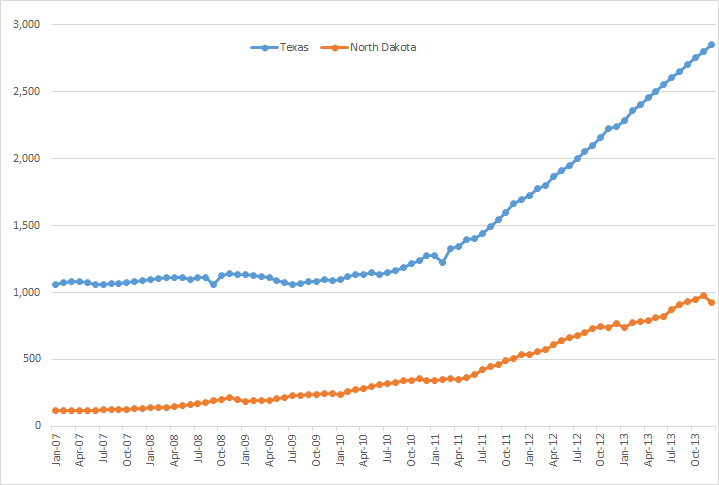
Notice the last nine months are extremely linear. In fact each month, April through December, Texas monthly crude production increased by exactly 50,000 barrels per day.
Read More