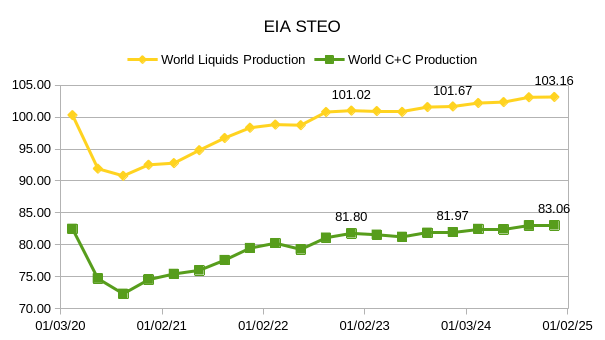
The EIA’s Short Term Energy Outlook (STEO) was published in early May. The report that follows compares World Petroleum Liquids output from the STEO with estimates from OPEC’s Monthly Oil Market Report (MOMR) from May and the IEA’s Oil Market Report (OMR) from February 2023 with an update on World liquids output based on the summary of the May report with my estimate on quarterly output in 2023 based on the annual estimate for 2023 published in May 2023 and the quarterly numbers published in February 2023.
The EIA updated the Short Term Energy Outlook (STEO) in March and also released the 2023 version of the Annual Energy Outlook in March. This post will take a brief look at both of these reports with a focus on Crude plus Condensate (C+C) Output for the World, OPEC and Non-OPEC in the case of the STEO through the fourth quarter of 2024 and US C+C output for three oil price cases from 2022 to 2050, reference (medium oil price), high and low oil price cases.
The Short Term Energy Outlook (STEO) was published by the US Energy Information Administration (EIA) on February 7, 2023. For most nations except the US and total OPEC crude oil output the forecast for future production is for total liquids only. In this month’s post I will try to estimate the crude plus condensate (C+C) output indicated by the STEO total liquids estimate for the top 10 non-OPEC producers and the World minus the top 10 non-OPEC producers. I will focus on quarterly output so that we can compare with recent OPEC estimates for World supply and demand in 2023. The estimate for C+C uses historical output of both C+C and total liquids and uses the average of the ratio of C+C to total liquids for the past 12 quarters (2019Q4 to 2022Q3) for the top 10 non-OPEC producers (except the US where a C+C forecast is provided) and for the World minus the top 10 non-OPEC producers. In most of the charts that follow the units on the vertical axis are kb/d of C+C output.
The US EIA Short Term Energy Outlook (STEO) was published on January 10, 2023. This report generally provides forecasts for Total Liquids production for non-OPEC nations, crude only output for OPEC nations, and both C+C and Total Liquids forecasts for the US. At Peak Oil Barrel we focus on crude plus condensate (C+C) output as this is the critical input that provides most of the World’s liquid fuels used for land, air and water transportation. The STEO also provides forecasts for natural gas and electricity output as well as price forecasts for oil, natural gas, and electricity. This post will focus on oil (both total liquids and C+C).
We find the OLS trend in the ratio of C+C divided by total liquids for non-OPEC minus the US over the period from October 2014 to September 2022 (it has been decreasing at an annual rate of 0.267% over that period) and we assume the trend continues from October 2022 to December 2024 (the end of the STEO forecast). This allows us to estimate non-OPEC minus US C+C. Likewise we find the ratio of OPEC crude to C+C which was relatively flat at about 93.7% from Jan 2010 to December 2019 and seems to be returning to this level since the depths of the pandemic. By assuming the ratio is 93.7% crude to C+C for OPEC we can estimate OPEC C+C from October 2022 to December 2022 using the STEO crude only estimate. The non-OPEC minus US C+C estimate is added to the STEO US C+C estimate and this is combined with the OPEC C+C estimate to find the World C+C STEO forecast.
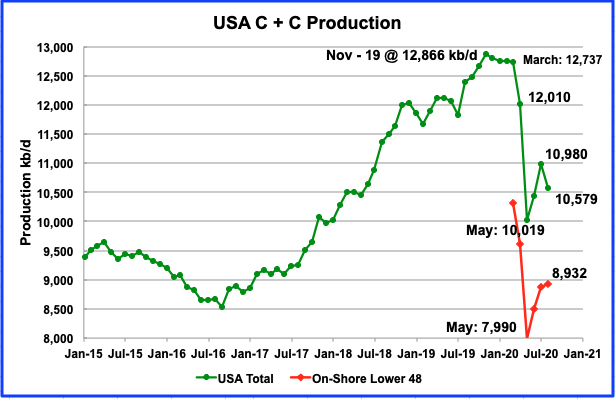
All of the oil (C + C) production data for the US state charts comes from the EIAʼs Petroleum Supply monthly PSM. After the production charts, an analysis of three EIA monthly reports projecting future production is provided. The charts below are updated to August 2020 for the 10 largest US oil producing states.