The EIA recently released its International Energy Outlook and it is quite optimistic. In the chart below I compare their estimate for World Crude plus Condensate (C+C) output with an oil shock model with a URR of about 3100 Gb.
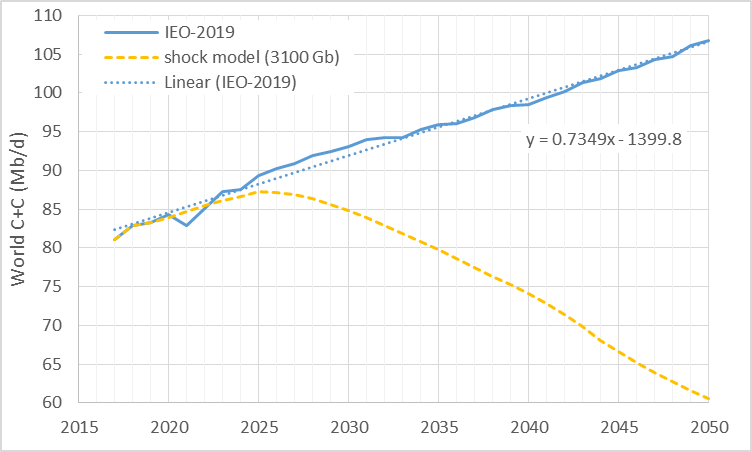
The EIA recently released its International Energy Outlook and it is quite optimistic. In the chart below I compare their estimate for World Crude plus Condensate (C+C) output with an oil shock model with a URR of about 3100 Gb.
This is a guest post by Dennis Coyne.
The views expressed do not necessarily reflect the views of Ron Patterson.

The eventual peak in World fossil fuel output is a potentially serious problem for human civilization. Many people have studied this problem, including Jean Laherrere, Steve Mohr, Paul Pukite (aka Webhubbletelescope), and David Rutledge.
I have found Steve Mohr’s work the most comprehensive as he covered coal, oil, and natural gas from both the supply and demand perspective in his PhD Thesis. Jean Laherrere has studied the problem extensively with his focus primarily on oil and natural gas, but with some exploration of the coal resource as well. David Rutledge has studied the coal resource using linearization techniques on the production data (which he calls logit and probit).
Paul Pukite introduced the Shock Model with dispersive discovery which he has used primarily to look at how oil and natural gas resources are developed and extracted over time. In the past I have attempted to apply Paul Pukite’s Shock Model (in a simplified form) to the discovery data found in Jean Laherrere’s work for both oil and natural gas, using the analysis of Steve Mohr as a guide for the URR of my low and high scenarios along with the insight gleaned from Hubbert Linearization.
In the current post I will apply the Shock model to the coal resource, again trying to build on the work of Mohr, Rutledge, Laherrere, and Pukite.
Read More
This is a guest post by Dennis Coyne
Originally posted at peak oil climate and sustainability
Some changes have been made to this post see after the Excel File link. Below figure 10.
The Oil Shock Model was first developed by Webhubbletelescope and is explained in detail in The Oil Conundrum. (Note that this free book takes a while to download as it is over 700 pages long.) The Oil Shock Model with Dispersive Discovery is covered in the first half of the book. I have made a few simplifications to the original model in an attempt to make it easier to understand.

Figure 1
In a previous post I explained convolution and its use in modelling oil output in the Bakken/Three Forks and Eagle Ford LTO (light tight oil) fields. Briefly, an average hyperbolic well profile (monthly oil output) is combined with the number of new wells completed each month by means of convolution to find a model of LTO output.