Texas RRC Oil and Gas Production

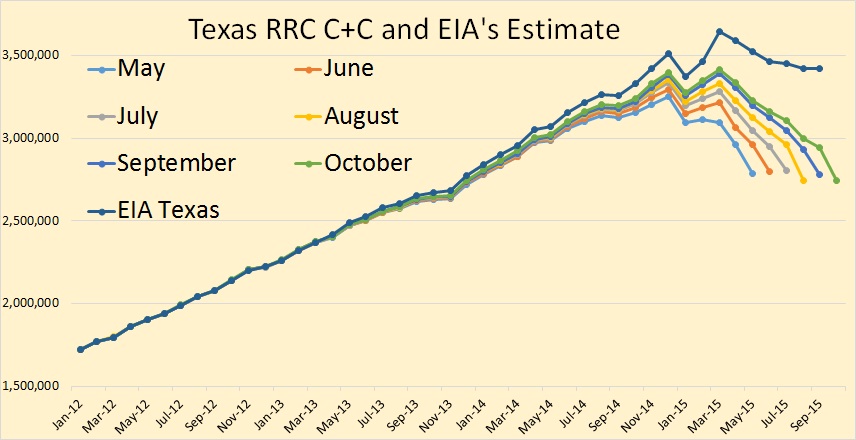
The Texas RRC Oil and Gas production data is out. All the RRC data below is through October 2015 and all the EIA data below is through September 2015.

Important: All the Texas RRC data is incomplete, especially the latter months. They will be revised upward as the Texas RRC gathers more data. The EIA data is what the EIA expects the final data will look like.

Texas C+C

The RRC Crude + Condensate data for October shows a slight decline in October. The EIA says Texas C+C was flat, August to September.

Read More

EIA Says Shale Continues to Decline

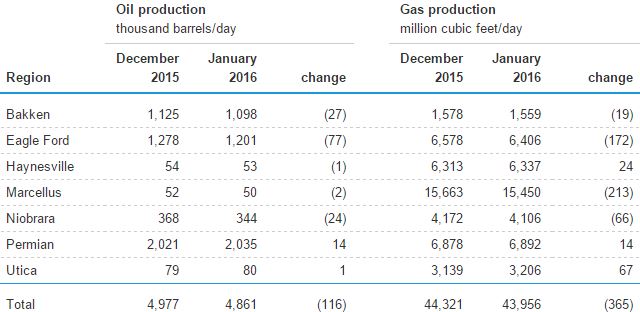
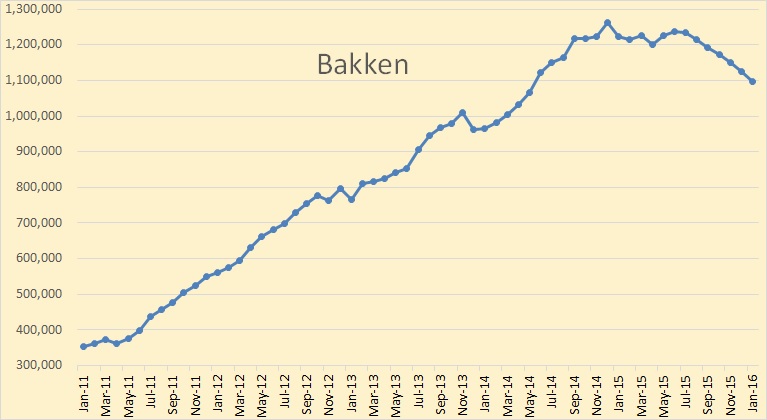
The EIA’s Drilling Productivity Report has US shale oil on a steep decline. The below shale oil production charts are the EIA’s estimate of what shale production will look like through January 2016. Keep in mind this is the EIA’s estimate and not hard production numbers.

DPR Totals

The big drops here are Eagle Ford, Bakken and Niobrara. They have the Permian still increasing in production. An expected drop of 116,000 barrels per day drop in January is very significant.

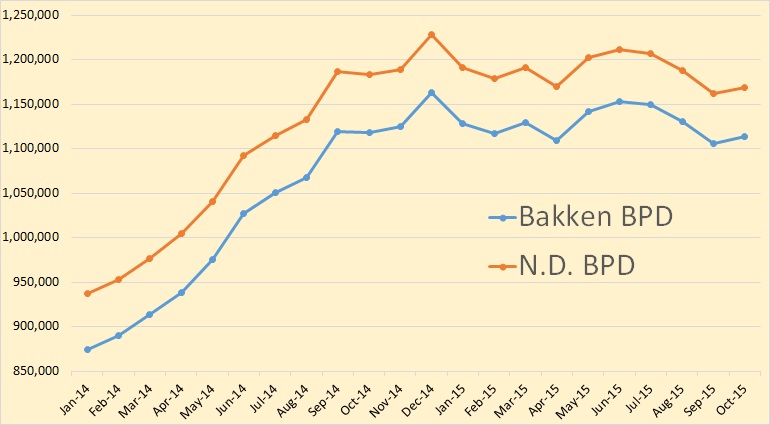
DPR Bakken

They have the Bakken in a continual decline after July. It is important to note that the EIA’s Drilling Productivity Report has the Bakken decline, July thrugh September, very close to what the North Dakota Industrial Commission has. So it appears that the DPR is getting better with its production estimates.

Read More

US Oil Production by State

The EIA’s Petroleum Supply Monthly is just out with production numbers, through August, for each state and offshore territories. The EIA’s Monthly Energy Review is also out. This publication has US production data through September but not for individual states.

US Total C+C

The Petroleum Supply Monthly June 15 production numbers were revised down considerably this month. And you can see they had a drop of 169,000 bpd in September. I think there will likely be an even larger drop in October. At any rate US production is finally starting to drop significantly.

Read More