World Oil 2018-2050: World Energy Annual Report (Part 2)


A guest post by Dr. Minqi Li, Professor

Department of Economics, University of Utah
E-mail: minqi.li@economics.utah.edu

July 2018

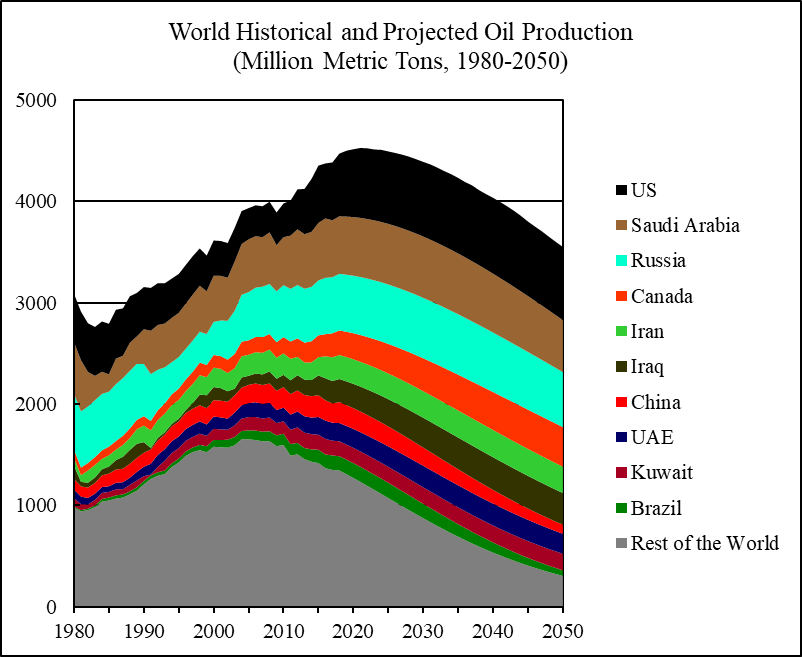
This is Part 2 of the World Energy Annual Report in 2018. This part of the Annual Report provides updated analysis of world oil production and consumption, evaluates the future prospect of world oil supply and considers the implications of peak oil production for global economic growth.
chart/

(See Figure 18 near end of paper) Read More
OPEC June Production Data

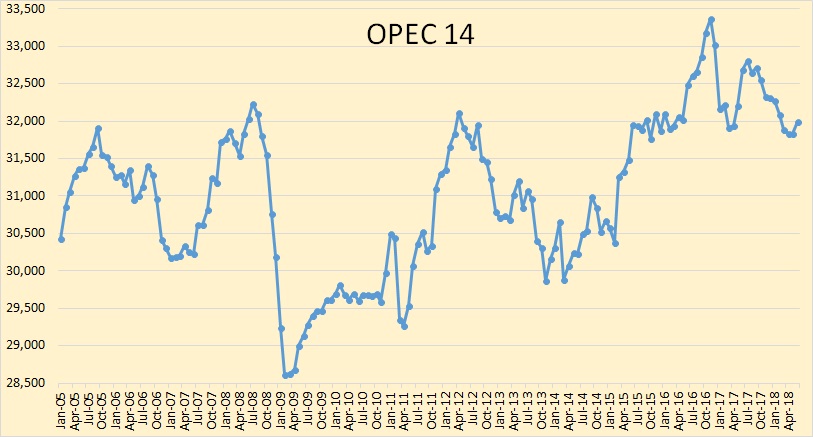
All data below is from the OPEC Monthly Oil Market Report. All data is in thousand barrels per day and is through June 2018.

The Republic of the Congo was added to OPEC this month. The data below does not reflect that addition. I will try to add them next month.

OPEC 14 production was up 161,000 barrels per day in June. That does not include the Congo which was up 12 kbpd.

Notice: This is The Republic of the Congo, a much smaller nation than the DRC, or The Democratic Republic of the Congo.

May OPEC production was revised down 39,000 bpd. Saudi Arabia was revised up 28,000 bpd, Qatar was revised up 17,000 bpd while Nigeria’s May production was revised down 79,000 bpd.

Read More

OPEC April Production Data

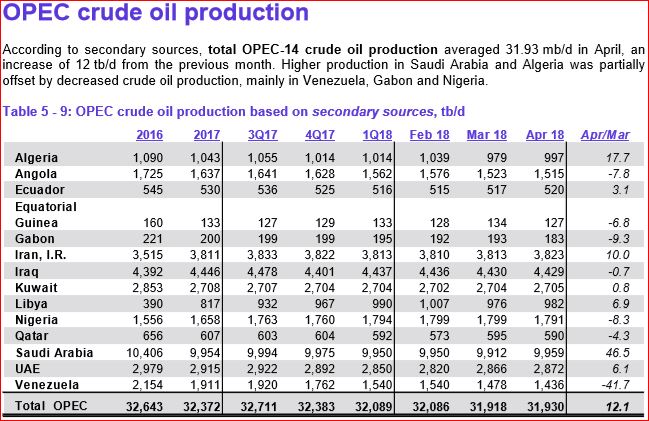
The OPEC charts below were created with data from the OPEC Monthly Oil Market Report. The PDF File can be downloaded from here: OPEC MOMR All OPEC data is through April 2018 and is in thousand barrels per day.

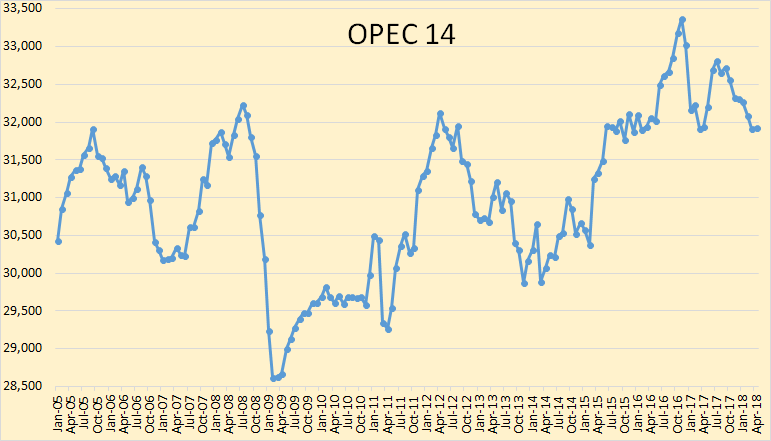
There was little change in OPEC production in April.

OPEC production was  up 12,000 barrels per day in April but that was after February production had been revised down by 74,000 bpd and March production revised down by 39,000 bpd.

Read More