All OPEC data for the charts below are from the OPEC Monthly Oil Market Report https://momr.opec.org/pdf-download/

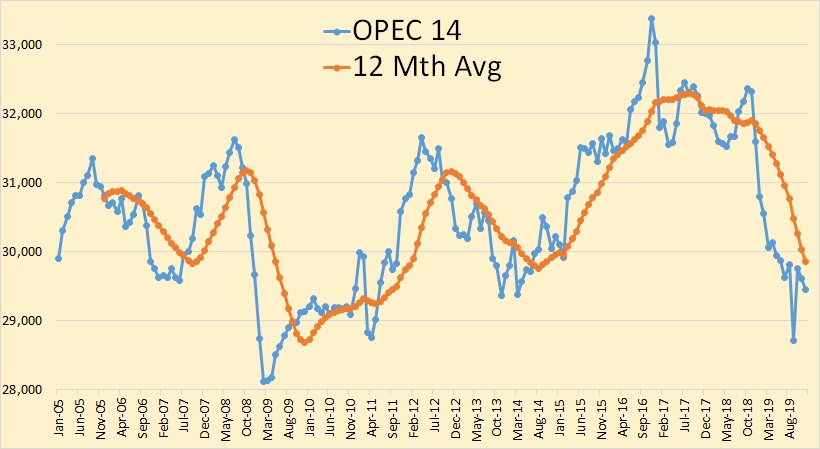
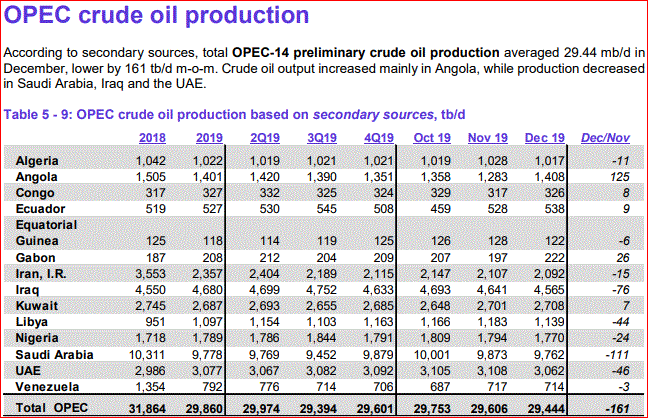
OPEC crude oil production continued to slide in December.

All OPEC data for the charts below are from the OPEC Monthly Oil Market Report https://momr.opec.org/pdf-download/

OPEC crude oil production continued to slide in December.

The OPEC data for the charts below are from the OPEC Monthly Oil Market Report.
and is thousand barrels per day.
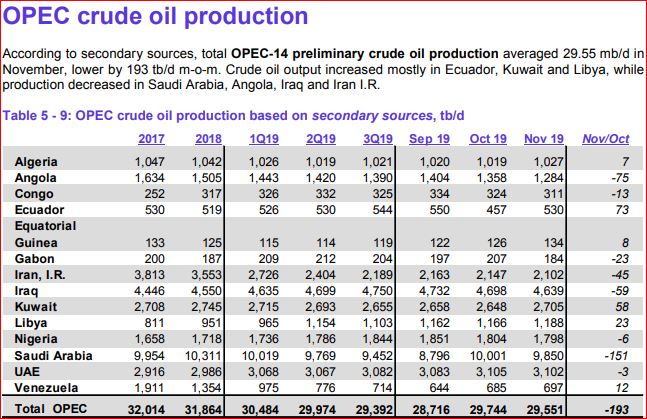
OPEC 14 was down 193,000 barrels per day in November but that was after October production had been revised up by 94,000 bpd.


OPEC 14 bounced back from last month’s decline. And there were major revisions in the September data. Saudi Arabia’s September production was revised up 232,000 bpd, Nigeria’s production revised up by 96,000 bpd and OPEC 14 September production was revised up by 316,000 bpd.
Read MoreThe following June OPEC data is based on the latest July OPEM Monthly Oil Market Report and is in thousand barrels per day.

OPEC 14 crude only production was down 68,000 barrels per day in June.

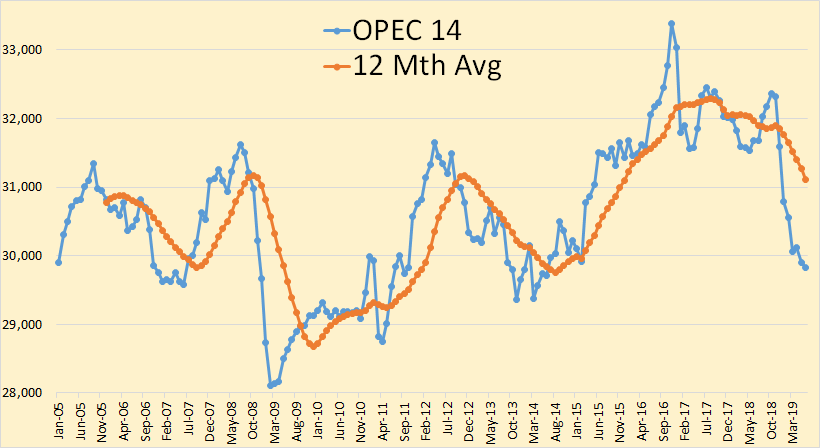
The below charts, unless otherwise noted, were taken from the OPEC Monthly Oil Market Report. The data is through May, 2019 and is in thousand barrels per day.

OPEC crude only production was down 236,000 barrels per day in May but that was after April production had been revised upward by 82,000 bpd.

Iranian April production was revised upward by 43,000 bpd and Saudi Arabia April production was revised upward by 24,000 bpd.