OPEC Monthly Oil Market Report August 2016

OPEC released its Monthly Oil Market Report on August 10, 2016, I have pulled some items of interest from the report.

World Oil Demand

World oil demand growth in 2016 is expected to average 1.22 mb/d, some 30 tb/d higher than last month. For 2017, world oil demand is forecast to grow by 1.15 mb/d, unchanged from the previous report. While the OECD will contribute positively to oil demand growth adding some 0.10 mb/d, the bulk of the growth in 2017 will originate from the non-OECD with 1.05 mb/d.

World Oil Supply

Non-OPEC oil supply is expected to contract by 0.79 mb/d in 2016, following an upward revision of 90 tb/d since the previous report, driven by higher-than-expected output in 2Q16 in the US and UK. In 2017, non-OPEC supply is expected to decline by 0.15 mb/d, following a downward revision of 40 tb/d. OPEC NGL production is forecast to grow by 0.16 mb/d and 0.15 mb/d in 2016 and 2017, respectively. In July, OPEC production increased by 46 tb/d to average 33.11 mb/d, according to secondary sources.

Balance of Supply and Demand

Demand for OPEC crude in 2016 is estimated at 31.9 mb/d, unchanged from last report and 1.9 mb/d higher than in the previous year. In 2017, demand for OPEC crude is forecast at 33.0 mb/d, in line with the previous report and 1.2 mb/d higher than in 2016. Read More
OPEC Hits New High

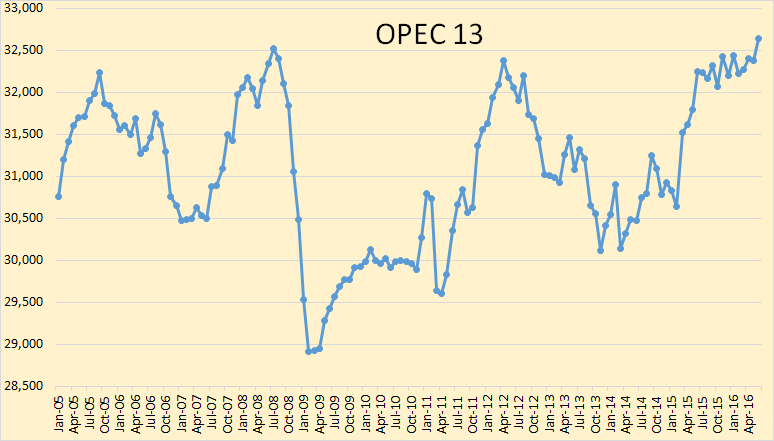
The new OPEC Monthly Oil Market Report is out with crude only production numbers for June 2016. OPEC added Gabon to its member countries this month. But I do not have historical production numbers for Gabon so this report does not include Gabon.

OPEC 13

OPEC crude only production reached 32,643,000 barrels per day, (not including Gabon). This was an increase of just over a quarter of million barrels per day. See exact data below.

Read More

OPEC Production EIA Vs. MOMR

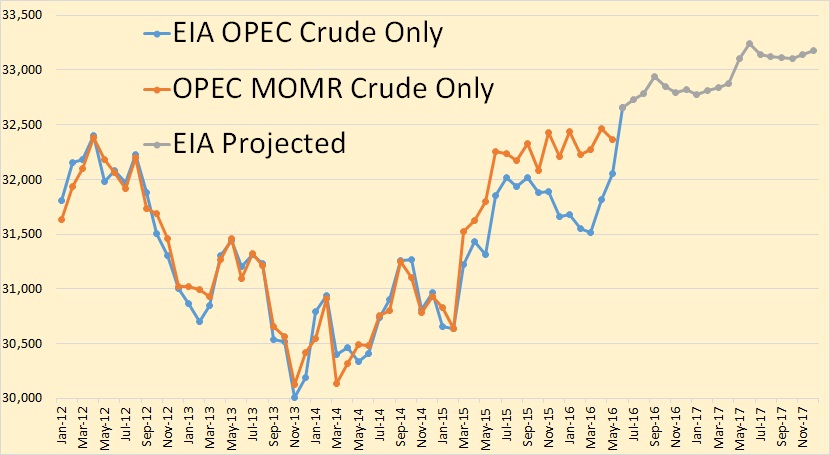
The latest OPEC Monthly Oil Market Report is out with OPEC crude only production numbers for May, 2016. I have compared these numbers with those published by the EIA in their Short-Term Energy Outlook table 3a. All data is in thousand barrels per day and the last data point in May 2016 except for the projection in the one chart below.

OPEC 13

The EIA has OPEC crude production up 238,000 bpd in May to 32,052,000 bpd while OPEC’s “secondary sources” has OPEC production down 100,000 bpd to 32,31,000 bpd in May. The MOMR still has their May production 309,000 bpd more than the EIA.

However that all changes next month, according to the EIA. They have OPEC crude production jumping by 600,000 bpd in June to 32,652,000 bpd. They did not project individual countries however so we have no idea where they believe all that oil is going to come from. Frankly, I just don’t believe it is going to happen.

Read More

OPEC Declines in February Despite Huge Iran Increase

All charts are through February 2016

The OPEC Monthly Oil Market Report just came out. The charts are “Crude Only” production and do not reflect condensate production.

Also the charts, except for Libya, are not zero based. I chose to amplify the change rather than the total. OPEC is now 13 nations with the the addition of Indonesia.

All Data is in thousand barrels per day.

OPEC 13

OPEC production was down 174,800 barrels per day in February Read More