EIA World Crude Oil Production

The EIA has apparently stopped publishing its International Energy Statistics. Instead they are now publishing an abbreviated version on their Total Energy web page titled: Tabel 11.1b World Crude Oil Production. Here they publish crude + condensate production numbers for Persian Gulf Nations, Selected Non-OPEC Countries, Total Non-OPEC and World. The “Selected Non-OPEC Producers are Canada, China, Egypt, Mexico, Norway, Russia, United Kingdom and the United States. They have just released their latest data through February 2016.

All the data below is in thousand barrels per day and through February 2016 unless otherwise noted.

World C+C

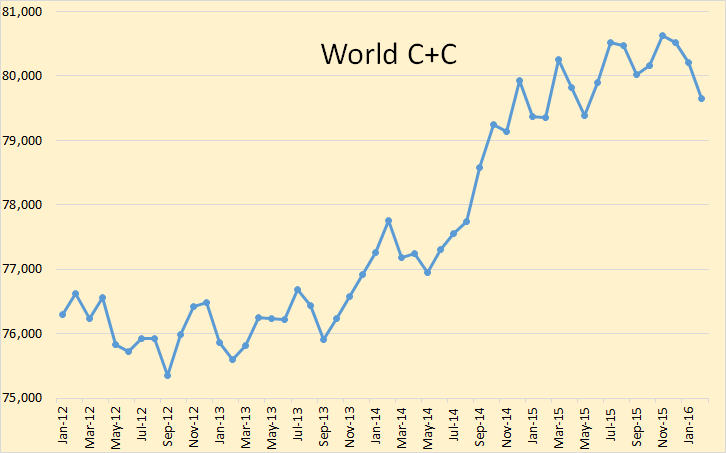
They have world C+C peaking, so far, in November 2015 at 80,630,000 bpd. February production was 79,653,000 bpd, or 977,000 bpd below the peak. World C+C production, they say, averaged 80,035,000 in 2015. Average for the first two months of 2016 was 79,933.000 or 102,000 bpd below the average for 2015.

So with world production continuing to decline, there is little doubt that 2016 production will be well below 2015 production.

Read More

Short-Term Energy Outlook 2015 and 2016

The EIA has just released their Short-Term Energy Outlook for January. They have now included their predictions for 2016. Here is what they expect for US C+C. I have made the first projected production for December 2014 though the EIA says they have production data for December. All date is in million barrels per day through December 2016.

STEO Total US C+C

The EIA is saying that US C+C will peak at 9.47 mb/d in May 2015, drop 330,000 barrels per day by September 2015 then recovers, apparently because the price of oil goes back. Or perhaps they have another reason. They do not have US production surpassing May 2015 until July of 2016.

The EIA only gives C+C outlook numbers for domestic production. However they do project total liquids for all Non-OPEC nations. But first here is what they are predicting for US total liquids:

STEO US Total Liquids

The EIA has US total liquids hitting a plateau in July 2015 then heading up again in April 2016 and increasing by 1 million barrels per day during the remainder of the year.

Read More