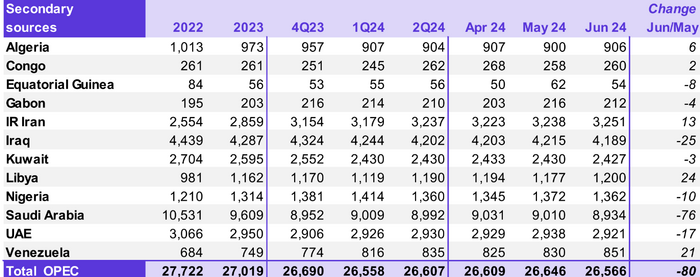
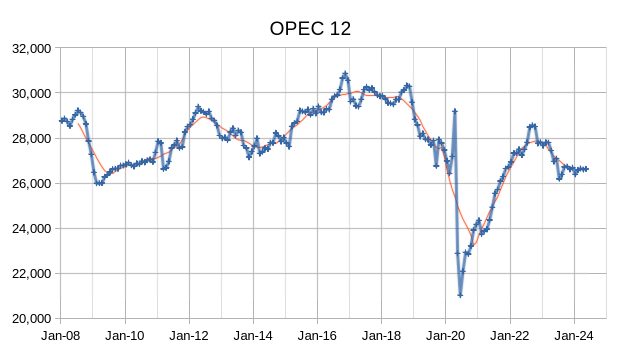
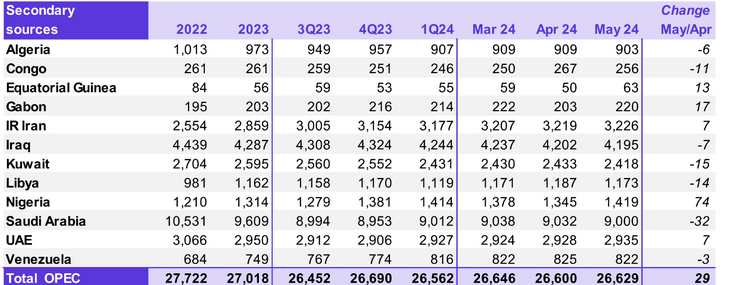
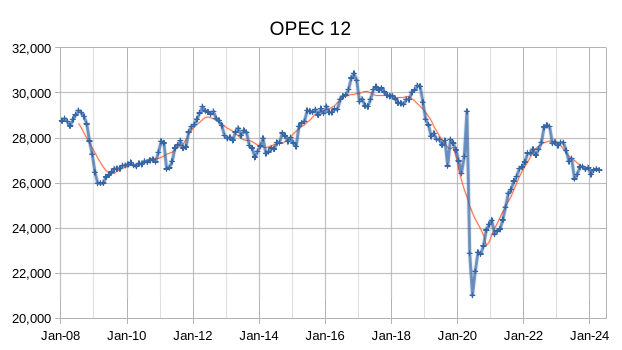
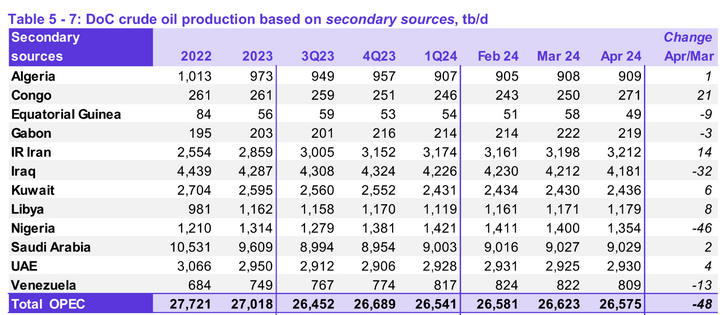
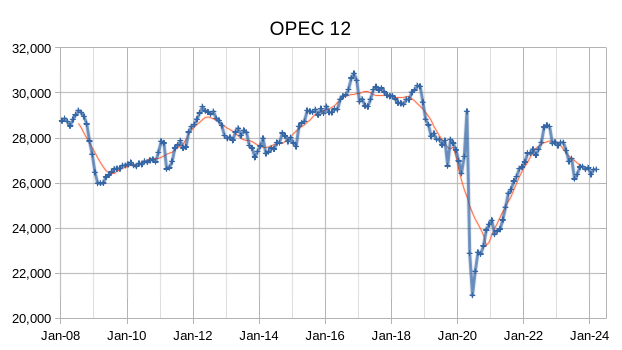
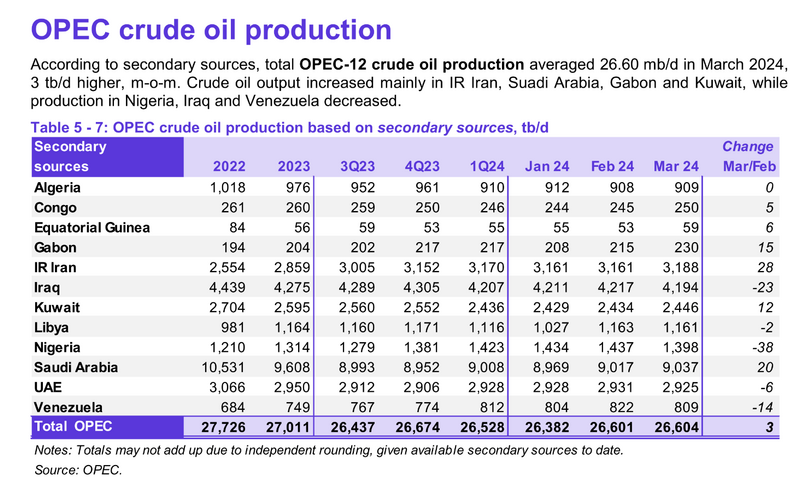
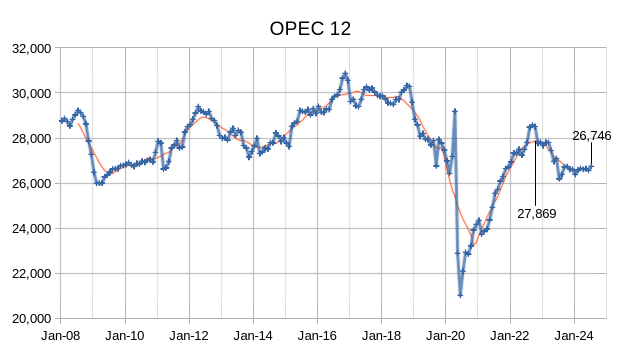
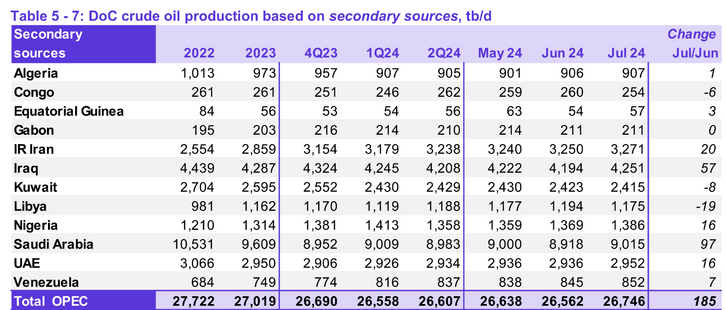
The OPEC Monthly Oil Market Report (MOMR) for March 2024 was published recently. The last month reported in most of the OPEC charts that follow is February 2024 and output reported for OPEC nations is crude oil output in thousands of barrels per day (kb/d). In the OPEC charts that follow the blue line with markers is monthly output and the thin red line is the centered twelve month average (CTMA) output.
Tag: OPEC
OPEC Update, February 2024
The OPEC Monthly Oil Market Report (MOMR) for February 2024 was published recently. The last month reported in most of the OPEC charts that follow is January 2024 and output reported for OPEC nations is crude oil output in thousands of barrels per day (kb/d). In the OPEC charts that follow the blue line with markers is monthly output and the thin red line is the centered twelve month average (CTMA) output.
OPEC Update, January 2024
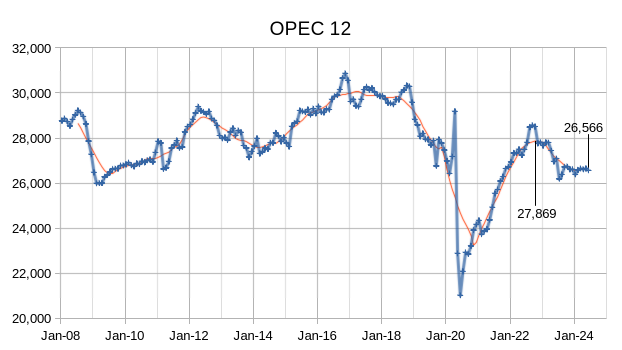
The OPEC Monthly Oil Market Report (MOMR) for January 2024 was published recently. The last month reported in most of the OPEC charts that follow is December 2023 and output reported for OPEC nations is crude oil output in thousands of barrels per day (kb/d). In many of the OPEC charts that follow the blue line with markers is monthly output and the thin red line is the centered twelve month average (CTMA) output. For the first chart I compare OPEC- 13 with OPEC -12 due to Angola deciding to leave OPEC and reducing the number of OPEC nations by one.
EIA Short Term Energy Outlook and Tight Oil Update, December 2023
STEO
The EIA’s Short Term Energy Outlook (STEO) was published in early December. The chart below estimates World C+C by using the STEO forecast combined with past data from the EIA on World Output.
OPEC Update, December 2023
The OPEC Monthly Oil Market Report (MOMR) for December 2023 was published recently. The last month reported in most of the OPEC charts that follow is November 2023 and output reported for OPEC nations is crude oil output in thousands of barrels per day (kb/d). In many of the OPEC charts that follow the blue line with markers is monthly output and the thin red line is the centered twelve month average (CTMA) output.