A post by Ovi at peakoilbarrel.
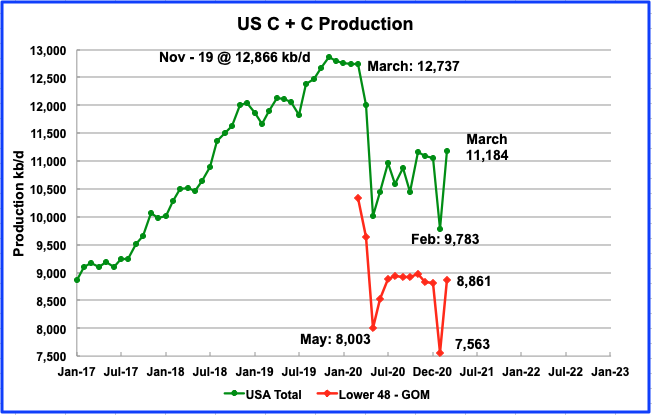
All of the oil (C + C) production data for the US state charts comes from the EIAʼs Petroleum Supply monthly PSM. The charts below are updated to March 2021 for the 10 largest US oil producing states.
A guest post by Ovi at peakoilbarrel
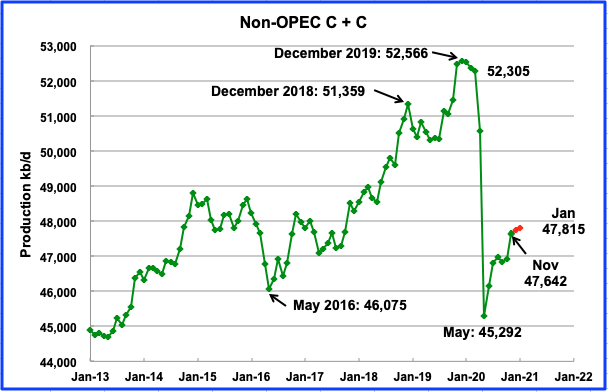
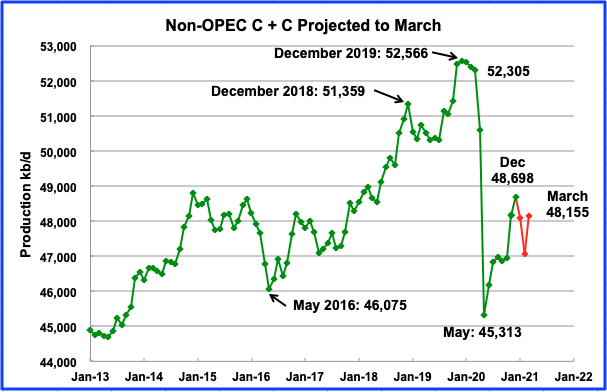
Below are a number of oil (C + C ) production charts for Non-OPEC countries created from data provided by the EIAʼs International Energy Statistics and updated to January 2021. Information from other sources such as OPEC, the STEO and country specific sites such as Russia, Norway and China is used to provide a short term outlook for future output and direction for a few countries and the world.
By Ovi at peakoilbarrel.
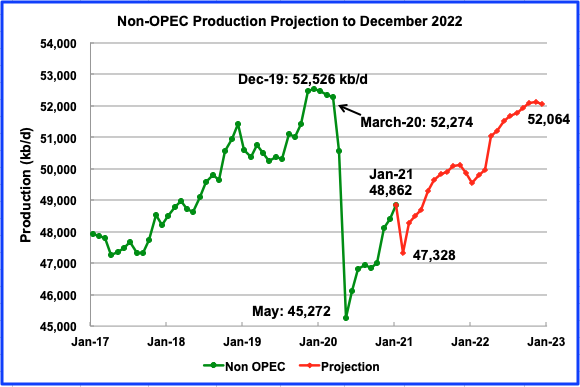
Normally near the end of the month an update on world oil output is posted here. However this month the EIA’s world oil report will appear too close to the US monthly report. For this month, in its place, this space will be filled with the three oil growth projections that the EIA published in April along with other oil production related information. The world report will be posted after the US report, later in May.
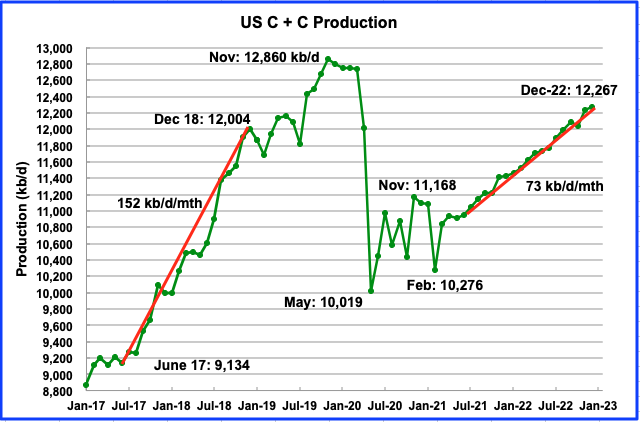
The STEO provides projections for the next 13 – 24 months for US C + C and NGPLs production. The April 2021 report presents EIAʼs updated oil output and price projections to December 2022.
A post by Ovi at peakoilbarrel
Below are a number of oil (C + C ) production charts for Non-OPEC countries created from data provided by the EIAʼs International Energy Statistics and updated to December 2020. Information from other sources such as OPEC, the STEO and country specific sites such as Russia, Norway and China is used to provide a short term outlook for future output and direction for a few countries and the world.
A post by Ovi at peakoilbarrel
Below are a number of oil (C + C ) production charts for Non-OPEC countries created from data provided by the EIAʼs International Energy Statistics and updated to November 2020. Information from other sources such as OPEC, the STEO and country specific sites such as Russia and Norway is used to provide a short term outlook for future output and direction for a few countries and the world.
This November post will primarily update the charts from the October report that was posted late on Saturday, February 20. The comments in the October post were up to date as of February 19 and so will be largely copied over to this post and updated where appropriate.