A Guest Post by George Kaplan
Exploration, Discoveries and Development
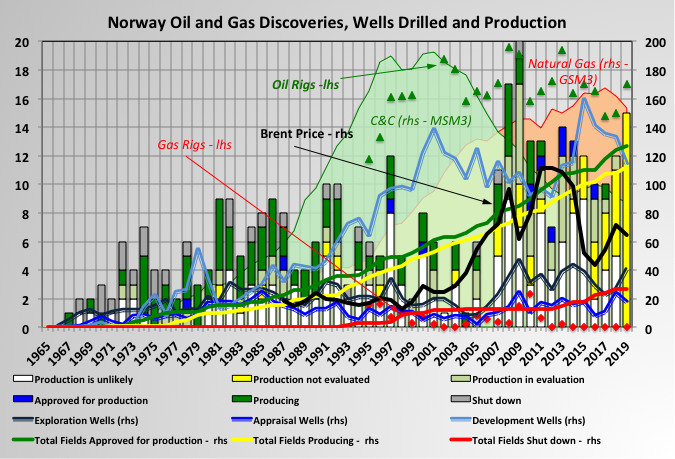
Drilling and development activity off shore Norway has been fairly steady through the life of the basin. This has been partly from government policy, through tax relief or direct action, but also through opening up of new areas as technology becomes available. It has moved from mainly producing oil to now being dominated by gas, although there is little direct gas exploration now (note that converting gas to o.e. is simple in S.I. units and is just a factor of 1000).
Drilling activity has been high in the 2000’s for development wells (including a lot of in fill drilling and some major redevelopments) and exploration (I think there is very favourable tax arrangements that encourage drilling in even fairly low prospective areas). Appraisal drilling has been more flat and there has been some reports that some discoveries have proved disappointing after start up, possibly because of insufficient drilling before development was approved.
There are twelve projects “approved for production” (i.e. in development) with average reserves of 26.5 MSm3 and average discovery year 2001; nineteen projects “production in clarification phase” (i.e. in FEED or pre-FEED) with average resources of 25 MSm3 and average discovery year also 2001; twenty nine projects “production likely but unclarified” (i.e. in conceptual design) with average resources of 10 MSm3 and average discovery year also 2003; and twenty eight projects “production not evaluated” with resources of 8.5 MSm3 and average discovery year also 2010.
The number of “hydrocarbon shows” has been large recently but they have mostly been small with “production unlikely” or “not yet evaluated” (and present prices mean most of these are likely to be deferred at best).
The number of development projects per year has, if anything, been increasing slightly, although the size has been generally decreasing. The number of shut down fields is increasing slowly but the have been a number that have had their life times extended beyond their original shut-down date (through improved reservoir performance and/or major redevelopments).
The oil price may have influenced activity but I can’t really see it much, maybe the effect of the current crash will be more obvious.
Read More