US May Production Plunges 2Mb/d

A post by Ovi at peakoilbarrel

All of the oil (C + C) production data for the US states comes from the EIAʼs Petroleum Supply monthly PSM. At the end of the production charts, an analysis of three different EIA monthly reports projecting future production is provided. The charts below are updated to May 2020 for the 10 largest US oil producing states.

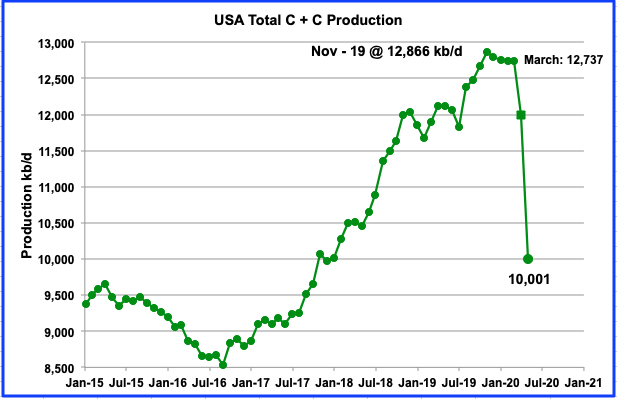
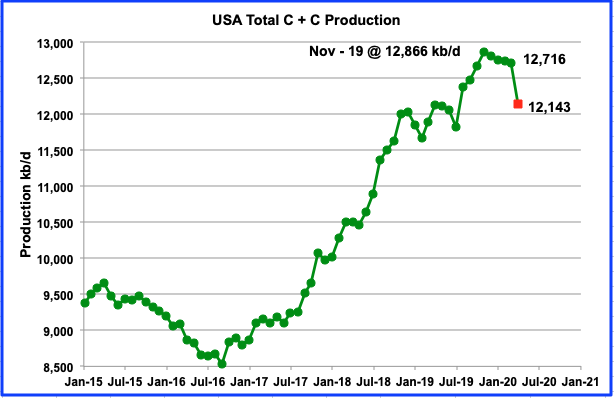
May’s production drop is just short of 2 Mb/d by 11 kb/d. Awesome. US oil fields began a slow and steady decline from November 2019 to March 2020. March brought the combination of CV-19 and oil price drop that led to the sharp production plunges in April and May. Since the current EIA data is two months delayed, May is the second month that shows the combined effects of the pandemic and low oil prices. Will June drop below 10,000 kb/d?

Read More

US Oil Output Continues its Steady Decline

A post by Ovi at peakoilbarrel

All of the oil (C + C) production data for the US states comes from the EIAʼs Petroleum Supply Monthly (PSM). At the end, an analysis of three different EIA monthly reports is provided. The charts below are updated to March 2020 for the 10 largest US oil producing states, (Production > or close to 100 kb/d).

Today’s June 1 update shows the continuous slow decline in oil output from US oil fields from November 2019 to March 2020. March output was 12,716 kb/d, down by 28 kb/d from February’s 12,744 kb/d. Also it should be noted that February’s output estimate from the EIA’s earlier May report, 12,833 kb/d, has been revised to 12,744 kb/d, a downward revision of 89 kb/d. The Red dot is the projected April output from the May Monthly Energy Review.

Read More

U.S. Oil Production Is Competing Against Decline

A Post by Ovi at peakoilbarrel . com

All of the oil production data for the US states comes from the EIAʼs Petroleum Supply Monthly. In addition, information from other EIA offices is provided to project future US output. At the end, an estimate is made for the decline rate in the L48 conventional oil fields and an analysis of a few different EIA reports is undertaken.

The charts below are updated to October 2019 for the 10 largest US oil producing states (>100 kb/d).

U.S. oil output continued to increase in October 2019. Production reached a new high of 12,655 kb/d, an increase 171 kb/d over September and 55 kb/d higher than estimated by the December Monthly Energy Review (MER). However it is 93 kb/d lower than the 12,748 kb/d estimated in the December STEO report. This could be an indication that the January STEO report will again lower US production estimates for 2020.

Read More

Is US Oil Production Growth Slowing???

This is a guest post by Ovi here.  

All of the oil production data for the states comes from the EIAʼs Petroleum Supply Monthly.

The charts below are updated to September 2019 for the largest US oil producing states (>100 kb/d).

There continues to be much speculation and information pointing to a potential slowing of US oil production.  However the latest production data from the EIA continues to point higher, albeit at a slower rate.

Read More

USA Oil Production by State Updated to August 2019

All data for this post is from the EIA’s Petroleum Supply Monthly

The charts below are primarily for the largest US oil producing states (>100 kb/d) and are updated to August 2019.  If you are interested in additional states, let it be known.

Ron has asked if I would take over the monthly posts for USA oil production.  I have tentatively agreed to do that.  Let us all thank Ron for his work at tracking US production and for his insights.  Ron will continue to monitor what’s happening with US production and provide his comments. He is not going away.

This is my first post on US production by state. If you spot any errors, please let me know and I will try to fix them.

Read More