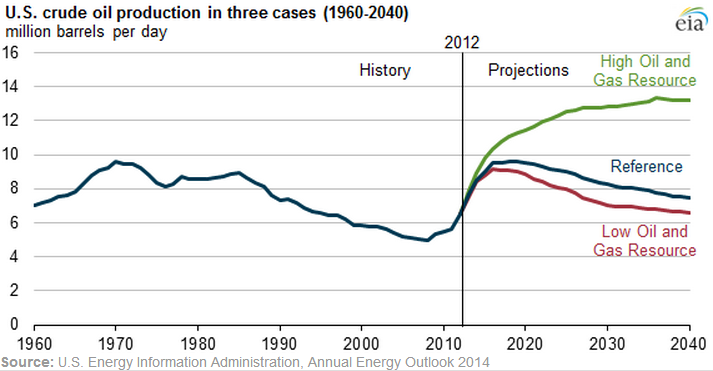
Folks here know that I like to post charts created from oil production data. But there has been a dearth of data lately. But not to worry, the data should start coming fast and furious later this week. However in the meantime I decided post a little about what the EIA expects in the future. They published the below comments and chart April 7, 2014. Bold mine.
Petroleum & Other Liquids
In the Annual Energy Outlook 2014 (AEO2014) Reference case, crude oil* production rises from 6.5 million barrels per day (MMbbl/d) in 2012 to 9.6 MMbbl/d before 2020, a production level not seen since 1970. Tight oil production growth accounts for 81% of this increase, and sees its share of national crude oil production grow from 35% in 2012 to 50% in 2019. In the High Oil and Gas case, U.S. crude oil production reaches 11.3 MMbbl/d in 2019 and reaches 13.3 MMbbl/d in the mid-2030s.
Under the Reference case, the import share of U.S. petroleum and other liquid fuels falls to about 25% during the last half of the current decade before rising again to 32% by 2040. In comparison, the High Oil and Gas Resource case projects that net U.S. oil imports will continue to decline through the mid-2030s and remain at or near zero between 2035 and 2040.
In the High Oil and Gas Resource case, tight oil plays an even more prominent role in driving national production growth, accounting for nearly two-thirds of total U.S. production by 2035, versus less than half of total U.S. production in the Reference case. Tight oil development is still at an early stage, and the outlook is highly uncertain. In EIA’s view, there is more upside potential for greater gains in production than downside potential for lower production levels. The High Oil and Gas Resource case assumes improvements in tight oil production technology beyond those in the Reference case, as well as higher well productivity rates.
Other assumptions reflected in the High Resource case include:
- Identification of additional tight oil resources
- 50% higher Estimated Ultimate Recovery (EUR) for tight/shale oil and natural gas wells
- 50% lower well spacing per acre for tight/shale oil and natural gas wells, with diminishing EUR for closely-spaced wells
- A 1% annual increase in the EURs for tight/shale oil and natural gas wells reflecting both abundant resources and technology advances
- Additional resources in Alaska and Lower 48 offshore fields
