Oil Shipments by Rail Declining

Weekly oil shipments by rail can be found on the web at Weekly Carload Reports. And a summation of that data with charts can be found at Association of American Railroads  Freight Rail Traffic Data.

Rail Oil Carloads 3

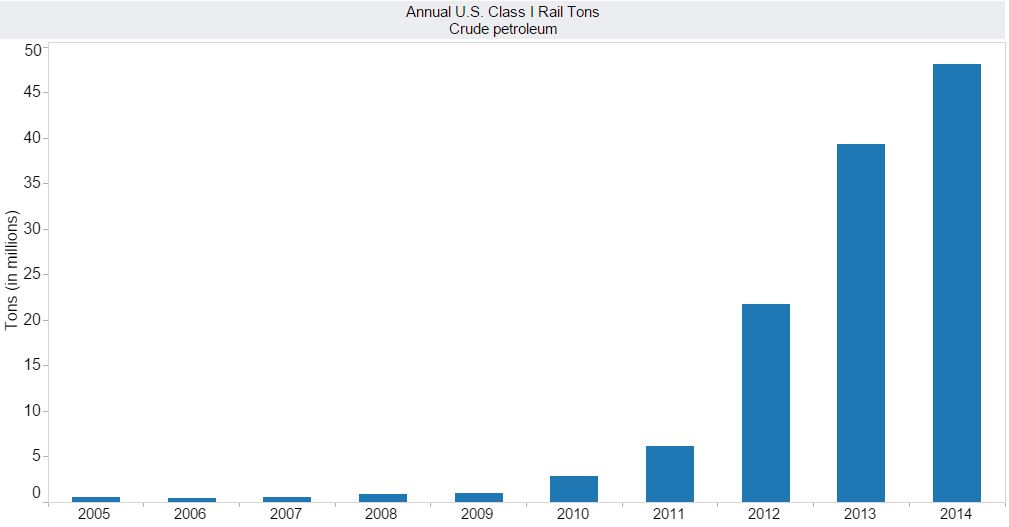
Crude oil by rail basically started with the shale boom. Prior to that almost all oil was shipped by pipeline. Of course a lot of oil was trucked to the pipelines. The EIA says in the first seven months of 2014 8 percent of all us crude and refined products was shipped by rail. It looks like that percentage was increased somewhat in the second half of 2014.

Read More

Bakken by County

North Dakota publishes monthly ND Historical Barrels of Oil Produced by County. This data however does not include confidential wells. But they do estimate, by county, their confidential well production here: Oil and Gas Production Report

All charts are in barrels per day and are only for the last 16 months in order to get a better and expanded view of what each county is doing.

North Dakota Expanded

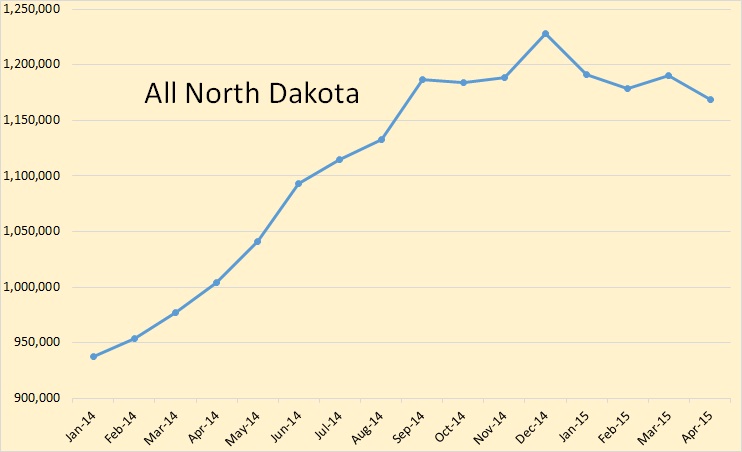
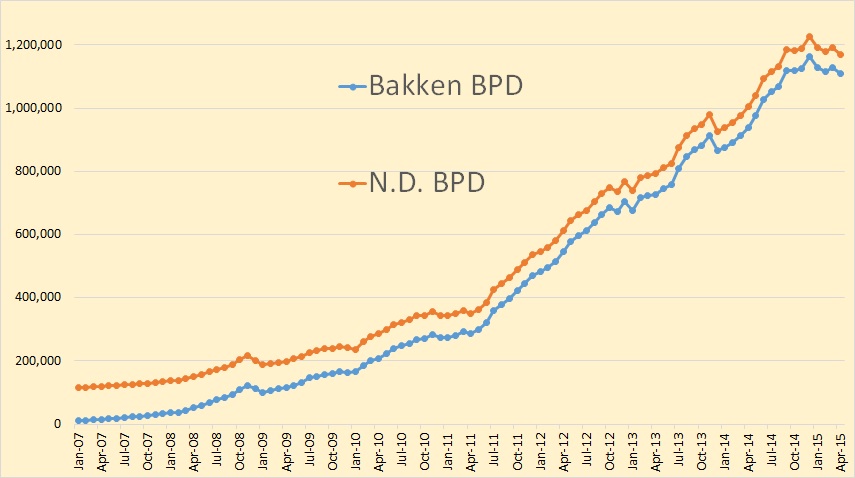
First a sixteen month view of all North Dakota production. North Dakota production, in April, stood at  1,168,636 bpd. That is 17,631 bpd below their production last September, seven months previous. North Dakota production is down 59,385 bpd since the high reached in December.

Read More

Bakken April Production Data

The North Dakota Industrial Commission is out with the April production Data for the Bakken and all North Dakota.

Bakken Production

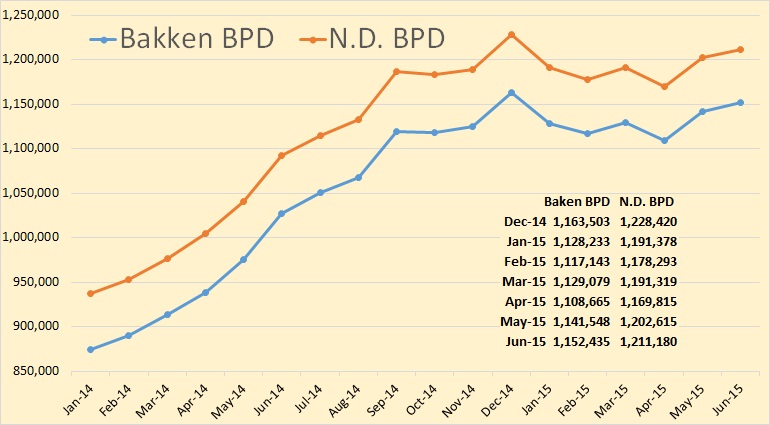
Eight month of flat to down production from the Bakken.

Bakken Amplified

I have shortened the data to 16 months here to give a better picture of what is really happening. North Dakota reached an 8 month low. North Dakota, in April, was 17,631 barrels per day below their September 2014 production. The Bakken was only 11,024 below September 2014 so conventional wells seem to be dropping off pretty fast.

Read More

World Oil Output Last 3 Years

The EIA publishes every possible energy stat for the USA and hardly anything for the rest of the world. Well, anything current for the rest of the world anyway. Their International Energy Statistics is already five full months behind and working on six. December 2014 is the last international oil production data we have.

Anyway during this lull in other data I decided to look at the last three years of international data, from December 2011 to December 2014. All data is in thousand barrels per day.Post 1

World C+C production was flat for most of 2012 and 2013 but in late 2013 production took off and has increased by about 3 million barrels per day above the average for 2012 and 2013. December C+C production was 79,300,000 BPD.

Read More