Oil Price And Its Effect On Production

The JODI Oil World Database came out a few days ago. The data is through December 2015. The JODI C+C production numbers differs somewhat from the EIA numbers. The JODI OPEC numbers are crude. Also there are a few very small producers that do not report to JODI so their numbers will be slightly less than the EIA. But otherwise they are pretty accurate.

Also, JODI, for some reason, does not count all of Canada’s oil sands production. So for Canada I use Canada’s National Energy Board numbers instead.

The JODI C+C numbers, for Non-OPEC, will average about 2.4 million barrels per day less than the EIA. This is largely due to some countries not reporting to JODI. But these countries only have small changes in their overall production so would have little effect on any of my charts or calculations.
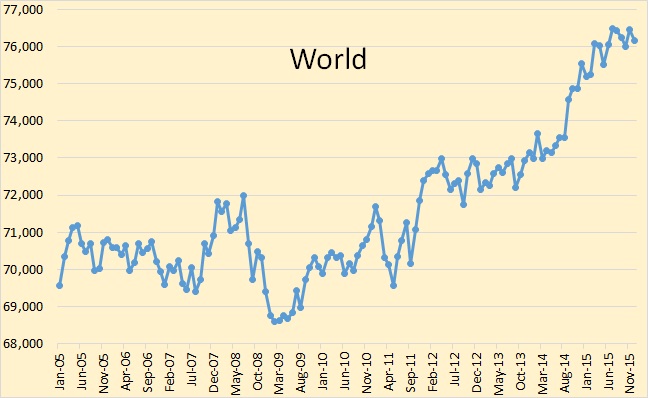
JODI World C+C

According to JODI, world crude oil production peaked, so far, in July and has declined by 339,000 barrels per day.

Read More

Texas Oil Production Still on a Plateau

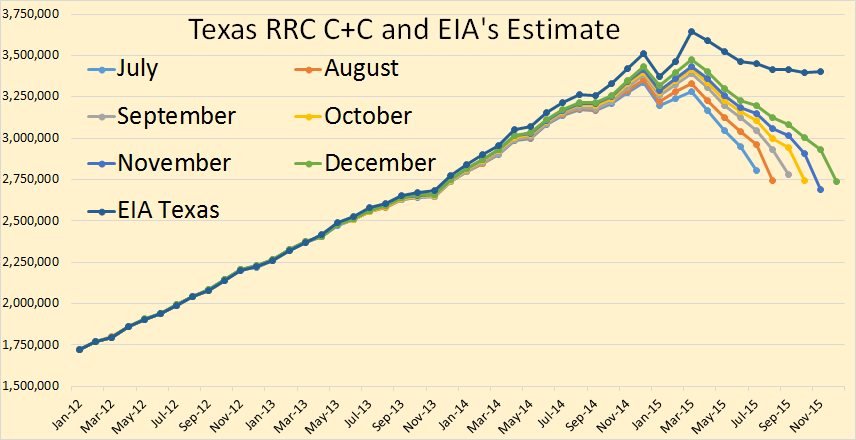
The Texas RRC Oil and Gas Production Data is out. There appeared to be no decline in December production and may have even been a slight increase. 

The Texas RRC data is incomplete and only gives an indication as to whether Texas production increased or decreased. The data appears to droop because each month the the Texas Railroad Commission receives a little more data and the totals increase, little by little, month by month, until after many months the data is complete.

In my charts I post the past six months of data in order to give some indication as to whether production is increasing or decreasing. The final data is through December and the EIA data is through November.

Texas C+C

Texas crude plus condensate declined a little in November but seemed to make up that decline in December. Total Texas C+C seems to be on a flat plateau, declining in Eagle Ford but making up that decline in the Permian and the rest of Texas.

The EIA estimates the final Texas data through November. They have Texas peaking in March and down about a quarter of a million barrels per day since that point.

Read More

BAKKEN – Single Well Economics

This is a guest post by Ciaran Nolan

Disclaimer

The opinions and views expressed in this presentation are solely those of the author and not necessarily those of any organisation.

Introduction

This presentation builds upon earlier work carried out by the author in May 2015 on the North Dakota (ND) Bakken / Three Forks Light Tight Oil (LTO) Play – ‘Bakken – the bubble has burst’*. 

North Dakota Industrial Commission (NDIC) production data (up to November 2015) kindly supplied by Enno Peters. Data analysed in Excel and IHS Kingdom.

Production decline curves generated for P10 – P90 type wells, based on8843 wells with 1 year full production (January 2007 – October 2014).

Discounted cash flow (DCF) models were generated by the author for single wells in the ND Bakken / Three Forks Play.

Break even oil prices for Net Present Values with a 10% discount rate (NPV10) determined for P10 – P90 type wells. NPV10 break even oil price map generated. Historical NPV10 generated for average wells for 2008 – 2015. NPV10 breakeven oil price determined for top ten Bakken Producers in 2014, for 2014 wells.

Ciaran 1

Read More