Eagle Ford, Permian Basin, and Bakken and Eagle Ford Scenarios

This is a guest post by Dennis Coyne

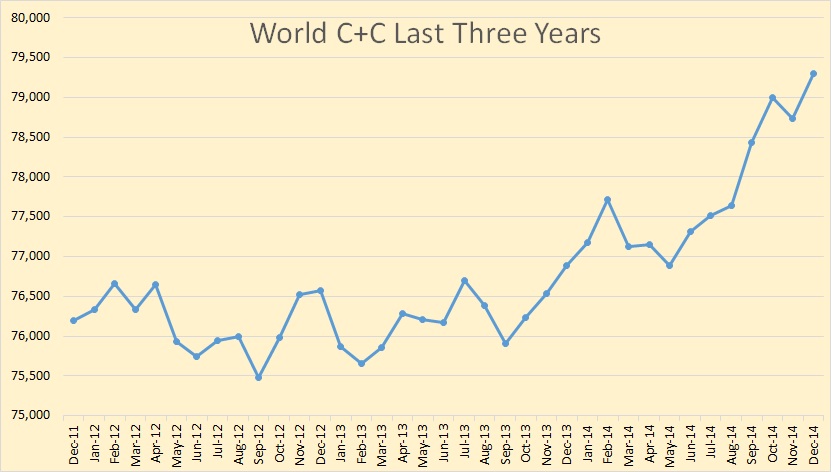
Increased oil output in the US has kept World oil output from declining over the past few years and a major question is how long this can continue. Poor estimates by both the US Energy Information Administration (EIA) and the Railroad Commission of Texas (RRC) for Texas state wide crude plus condensate (C+C) output make it difficult to predict when a sustained decline in US output will begin.

 About 80 to 85% of Texas (TX) C+C output is from the Permian basin and the Eagle Ford play, so estimating output from these two formations is crucial. I have used data from the production data query (PDQ) at the RRC to find the percentage of TX C+C output from the Permian (about 44% in Feb 2015) and Eagle Ford plays (40% in Feb 2015).

Dean’s estimates of Texas C+C output are excellent in my opinion and are close to EIA estimates through August 2014. I used EIA data for TX C+C output through August 2014 and Dean’s best estimate from Sept 2014 to Feb 2015. By multiplying the % of C+C output from the RRC data with the combined EIA and Dean estimate, I was able to estimate Eagle Ford and Permian output. The chart below shows this output in kb/d.

  
blog150427/

Read More

AEO 2015, The EIA’s Crude Production Expectations

The EIA came out with its final update of Annual Energy Outlook 2015. It seems that the EIA is extremely optimistic concerning future US crude oil production.

AEO 2015

Here is a comparison with AEO 2014. The EIA still expects US crude production to peak in 2019 but at 10,472,000 bpd or 824,000 barrels per day higher than the expected last year. But the biggest difference is in the EIA’s change in decline expectations. They now expect the US to be producing 9,329,000 bpd in 2040 or 1,812 higher than they had 2040 production last year. This is the EIA’s reference, or most likely case.

AEO 2015 1

Production from tight formations leads the growth in U.S. crude oil production across all AEO2015 cases. The path of projected crude oil production varies significantly across the cases, with total U.S. crude oil production reaching high points of 10.6 million barrels per day (bbl/d) in the Reference case (in 2020), 13.0 million bbl/d in the High Oil Price case (in 2026), 16.6 million bbl/d in the High Oil and Gas Resource case (in 2039), and 10.0 million bbl/d in the Low Oil Price case (in 2020).

Read More

North Dakota Bakken February Production

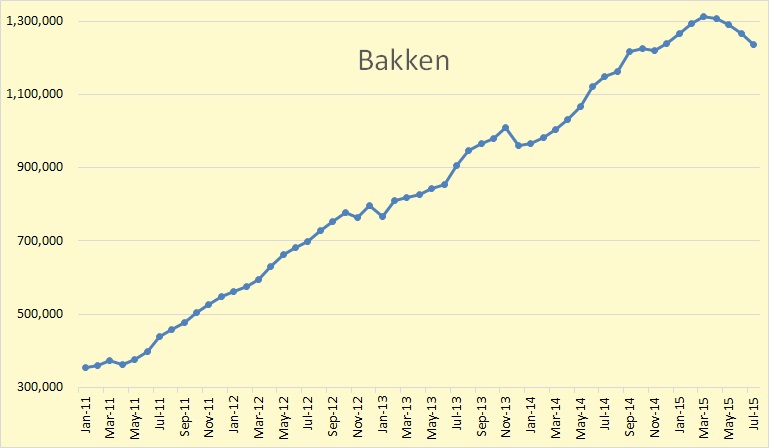
The NDIC Bakken Production Data and the NDIC North Dakota Production Data is in. Production in the Bakken was down 11,941 barrels per day and production in all North Dakota was down 14,104 bpd. The numbers for January were revised slightly. January Bakken was down 35,064 from December and all North Dakota was down 36,331 bpd from December.

Bakken BPD

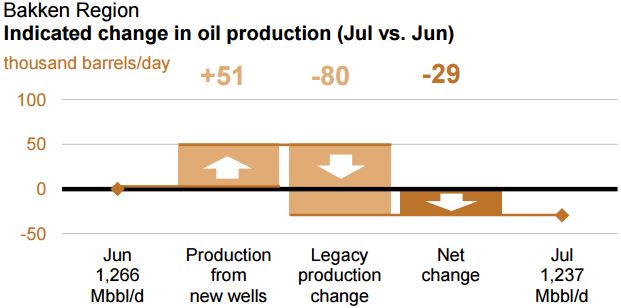
As I have pointed out before, the EIA’s Drilling Productivity Report, for some unknown reason, estimates the last six or seven months, when the actual data is available. In the above chart they estimate from October on. This throws their current numbers way off.  The DPR data includes the Montana Bakken therefore their numbers will naturally be higher than the North Dakota data.

Bakken Eventual

Of course the EIA DPR will eventually bring their numbers into what North Dakota is reporting. The above is what the eventual Drilling Productivity Report will look like. (In Orange). Here is the amount the historical DPR is off.

Read More

Petroleum Supply Monthly + Guest Post

The EIA has published their Petroleum Supply Monthly with all US production numbers through December 2014. The chart below shows the largest changes in December and Yearly production. Almost every state had a production increase. The largest decliner was Wyoming, down 7,000 bpd. Below are the biggest gainers and the amount of their production increase in thousand barrels per day for December and the whole year.

  December 2014
US 187 1366
Texas 49 684
North Dakota 39 297
GOM 68 157

GOM

The Gulf of Mexico was up 68,000 bpd in December but was down 56,000 bpd in November. The EIA had great hopes for the GOM expecting it to hit 2 million barrels per day in 2016. I don’t think that is going to happen. GOM production now stands at 1,441,000 bpd

Alaska

Alaska’s decline seems to be slowing down slightly. They are now at 520,000 bpd.

Read More