OPEC March Data and Saudi Report

The below OPEC charts were taken from data in the OPEC Monthly Oil Market Report. All data is through March 2019 and is in thousand barrels per day.
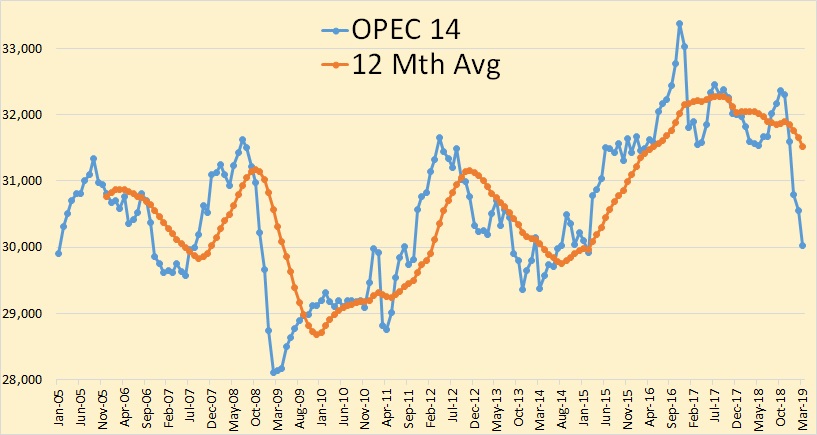
There was another big decline in OPEC production in March, down 534,000 barrels per day.
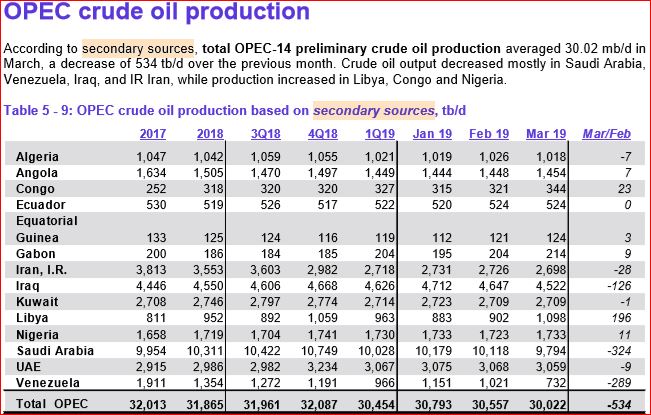
The decline was mostly Saudi Arabia, Venezuela, and Iraq.

Iran, Libya and Venezuela are exempt from quotas. Everyone except Saudi Arabia are near their quota. Saudi is over half a million barrels per day below their quota.

Read More

OPEC January Production Data

The data below is taken from the OPEC Monthly Oil Market Report. All OPEC data is through January 2019 and is in thousand barrels per day.

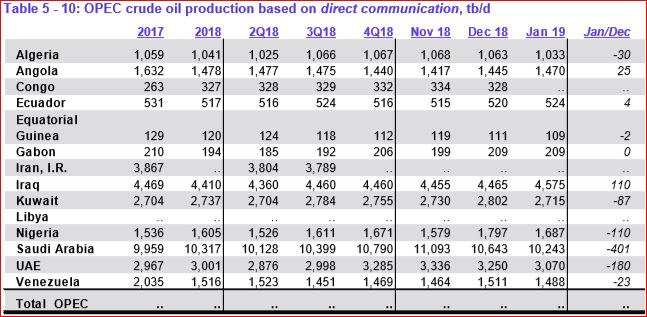
OPEC 14, crude only, was down just three thousand barrels short of 800,000 barrels per day in January.

The difference between what Saudi says they produced and what secondary sources say Saudi produces is 51,000 bpd. But the difference between what Iraq says they produced and what secondary sources say is even more remarkable.

Read More

OPEC December Production Data

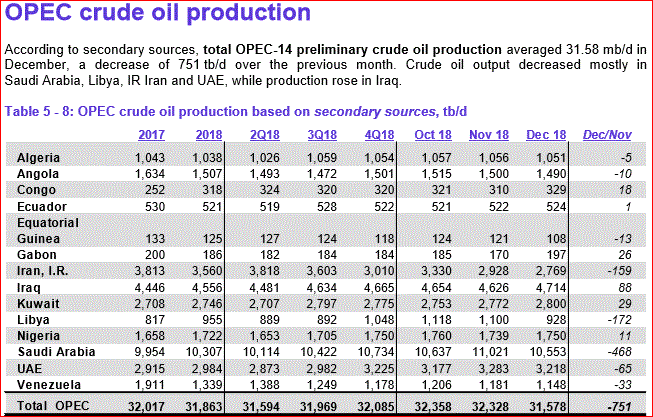
All OPEC data below is from the January OPEC Monthly Oil Market Report. All OPEC data is through December 2018 and is thousand barrels per day.

Qatar has left OPEC and is not included in this months report. All Qatar historical data has been removed from all OPEC charts.

OPEC 14 production was down by 751,000 barrels per day in December. That was after November production had been revised downward by 23,000 barrels per day.

Here you can see who had the big declines in December.

Read More