OPEC September Oil Production

All data below is based on the latest OPEC Monthly Oil Market Report.

All data is through September 2017 and is in thousand barrels per day.
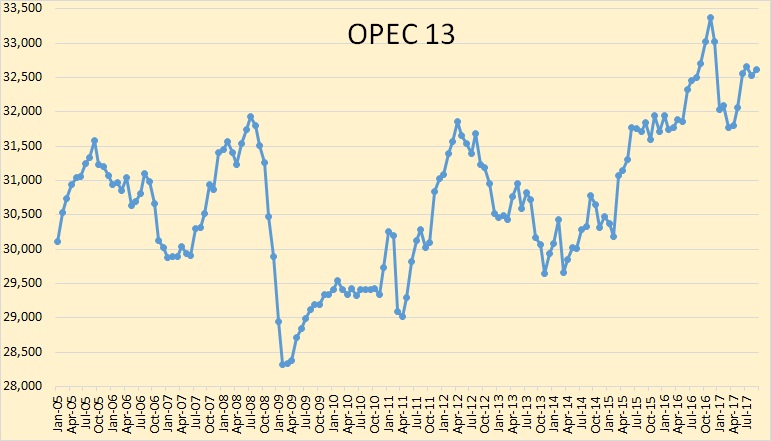
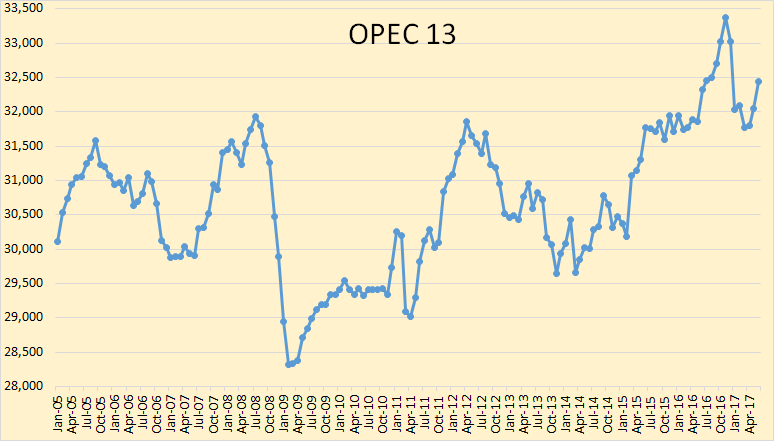
The above chart does not include the 14th member of OPEC that was recently added, Equatorial Guinea. I do not have historical data for Equatorial Guinea so I may not add them at all.  OPEC production has held steady for the past four months. Equatorial Guinea production is tiny, 141,000 bpd so their monthly change in production can be ignored without much effect. OPEC 14 production was up 88,000 barrels per day in September. But that was after their August production had been revised downward by 82,000 bpd.

The OPEC 13, (not including Equatorial Guinea), peaked in 2016 at 32,385 kbpd and are down 150 kbpd for the first 9 months of 2017. Please note that when I say “peaked” I mean “peaked so far“. I am well aware of the fact that OPEC, or some OPEC nations may have further peaks in the future.
Read More

OPEC August Crude Oil Production

All data below is based on the latest OPEC Monthly Oil Market Report.

All data is through August 2017 and is in thousand barrels per day.

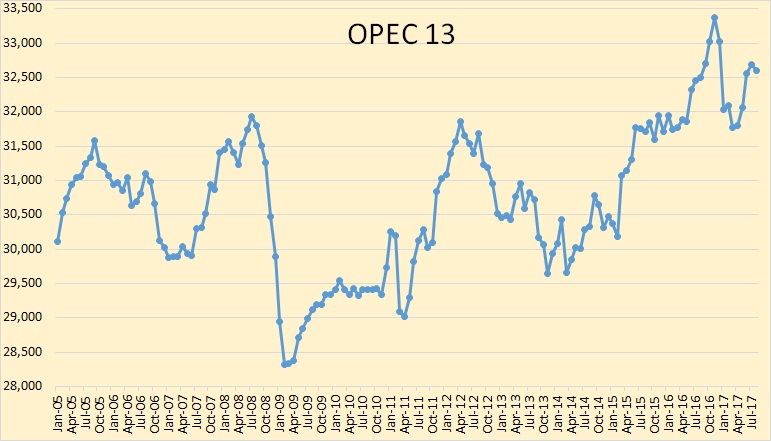
The above chart does not include the 14th member of OPEC that was just added, Equatorial Guinea. I do not have historical data for Equatorial Guinea so I may not add them at all.  OPEC production has held steady for the past three months. Their production was down 79,000 barrels per day in August but that is not a big drop when production is over 32.5 million barrels per day.

Read More

OPEC June Production Data

All data below is based on the latest OPEC Monthly Oil Market Report.

All data is through June 2017 and is in thousand barrels per day.

The above chart does not include the 14th member of OPEC that was just added, Equatorial Guinea. I do not have historical data for Equatorial Guinea so I may not add them at all. It doesn’t really matter since they are only a very minor producer. Also, they are in steep decline, dropping at about 10% per year.

Read More

OPEC May Production Data

All data below is based on the latest OPEC Monthly Oil Market Report.

All data is through May 2017 and is in thousand barrels per day.

OPEC crude only production was up 336,000 barrels per day in May. The two countries that are not subject to OPEC quotas, Nigeria and Libya, were up a combined 352,000 barrels per day. That means the rest of OPEC was down 16,000 bpd. And all this was after OPEC April production was revised upward by 72,000 barrels per day.

Read More

OPEC April Production Data

All data below is based on the latest OPEC Monthly Oil Market Report.

All data is through April 2017 and is in thousand barrels per day.

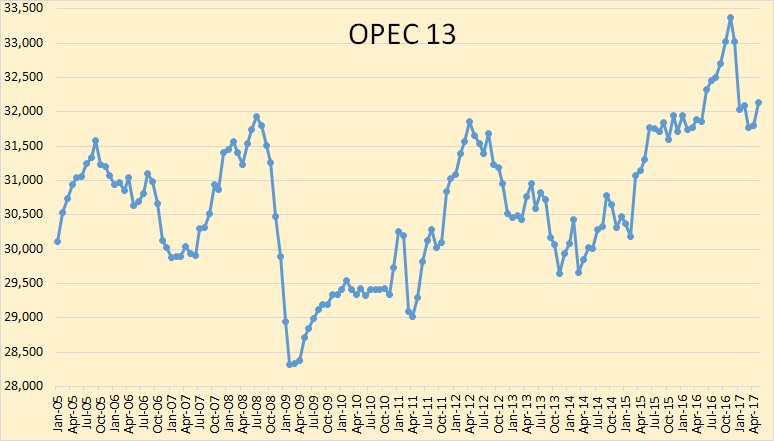
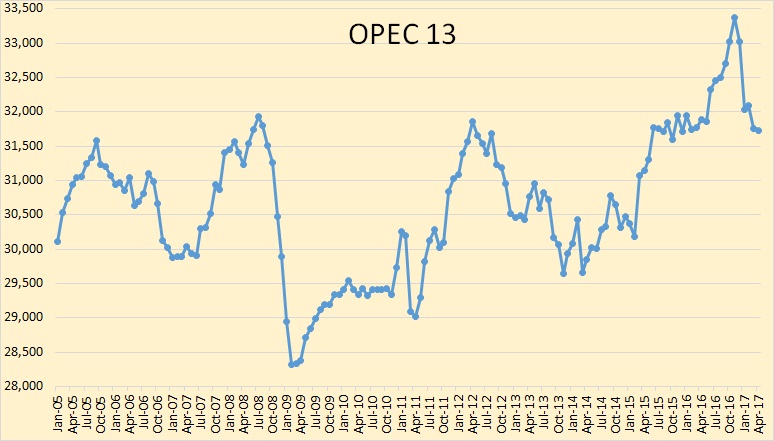
Looking at the above chart it seems obvious what most OPEC nations were doing. They announced in the summer of 2016 that there would likely be quota cuts beginning in 2017. And those cuts would be a percentage of their current production. So everyone began making heroic attempts to increase production by the end of 2016. So now, after everyone who felt that they should cut, has cut, they are right back to the level that they were at before the cuts were proposed.

I wrote the above paragraph last month. I see no reason to change a word of it now.

Read More