A Guest Post by David Archibald
The views expressed in this post are those of the author alone.
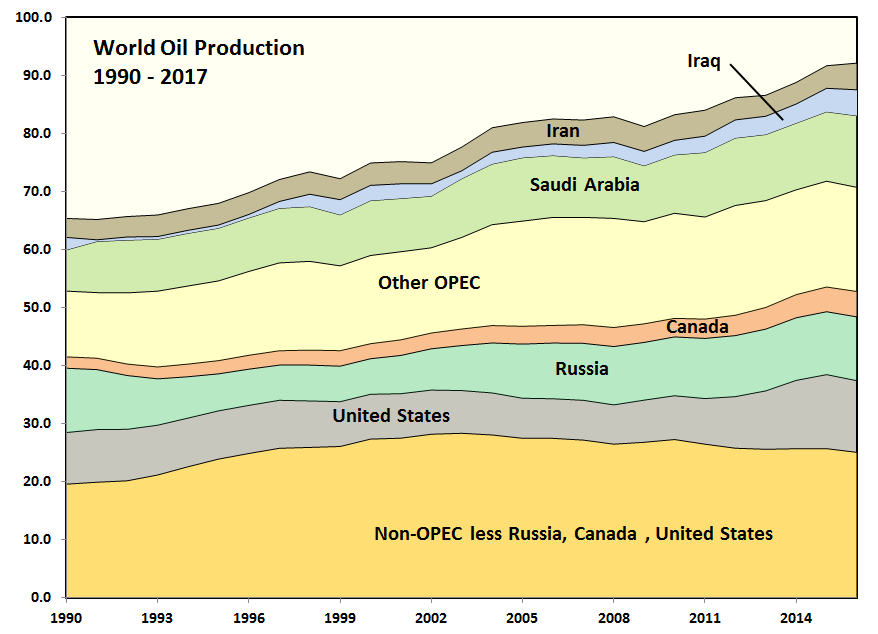
This assessment is based on the data in the 2017 BP Statistical Review of World Energy available here. As such it uses that review’s definition of oil which is crude and condensate and natural gas liquids, uncompensated for their different energy contents or values of refined product components.

Figure 1: World Oil Production 1990 – 2017
This analysis was prompted by a chart by Ovi showing that Non-OPEC production less Russia, Canada and the United States has been in decline since 2004. That decline rate is 0.25 million barrels/day/annum. It had previously risen strongly from 1990. Read More


