OPEC October Production Data

All data below is based on the latest OPEC Monthly Oil Market Report.

All data is through October 2017 and is in thousand barrels per day.

I have now included Equatorial Guneia although I only have data from January 2015 from OPEC’s secondary sources. The January 2015 E. Guneia data was extended back to January 2005. I know this is inaccurate but production from E. Guneia is so small it will make little difference.

Read More

OPEC September Oil Production

All data below is based on the latest OPEC Monthly Oil Market Report.

All data is through September 2017 and is in thousand barrels per day.

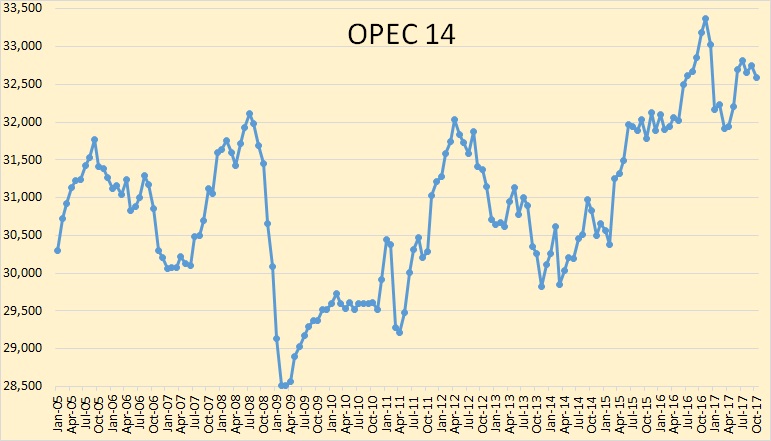
The above chart does not include the 14th member of OPEC that was recently added, Equatorial Guinea. I do not have historical data for Equatorial Guinea so I may not add them at all.  OPEC production has held steady for the past four months. Equatorial Guinea production is tiny, 141,000 bpd so their monthly change in production can be ignored without much effect. OPEC 14 production was up 88,000 barrels per day in September. But that was after their August production had been revised downward by 82,000 bpd.

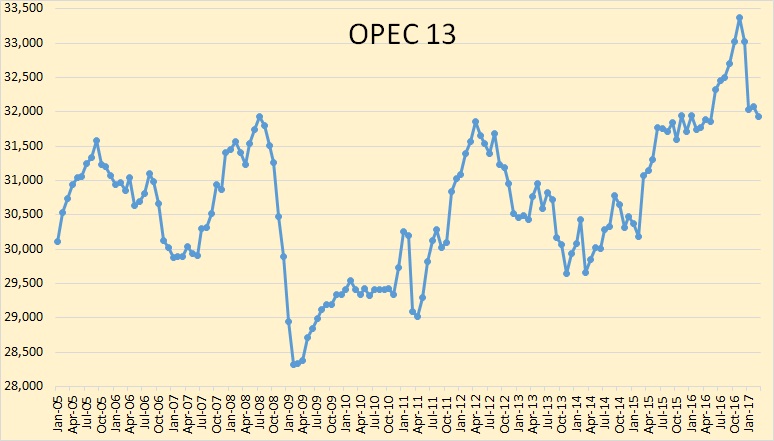
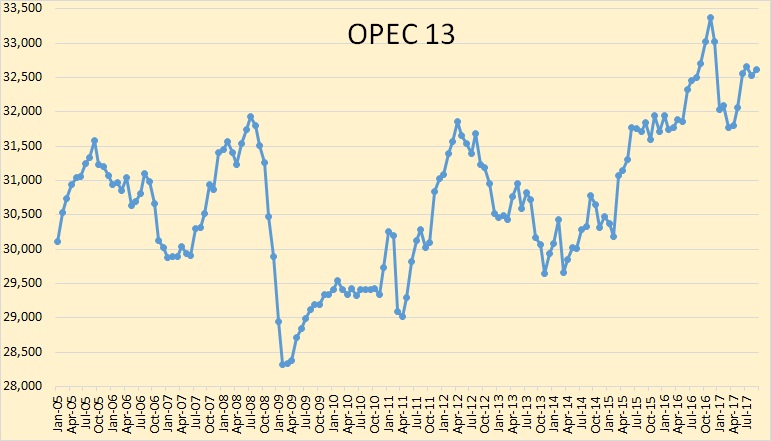
The OPEC 13, (not including Equatorial Guinea), peaked in 2016 at 32,385 kbpd and are down 150 kbpd for the first 9 months of 2017. Please note that when I say “peaked” I mean “peaked so far“. I am well aware of the fact that OPEC, or some OPEC nations may have further peaks in the future.

Read More

OPEC March Crude Oil Data

The OPEC Monthly Oil Market Report is out with OPEC’s crude oil production numbers for March 2017.

All data is through March 2017 and is in thousand barrels per day.

Looking at the above chart it seems obvious what most OPEC nations were doing. They announced in the summer of 2016 that there would likely be quota cuts beginning in 2017. And those cuts would be a percentage of their current production. So everyone began making heroic attempts to increase production by the end of 2016. So now, after everyone who felt that they should cut, has cut, they are right back to the level that they were at before the cuts were proposed.

Read More

A Closer Look at OPEC

Taking a closer look at OPEC. All OPEC and price data below is through December. All production data is in thousand barrels per day.

Iran and Libya have had serious political disruptions in their production numbers. Simply adding them to the OPEC numbers distorts the picture. To try to figure out what has been happening to OPEC we need to look at OPEC without Iran and Libya.

OPEC Less Iran and Libya

Here is OPEC less Iran and Libya, or the OPEC 10 if you will. I have marked August 2012 as what I call the “Price Peak”. Not the peak in oil prices but the production peak that was brought about by the increase in the price of oil. That price increase began in early 2009 and by March 2011 was well above $100 a barrel. And the price of oil did not drop below $100 a barrel until late August 2014.

Read More