The EIA’s Drilling Productivity Report, Is Productivity Really Improving?

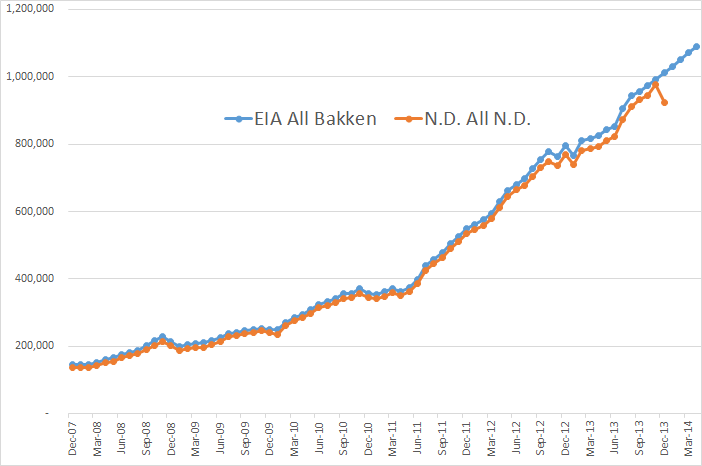
The EIA just published their latest Drilling Productivity Report. They kept their very linear increase for all LTO plays except for the Bakken. Strangely they updated their Bakken data right up through January according to the data they apparently received from North Dakota.

DPR Bakken

The last data point is February for the North Dakota data and May for the DPR data.

But the EIA posted some strange Legacy Decline numbers for the Bakken;

Bakken Decline Chart

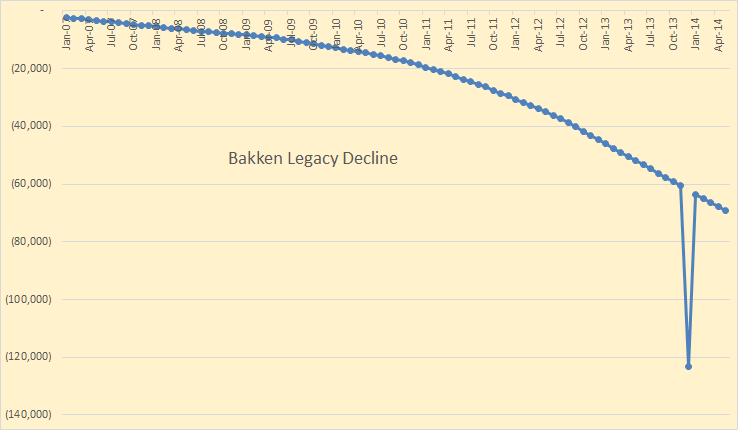
Now this just doesn’t make any sense. The legacy decline is supposed to be the number of barrels per day all the wells in the combined declined. That number should increase, but gradually as new production comes on line. That is the more production the greater the decline. They have the decline rate at 60,553 bp/d in November, jumping to 123,248 in December, then falling back to 63,459 in January. That is impossible! The decline, in barrels per day, increases as production increases. But if production decreases then the number of barrels per day that declines must decrease, not increase.

Read More

The EIA’s Drilling Productivity Report, Ghana and China

The EIA’s latest Drilling Productivity Report has been published. I found some strange things in the report. For the Bakken, their data does not jive with that posted by North Dakota. I have plotted the two together. The North Dakota includes all North Dakota but not the Montana part of the Bakken. The EIA data includes all the Bakken but not the non-Bakken part of North Dakota. Almost a wash but not quite. Montana produces slightly more than the non-Bakken part of North Dakota, but not very much. Anyway…

EIA New Bakken Report

I thought for sure that the EIA would hear that Bakken Production was down about 50,000 barrels per day in December. But Nooooo… they have the Bakken up by over 20,000 barrels per day in December, a difference of 70,000 bp/d. But up until the last two or three months they follow the North Dakota data pretty close so we can hope they update their data in a few months.

However all LTO production was revised upward in this last report. The chart below is the barrels per day that all tight oil was revised upward.

April Revisions

Doesn’t the strange shape of that chart raise suspicions? December production was revised upward by 34,672 bp/d when it actually should have been revised downward by perhaps twice that amount. January production was revised upward by 35,243 barrels per day. I doubt very much that this was the actual case.

Read More