I have been supplied an Excel spreadsheet of all North Dakota wells back to 2006, thanks to Enno Peters and Dennis Coyne. I only used the data back to 2007 however. This is a wealth of information for if we want to know how many wells came on line in a given month, we simply count them. We are given the monthly production data for each month. And since we have the monthly production data we can very easily figure the decline rate of each well, or any group of wells for any month or year.
A note on the data. The first month data was almost always for a partial month. Sometimes the well came on line near the first of the month and sometimes near the end of the month. To get around this problem I have started with the second month, which is the first full month, and used that month as the first month of all my data. All data and charts below include all North Dakota wells, not just the Bakken.
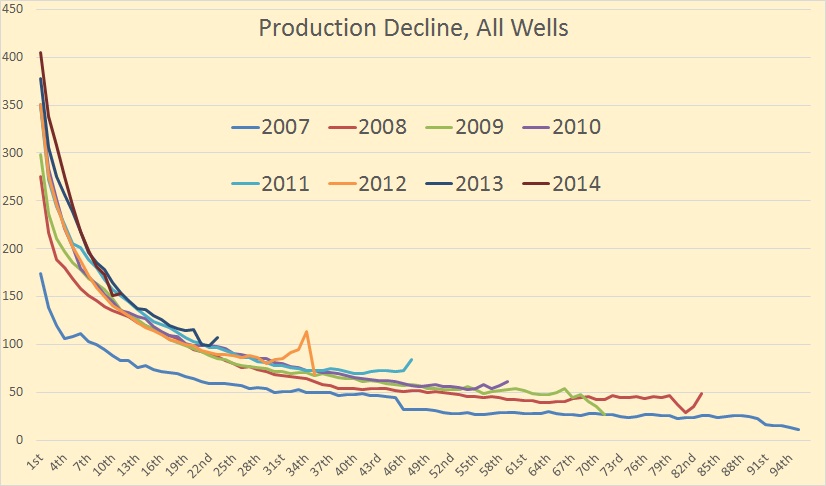
Production per well has gradually increased each year. 2014 was the highest first month production but also the highest decline rate. Note that on the first month 2014 production is 29 barrels per day above 2013 1st month and 131 barrels per day above 2008 1st month. But the 2014 10th month was 7 bpd below the 2013 10th month. And by the 13th month only 7 barrels per day separated the 2008 data and the 2013 data.
Bottom line is, though the new wells produce more, they decline a lot faster.
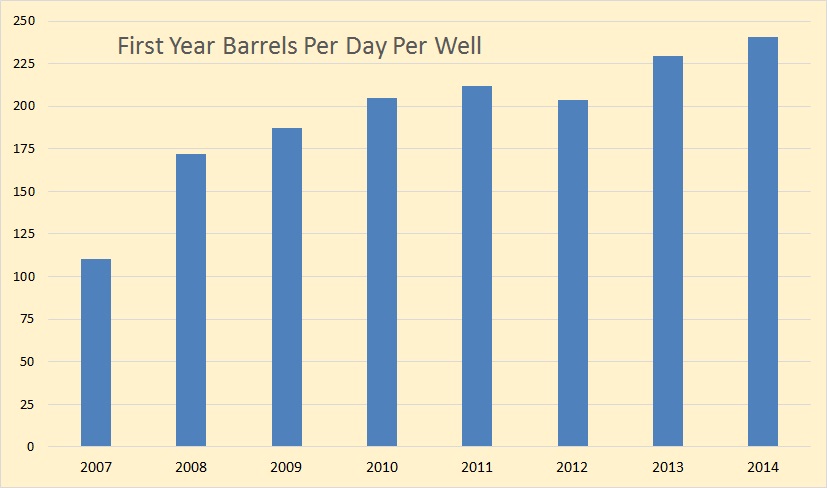
Barrels per day per well, for the entire year, discarding the first partial month and measuring the 2nd through 13th month, averaged 230 BPD for 2013 and 241 BPD for 2014. The first-year barrels per day per well has increased every year except for 2012.
Read More