Climate Variability vs AGW

Emissions of CO2 from burning fossil fuel contributes significantly to a gradual increase in the world’s average temperature.  What’s also known but less understood is the erratic variation in the average temperature due to cycles in the ocean, resulting in episodes of El Nino and La Nina.  Some claim that these temperature extremes are well-understood as a result of changes in the trade winds, as the wind pushes the water around the Pacific ocean, exposing colder or warmer water to the surface. This may have been a perfectly acceptable explanation, except it doesn’t address what causes the wind to vary — in other words the source of the erratic wind variation is just as unknown.

So we are still left with no root cause for the ocean cycles. Apart from the strictly seasonal changes we have no explanation for the longer-term pattern of natural variation observed.

Read More
Arguments over RCP8.5

The climate change scientific consensus is summarized via the annual IPCC documents. In one of the IPCC sections, projections of CO2 emissions from fossil fuel usage are made in the context of several scenarios, which are referred to as Representation Concentration Pathways (RCP).  Historically, the “business-as-usual” pathway was declared to be RCP8.5.

That has worked out as describing an extreme emission scenario IF society did not take corrective action in reducing emissions. In other words, RCP8.5 tracks a growth path in fossil fuels that is extrapolated from the current economic growth rate and largely dead-reckoned FF production increases.

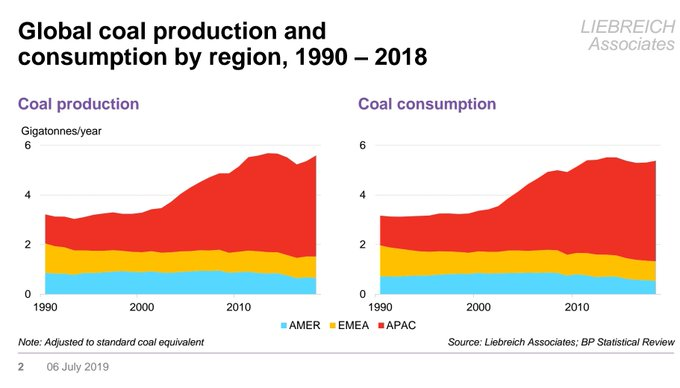
Recently an energy analyst named Michael Liebreich challenged this assumption in the context of the possibility of greater fossil fuel depletion than is currently mapped out in the IPCC, calling the RCP8.5 estimate “bollox” in a tweet.  When challenged on this assertion, he rationalized his claim as follows:

“Here’s why I reject scare stories based on RCP 8.5 and SSP5. They assume a vast increase in coal use in the absence of more international cooperation on climate. But the reality is that it coal power is peaking already. Climate change is scary enough, we don’t need ghost stories.”

— Michael Liebreich (@MLiebreich) August 4, 2019

Read More

World Energy 2018-2050: World Energy Annual Report (Part 1)

Guest Post by

Dr. Minqi Li, Professor
Department of Economics, University of Utah
E-mail: minqi.li@economics.utah.edu
June 2018

This is Part 1 of the World Energy Annual Report in 2018. This author has developed world energy annual reports that have been posted at Peak Oil Barrel since 2014. The purpose of this Annual Report is to provide updated analysis of the current development of world energy production and consumption, consider possible scenarios of world energy supply over the 21st century, and evaluate their implications for global economic growth and climate change. This year’s Annual Report includes multiple parts:

Part 1 World Energy 2018-2050
Part 2 World Oil 2018-2050
Part 3 World Natural Gas 2018-2050
Part 4 World Coal 2018-2050
Part 5 Global Carbon Dioxide Emissions and Climate Change 2018-2100

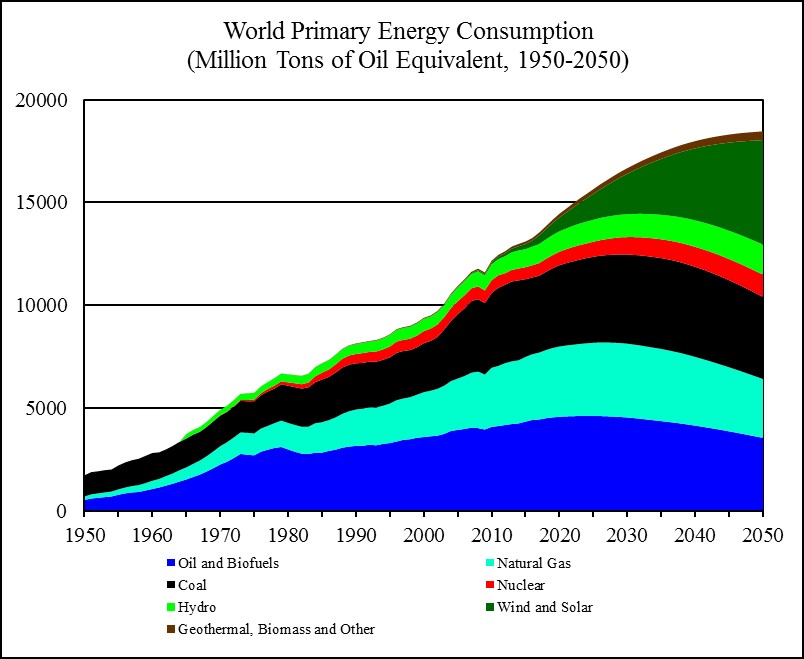
Part 1 summarizes the general findings of this year’s World Energy Annual Report. Given the currently available information, world oil production is projected to peak in the early 2020s, world natural gas production is projected to peak in the 2030s, and world coal production is projected to peak in the late 2020s. Wind and solar power is projected to grow rapidly and account for about one-third of the world energy supply by the mid-21st century. Despite the rapid expansion of renewable energies, global energy supply and economic growth are expected to decelerate over the coming decades. By the mid-21st century, the energy-constrained global economic growth rates may not be sufficient to ensure economic and political stability for the existing world system. Although world carbon dioxide emissions are projected to peak before 2030, cumulative carbon dioxide emissions over the 21st century will be sufficient to result in global warming by more than two degrees Celsius relative to the pre-industrial time (assuming there will be no large-scale carbon sequestration programs).
Read More

World Energy 2017-2050: Annual Report

A Guest post by:

Dr. Minqi Li, Professor
Department of Economics, University of Utah
E-mail: minqi.li@economics.utah.edu

This Annual Report evaluates the future development of world energy supply and its impact on the global economy as well as climate change. The report projects the world energy supply and gross world product (global economic output) from 2017 to 2050. It also projects carbon dioxide emissions from fossil fuels burning and the implied global average surface temperature from 2017 to 2100.

chart/

Figure 18
Sources: World historical oil, natural gas, and coal consumption from 1950 to 1964 is estimated from carbon dioxide emissions (Boden, Marland, and Andres 2017); world primary energy consumption and its composition from 1965 to 2016 is from BP (2017); world primary energy consumption and its composition from 2017 to 2050 is based on this report’s projections. Read More