The EIA’s Short Term Energy Outlook is out. The data is in million barrels per day.
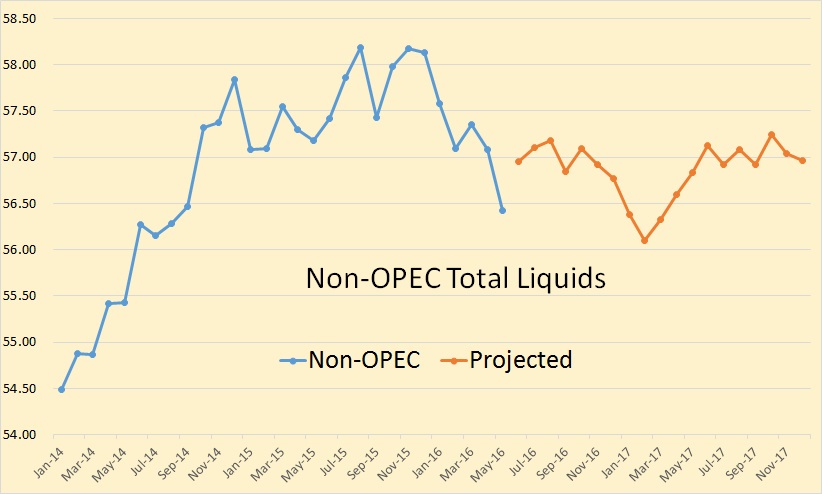
Not much has changed in the EIA’s projection since last month, however their projection for the remainder of this year and next year has increased slightly.
The EIA’s Short Term Energy Outlook is out. The data is in million barrels per day.

Not much has changed in the EIA’s projection since last month, however their projection for the remainder of this year and next year has increased slightly.
The Baker Hughes International Rig Count is out.
The rig count data in all charts below is through February 2016.
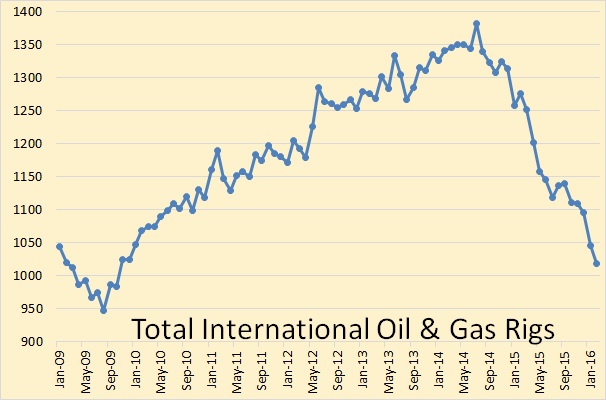
The Baker Hughes International Rig Count does not include the US, Canada, any of the FSU countries or inland China. It does include offshore China. That rig count peaked in July 2014 at 1,382 rigs and in February stood at 1,018, down 364 rigs from the peak.
The IEA Oil Market Report, full issue, is now available to the public. Some interesting observations:
Non-OPEC oil supplies are nevertheless seen sharply lower in December. Overall supplies are estimated to have slipped by more than 0.6 mb/d from the month prior, to 57.4 mb/d. A seasonal decline in biofuel production, largely due to the Brazilian sugar cane harvest, of nearly 0.4 mb/d was the largest contributor to December’s drop. Production in Vietnam, Kazakhstan, Azerbaijan and the US was also seen easing from both November’s level and compared with a year earlier. Persistently low production in Mexico and Yemen were other contributors to the year-on-year decline.
As such, total non-OPEC liquids output slipped below the year earlier level for the first time since September 2012. A production surge in December 2014 inflates the annual decline rate, but the drop is nevertheless significant should these estimates be confirmed by firm data. Already in November, growth in non-OPEC supply had slipped to 640 kb/d, from as much as 2.9 mb/d at the end of 2014, and 2.4 mb/d for 2014 as a whole. For 2015, supplies look likely to post an increase of 1.4 mb/d for the year, before contracting by nearly 0.6 mb/d in 2016. A prolonged period of oil at sub-$30/bbl puts additional volumes at risk of shut in as realised prices fall close to operating costs for some producers.
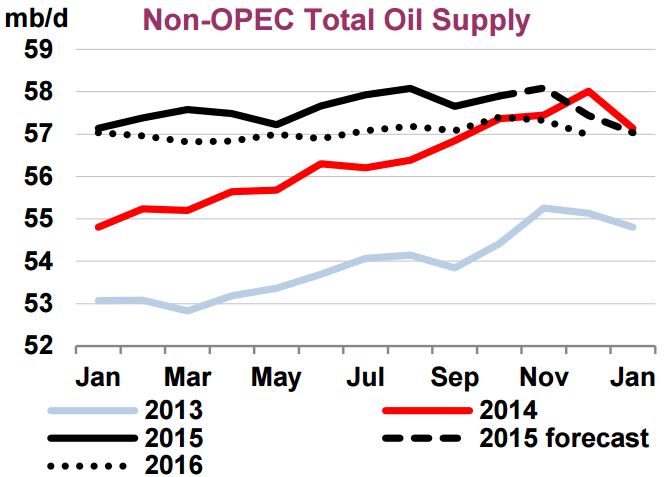
The IEA has every month of 2016 Non-OPEC production below the year over year 2015 production.
The EIA’s Monthly Energy Review just came out. They have the U.S. production numbers through December along with World, OPEC C+C, Non-OPEC and selected Non-OPEC nations through October. All EIA data is in thousand barrels per day.
Notice: When I use the term “peaked” below, I am referring to the most recent peak, not the all time peak and not necessarily the final peak.
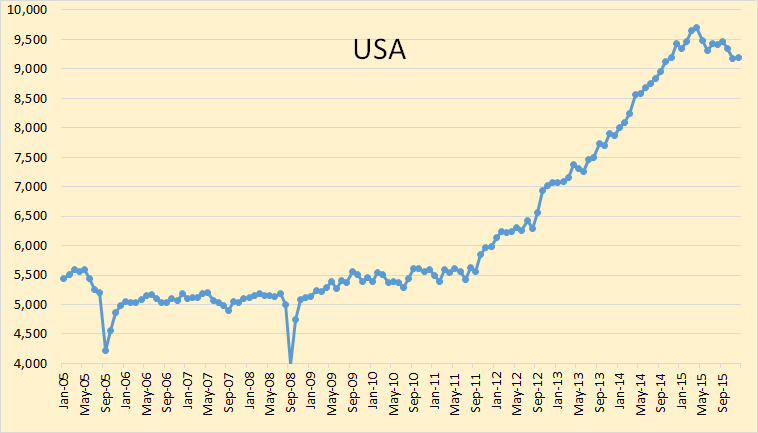
United States C+C production peaked in April at 9,694,000 bpd and has dropped half a million barrels per day by December to 9,191,000 bpd.
Dennis Coyne, an editor and frequent contributor to this blog, has suggested that we are not at peak oil. He argues that there is likely to be a dip in production starting next year but higher prices will cause things to turn around and we will surpass the 2015 peak by 2019. He commented a few days ago:
If we take some of the larger producers that have been increasing output and compare with the rest of the world(ROW) using EIA data from Jan 2004 to June 2015 (using the trailing 12 month average to focus on the trend) we see ROW decline has been relatively modest (1.4% based on the trailing 12 month output in June 2015). The eight increasing producing countries I have chosen are Brazil, Canada, China, Iran, Iraq, Russia, Saudi Arabia, and US and ROW=World minus the 8 countries just listed.
One possible scenario is that output is flat for the Big 8 in 2016 so that World C+C output falls by 485 kb/d in 2016 (average output for the year compared to the 2015 average). Over the 2009 to Jun 2015 period the Big 8 increased output at about 1300 kb/d per year, if we assume this rate slows to half the previous rate to a 650 kb/d per year increase (1.4%/year), then the peak is surpassed in 4 years in 2019. On a per country basis this would be a little more than a 80 kb/d increase in average annual output for each of these countries, though I doubt it would be divided equally.
So I have taken close look Dennis’s “Big 8” countries as well as “The Rest of the World”, and looked at their JODI data charts. The last data point is October 2015.
First, the rest of the world.
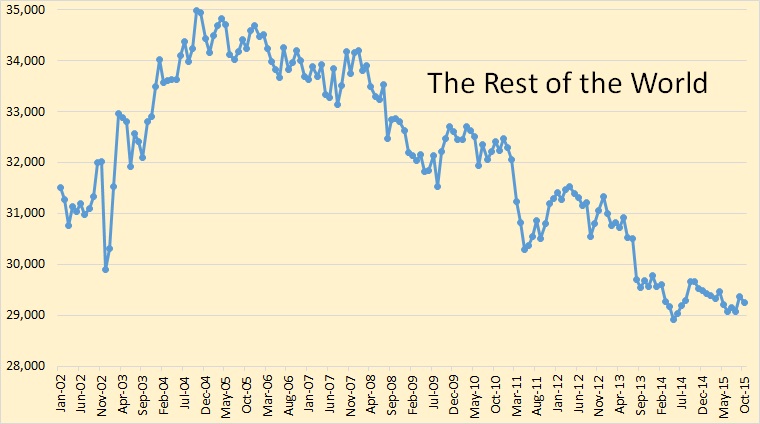
This is the world less Brazil, Canada, China, Iraq, Iran, Russia, Saudi Arabia and the USA. As a group they peaked in October 2004 and have been in decline ever since. They have declined in times of low oil prices and high oil prices. And barring a miracle they will continue to decline.