Texas RRC October Oil & Gas Report

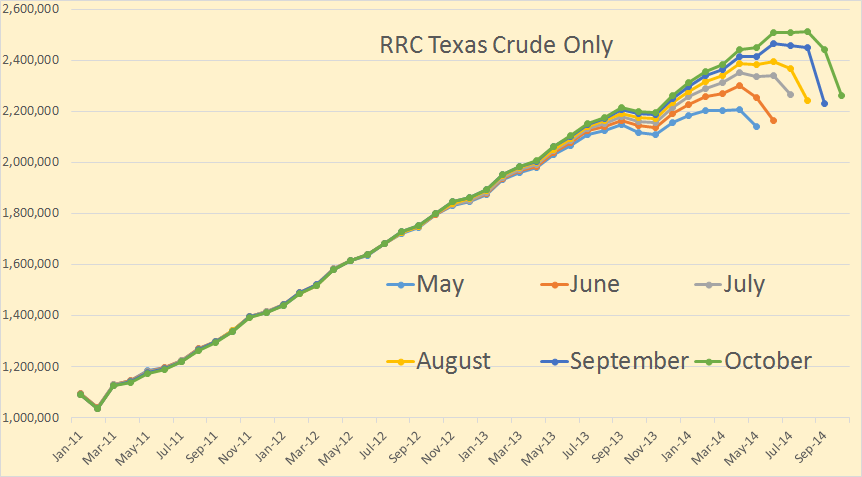
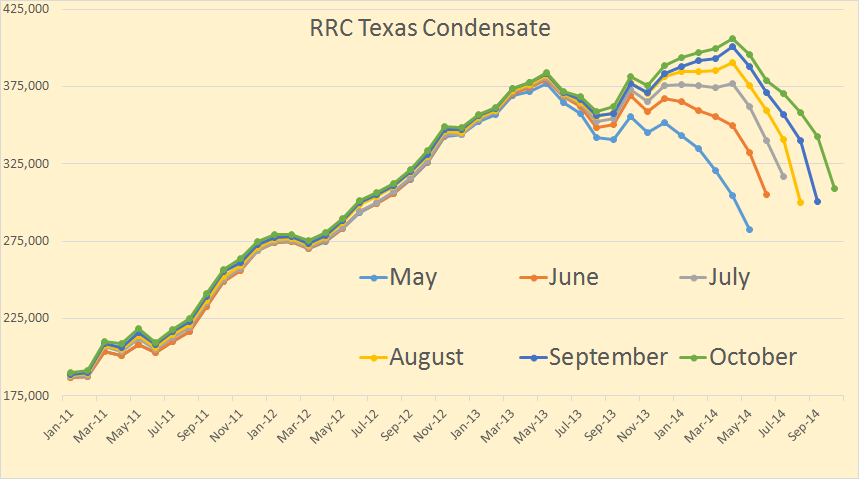
The Texas Railroad Comission has updated their Oil & Gas Production Data Query to include the production numbers for October. The Texas data is always incomplete so the charts all look like there is a big decline in the last few months. This is not the case, the charts only reflect the data that has been received and the production numbers will look a lot more positive after several months.

That being said there is something that can be gleaned from these numbers. Even though the data is incomplete, if production is increasing then last months incomplete numbers should be higher than this months incomplete numbers. Using that logic, there seems to have been a strong slowdown in Texas oil and gas production.

All the last data points are October and is in barrels per day.

Texas Crude Only

In June and July there was a strong increase in production reported to the Tesas RRC by the oil companies. But in August, September and October things slowed down considerably.

Texas Condensate

Texas condensate production has slowed down a lot more than crude. Most Texas condensate comes from their natural gas wells but there are a some wells in the Eagle Ford that produces mostly just condensate.
Read More

Will the Bakken Red Queen Outrun the Growth in Water Cut?

This is a guest post by Rune Likvern 
Who’s Website is: Fractional Flowa

This post presents a closer examination of actual data on Light Tight Oil (LTO) extraction, developments in water cut and Gas Oil Ratio (GOR) for some pools and individual wells in the Middle Bakken and Three Forks formations in North Dakota.

LTO extraction’s primary drive mechanism is (differential) pressure and there are some noticeable trends for LTO extraction from Bakken:

  • LTO productivity (measured as average totals by vintage) in 2014 have increased, most notably from the Middle Bakken formation which has better well productivity than Three Forks.
    There are differences to LTO productivity developments amongst the pools.
  • Water cut; generally increases as the wells ages.
    An indicator for depletion.
  • Water cut; generally increases for newer wells.
    This suggests that the areas with the highest oil saturation has been developed.
  • Gas Oil Ratio (GOR, produced and expressed as Mcf/Bbl); generally increases as the well ages.
  • What appears to characterize a Bakken sweet spot is the presence of natural fractures (favorable geology), high oil saturation and a pressure above hydrostatic pressure.

Further, this post also has a brief look into well economics and describes how well manufacturing is likely to be affected by the decline in the oil price and what this may entail if a lower oil price ($70/Bbl, WTI) is sustained.

Rune 1Figure 01: The chart above shows development in the water cut [water cut = [water/(water + LTO)] for the “average” wells by vintage in North Dakota. Produced water (brine) is transported to dedicated disposal sites.
Chart by Enno Peters.

What is fascinating about LTO wells in Bakken is that the individual wells appear to have their own “personality” when it comes to productivity, surrounding rock properties, water/oil saturation and GOR which makes well management (of close to 9,000 “personalities”) a paramount task.

This post contains in total 30 charts that hopefully are self explanatory.

Acknowledgements

This post was made possible by contributions, comments and suggestions from several professionals within the oil industry and the academia.

The invaluable talents and expertise of Enno Peters made it possible to transform the NDIC monthly production data with the formation data into spreadsheet format.

The spreadsheet format allows to sort well data by formation, pool, vintage, company and much more.

NOTE: Actual data used for this analysis are all from North Dakota Industrial Commission (NDIC). Some data are missing for some wells and after discussions, the consensus was that the presented average LTO numbers after the first 12 months should have around 5% added to account for missing data from some wells as well as adjusting for the effects from assuming all wells starts at day one of its reported first month of operation (on average each well flows for half a month during its first month of reported operation).

For wells on confidential list, data on runs was used as a proxy for production.

By adding around 5% of the presented average flows for the first 12 months and around 4% after 36 months numbers should come close to actual.

Production data for Bakken, North Dakota: Monthly Production Report Index

Formation data from: Bakken Horizontal Wells By Producing Zone

Water cut is the ratio of [produced water/(produced water + produced oil)] and expressed as a percentage.

Water cuts for individual wells may swing from 0% to 100%, suggesting a shut in well or data not reported. For the early months of a well’s life the water cut may be influenced from water used for fracking.

The important messages from this analysis are the trends in well productivity, water cut and GOR on an aggregate level and by vintage.

For this presentation wells from two pools in Mountrail (Alger and Van Hook), McKenzie (Banks, Camp) and Williams (Squires, Todd) are presented. Hopefully these pools constitutes a good representation of developments for similar pools.

A growing portion of wells have been/are being targeted the Three Forks formation which may suggest something about remaining attractive targets to drill in the Middle Bakken.
Read More

Bakken and North Dakota Production Report

The North Dakota Industrial Commission just published their Bakken Monthly Oil Production Statistics and also their ND Monthly Oil Production Statistics.

Bakken Barrels Per Day 2

Bakken production was down 1,598 barrels per day to 1,118,010 bpd. All North Dakota production was down 4,054 bpd to 1,182,174 bpd.

From the Director’s Cut, bold mine:

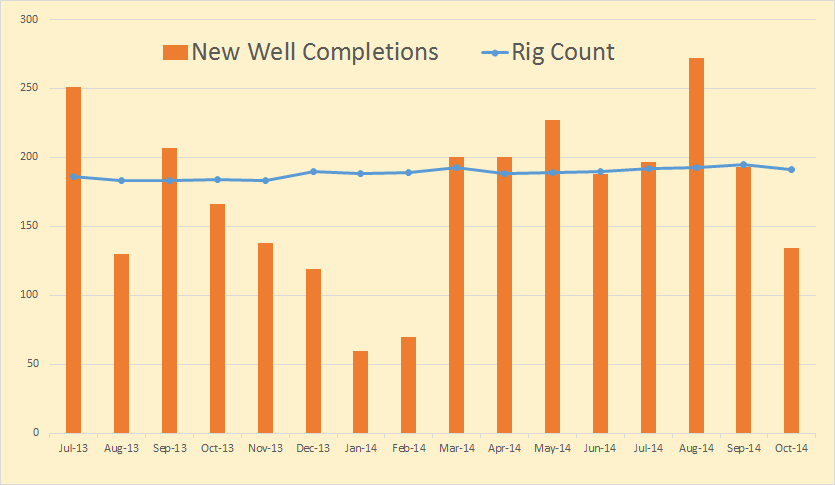
The drilling rig count dropped 2 from September to October, an additional 3 from October to November, and has since fallen 5 more from November to today. The number of well completions decreased from 193(final) in September to 134(preliminary) in October. Three significant forces are driving the slow-down: oil price, flaring reduction, and oil conditioning. Several operators have reported postponing completion work to achieve the NDIC gas capture goals. There were no major precipitation events, but there were 9 days with wind speeds in excess of 35 mph (too high for completion work).

The drillers outpaced completion crews in October. At the end of October there were about 650 wells waiting on completion services, an increase of 40.

Crude oil take away capacity is expected to remain adequate as long as rail deliveries to coastal refineries keep growing.

Rig count in the Williston Basin is set to fall rapidly during the first quarter of 2015. Utilization rate for rigs capable of 20,000+ feet is currently about 90%, and for shallow well rigs (7,000 feet or less) about 60%.

Sep rig count 193
Oct rig count 191
Nov rig count 188
Today’s rig count is 183

Sep Sweet Crude Price = $74.85/barrel
Oct Sweet Crude Price = $68.94/barrel
Nov Sweet Crude Price = $60.61/barrel
Today Sweet Crude Price = $41.75/barrel (lowest since March 2009)

I just checked Rig Count. It now stands at 181 but one of them is drilling a salt water disposal well. So they have 180 rigs drilling for oil right now.

Bakken Wells Producing

Bakken wells producing increased by 118 to 8,602 while North Dakota wells producing increased by 92 to 11,507. Since Bakken wells are included in the North Dakota count this means at least 26 wells outside the Bakken had to be shut down.
Read More

Did Peak Oil Arrive in 2014?

The recent price crash in crude oil, if it lasts for any length of time, will certainly affect oil production. The question is, just how great an effect will it have an how soon? But in this post I want to concentrate on what is, or was, happening to world oil production even before the price crash.

Russia, the largest producer of crude oil in the world, will peak in 2014. There are various estimates of how fast their production will decline but best case, for Russia, puts their decline at about 2% per year. They say they are depending on the Bazhenov Shale and Arctic offshore just to keep production flat in 2015. Well that is not going to happen, not in the next few years anyway. And if prices stay in the current range it is unlikely to ever happen.

OPEC is a wild card but there is little doubt that they are producing flat out right now. Only Iran has any real any real chance of increasing production very much and that only if sanctions are lifted. Libya has already increased production significantly and could increase more but very little. With the violence still going on in Libya, there is a greater chance that their production will decline.

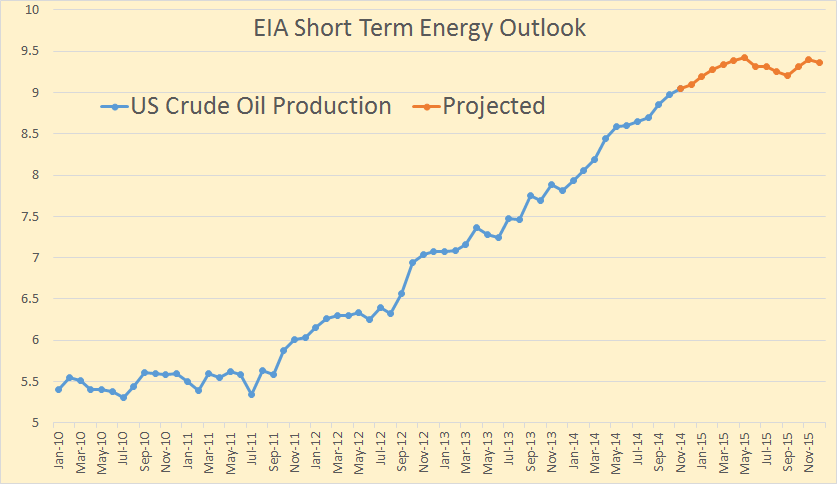
But before we go any further let’s look at what the EIA is predicting for 2015 for both the USA and the rest of non-OPEC? The below charts are from the EIA’s Short-Term Energy Outlook. Current data is through October 2014 and the projected data is through December 2015. All data is in million barrels per day. Also, very important, the data is Total Liquids which includes NGLs, bio fuels and refinery process gain. The EIA, for US production even counts refinery process gain on imported oil.

STOE USA

The EIA is predicting US average production total liquids will be up 1.49 million barrels per day in 2014 and up another 1.1 mbd in 2015. (I always use m for million and k for thousand.)

STOE non-OPEC

The EIA is predicting non-OPEC average total liquids will be up will be up 1.88 mbd in 2014 but only about half that, up .95 mbd, in 2015.

Read More

More on Bakken Production, Choke Theory

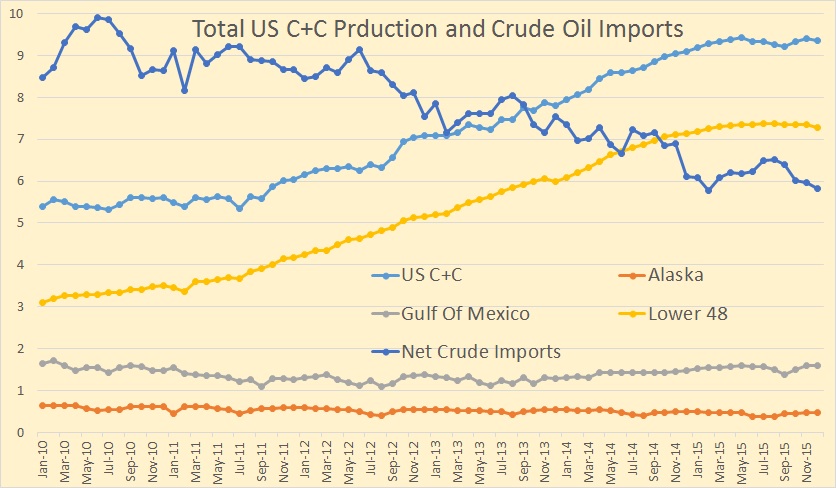
The US Petroleum Supply Monthly just came out with production data for every state and territory. US supply was up 168,000 bpd to 8,864,000 bpd in September. The biggest gainers were North Dakota, up 53,000 bpd to 1,185,000 bpd and Alaska up 79,000 to 477,000 bpd. Alaska  was way down in both July and August and are just recovering from that.  There was only one big loser, New Mexico, down 18,000 bpd. Texas was up only 9,000 barrels per day which was surprising. The Gulf of Mexico was down 3,000 bpd.

The Choke theory and why I ain’t buying it.

North Dakota publishes a Daily Activity Report Index of all permits and other well activity in the Bakken as well as the rest of North Dakota. In this report is a list of all producing wells completed as well as wells released from confidential (tight hole) status. Wells usually stay on this list from a few days to a few months, but the average is only a few weeks.

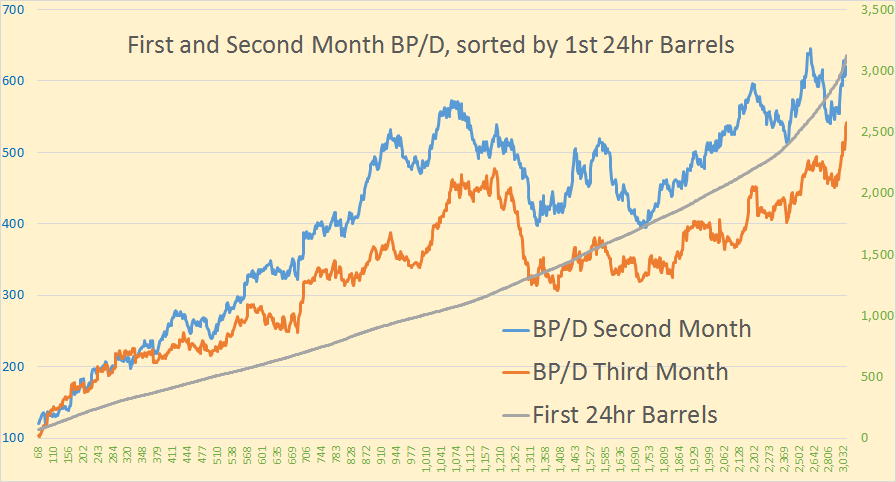
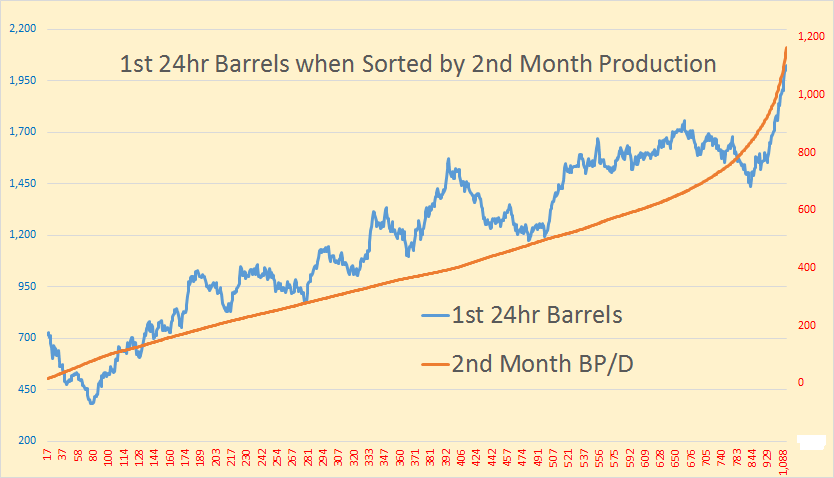
I have collected this data from October 2013 to present and found some startling results. But some have said this data means nothing, that wells are usually choked off by the driller so therefore we can gain nothing from the data. But looking at the individual wells that just doesn’t make any sense. No, I agree that the driller chokes but that he would not gradually choke more according to increasing well number.

Below I have posted the first 24 hour data for all 122 wells reported by North Dakota for the first 25 days of November. The first 24 hour production ranges from over 3000 barrels of oil per day to a low of only 10 barrels of oil per day. Barrels of water range from a high of 6663  bwpd to a low of 48 bwpd. And the percent water cut ranges form a high of 94.15% water to a low of 12.75% water.

It just seems incredible to me to claim that these numbers are meaningless. Throughout all the almost 14 months of data I have gathered there are lots of very large producing wells and a lot of small producing wells. The point is as the well number increases the number of very large producing wells seems to decrease while the number of small producing wells seems to increase. And I just don’t believe this is due to the many drillers, after checking their well number, decides what size choke to apply.

Bakken NovemberBakken November 2Bakken November 3

Just below the list of all wells I have averaged the production according to well number. The sample however is not large enough to really mean a lot. The number of wells in the sample are: Below 26000, 11 wells  – 26000s 35 wellw – 27000s 54 wells – 28000s 23 wells.
Read More