By Ovi
All of the Crude plus Condensate (C + C) production data, oil, for the US state charts comes from the EIAʼs Petroleum Supply monthly PSM which provides updated information up to March 2023.
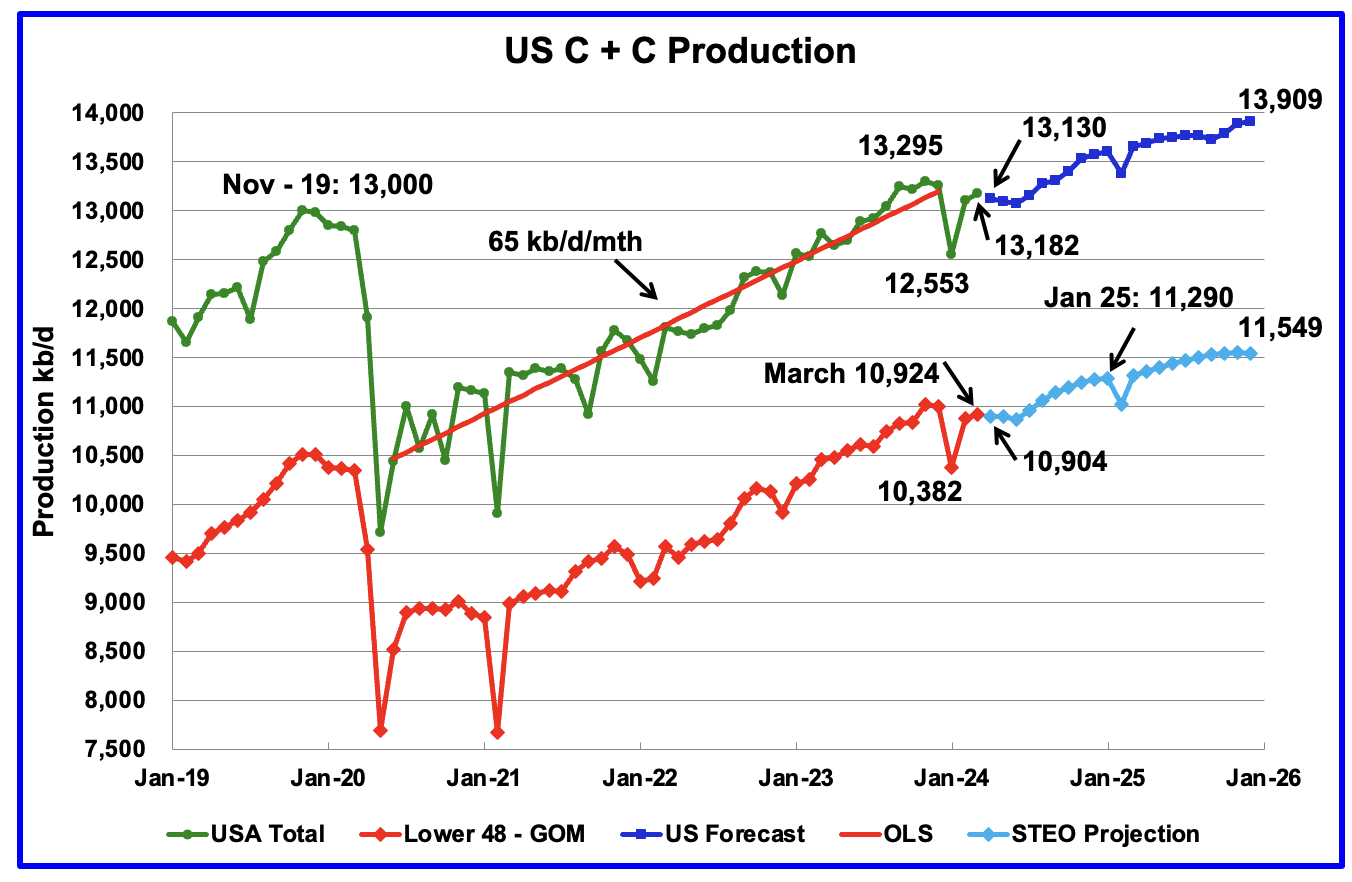
U.S. March oil production rose by 77 kb/d to 13,182 kb/d. The largest increases came from Texas, 36 kb/d and New Mexico, 32 kb/d. However relative to the EIA’s February production report, which was revised down from 13,154 kb/d to 13,105 kb/d, March production is up by 18 kb/d.
US production has been flat since September 2023.
The dark blue graph, taken from the May 2023 STEO, is the forecast for U.S. oil production from April 2024 to December 2025. Output for December 2025 is expected to reach 13,905 kb/d and is an increase of 5 kb/d from the previous STEO report. From March 2024 to December 2025 production is expected to grow by 779 kb/d. This increase is a very high growth and is not consistent with many articles predicting a near term peak in US oil production. Will the current price drop in WTI affect the next EIA’s STEO report?
The red OLS line from June 2020 to December 2023 indicates a monthly production growth rate of 65 kb/d/mth or 780 kb/d/yr. Production going forward is increasing at a slower rate.
The light blue graph is the STEO’s projection for output to December 2025 for the Onshore L48. From March 2024 to December 2025, production is expected to increase by 625 kb/d to 11,549 kb/d which is 65 kb/d higher than reported in the previous STEO.
Is the slow rollover in production shown in the last four months of 2025 in the Onshore L48 pointing to peak US production occurring in late 2025?
US Oil Production Ranked by State

Listed above are the 11 US states with the largest oil production along with the Gulf of Mexico. Ohio has been added to this table since its production approached 100 kb/d in January and exceeded Louisiana’s production. These 11 states accounted for 83.8% of all U.S. oil production out of a total production of 13,182 kb/d in March 2024.
On a YoY basis, US production increased by 412 kb/d. GOM production rose by 30 kb/d MoM while YoY it is down by 51 kb/d.
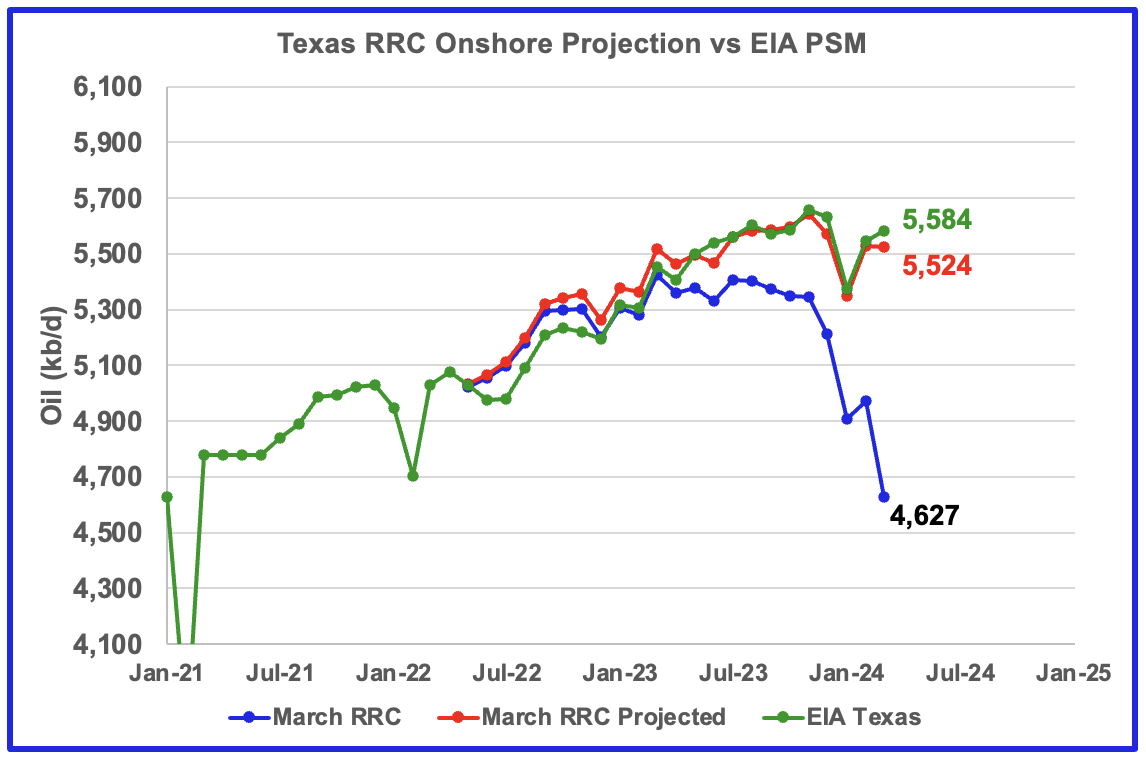
Texas production increased by 36 kb/d in March to 5,584 kb/d. YoY production is up by 130 kb/d.
The red graph is a production projection for Texas using the Texas RRC reported March production, blue graph. The projection used the difference between the March and February preliminary production data provided by the Texas RRC. The projection provides a reasonable estimate for Texas March production but is low by 1%.
It is interesting to note that February’s daily production increase of 175 kb/d was smaller than January’s drop of 258 kb/d. Could this be related to the lack of drilling or completions during those 10 freezing days in January while the rapid decline in LTO producing wells continued and is difficult to make up?
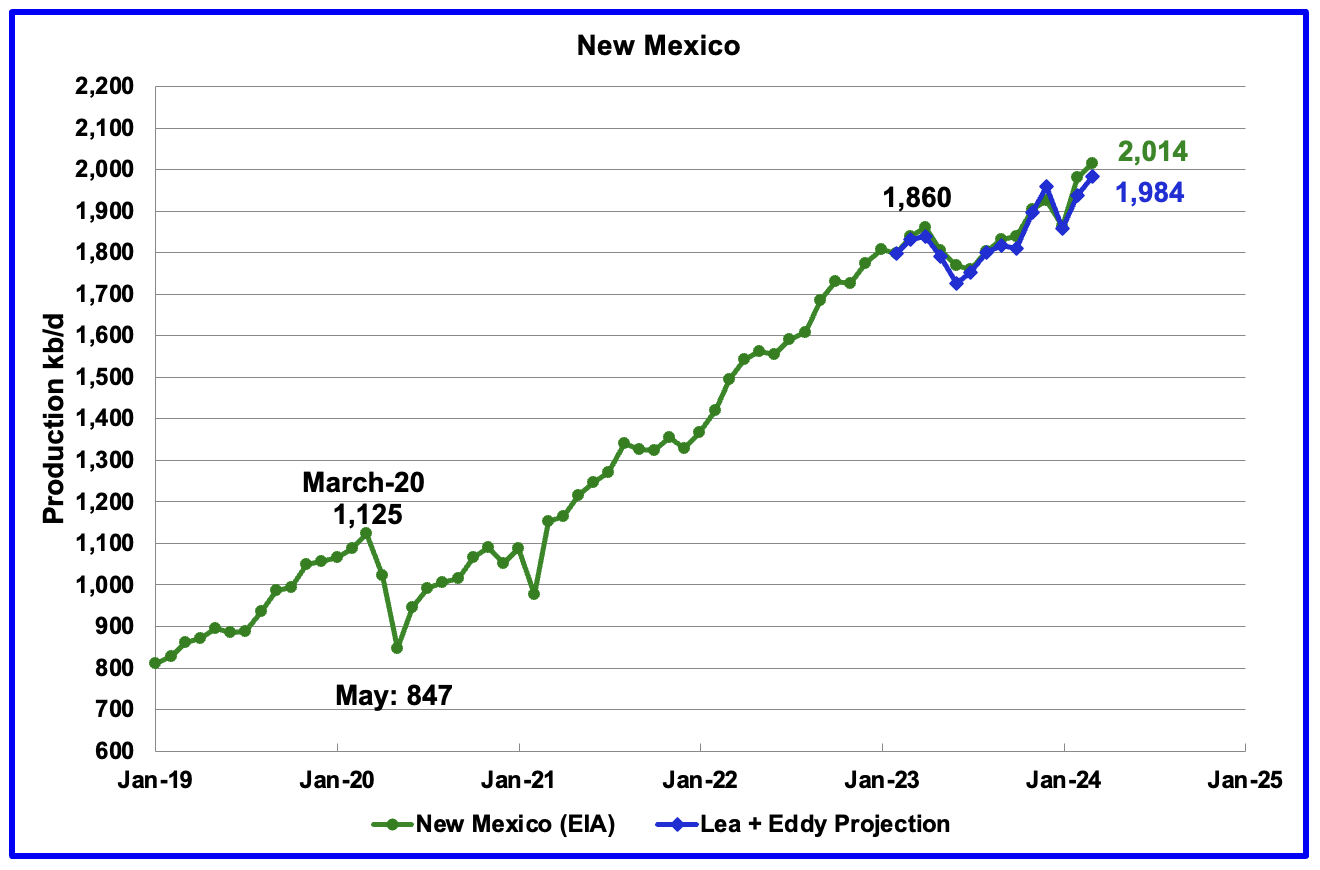
According to the EIA, New Mexico’s March production rose by 32 kb/d to a record high 2,014 kb/d.
The blue graph is a production projection for Lea plus Eddy counties since these two counties account for 98.5% of New Mexico’s oil production. The projection used the difference between February and March preliminary production data provided by the New Mexico Oil Conservation Division. The projection provides a reasonable estimate for New Mexico’s March production. A 1.5% correction was added to the Lea plus Eddy projection to account for their fraction of New Mexico production.
More oil production information from these two counties is reviewed in the special Permian section further down.
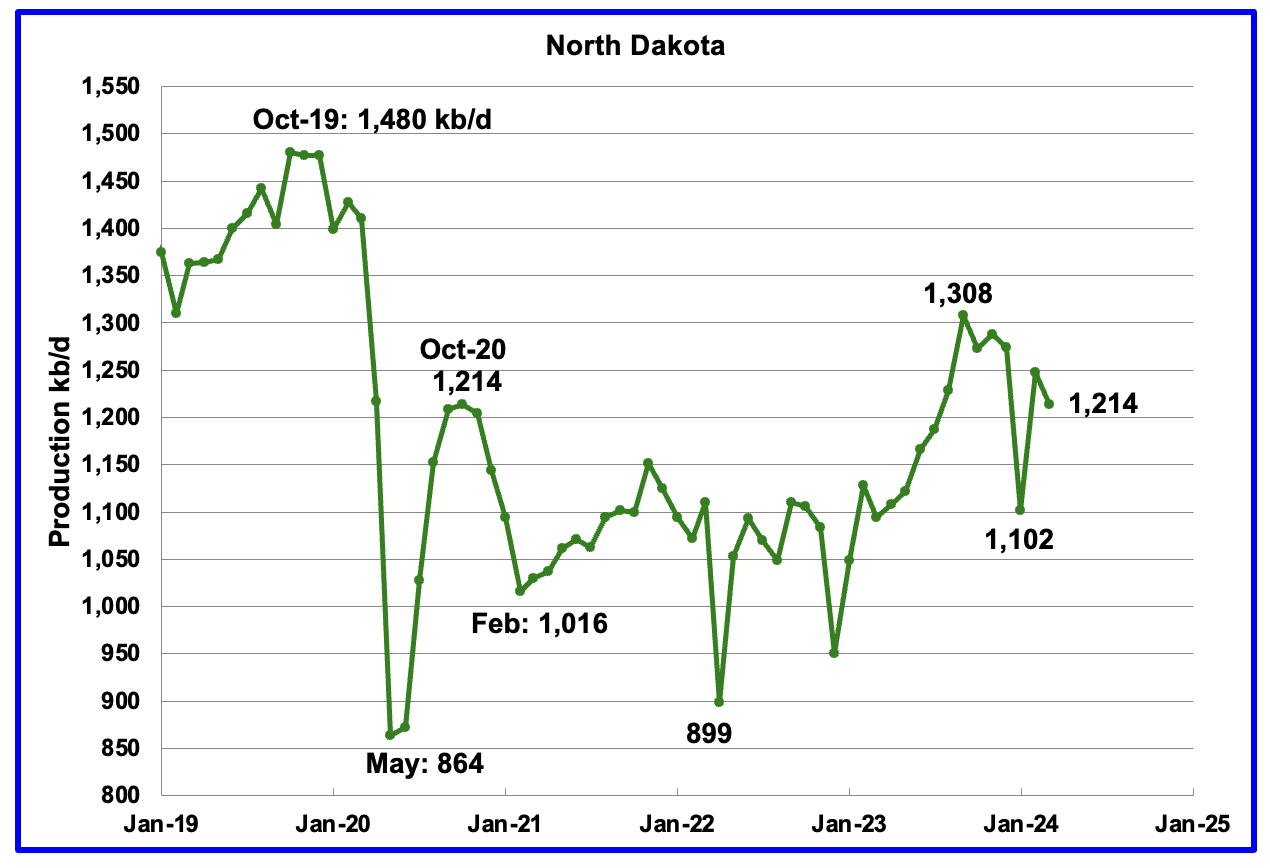
March’s output dropped by 34 kb/d to 1,214 kb/d. YoY production increased by 120 kb/d.
According to this article North Dakota’s March oil production dropped about two percent from February due to inclement weather.
“The state produced just over 1.2 million barrels per day on average.“
“We had severe winter weather that first week of March,” said North Dakota Mineral Resources director Lynn Helms. He said one of the natural gas plants — Bear Creek — went down because of power interruptions.
“We had a not of wells off,” Helms said.
Helms said March production did finish strong.
“We’re still anticipating that 1.3 million barrels per day,” Helms said. “It just seems like — month after month, we’ve had something happen.”
Helms said one bright spot was a significant increase in production in McLean County
“A well-pad with four wells, three-mile laterals, drilled by Oasis, that were brought on in December,” Helms said. “That almost doubled the McLean County production.”
It will be a difficult challenge for North Dakota to get to Helms’ 1.3 million barrels per day goal.
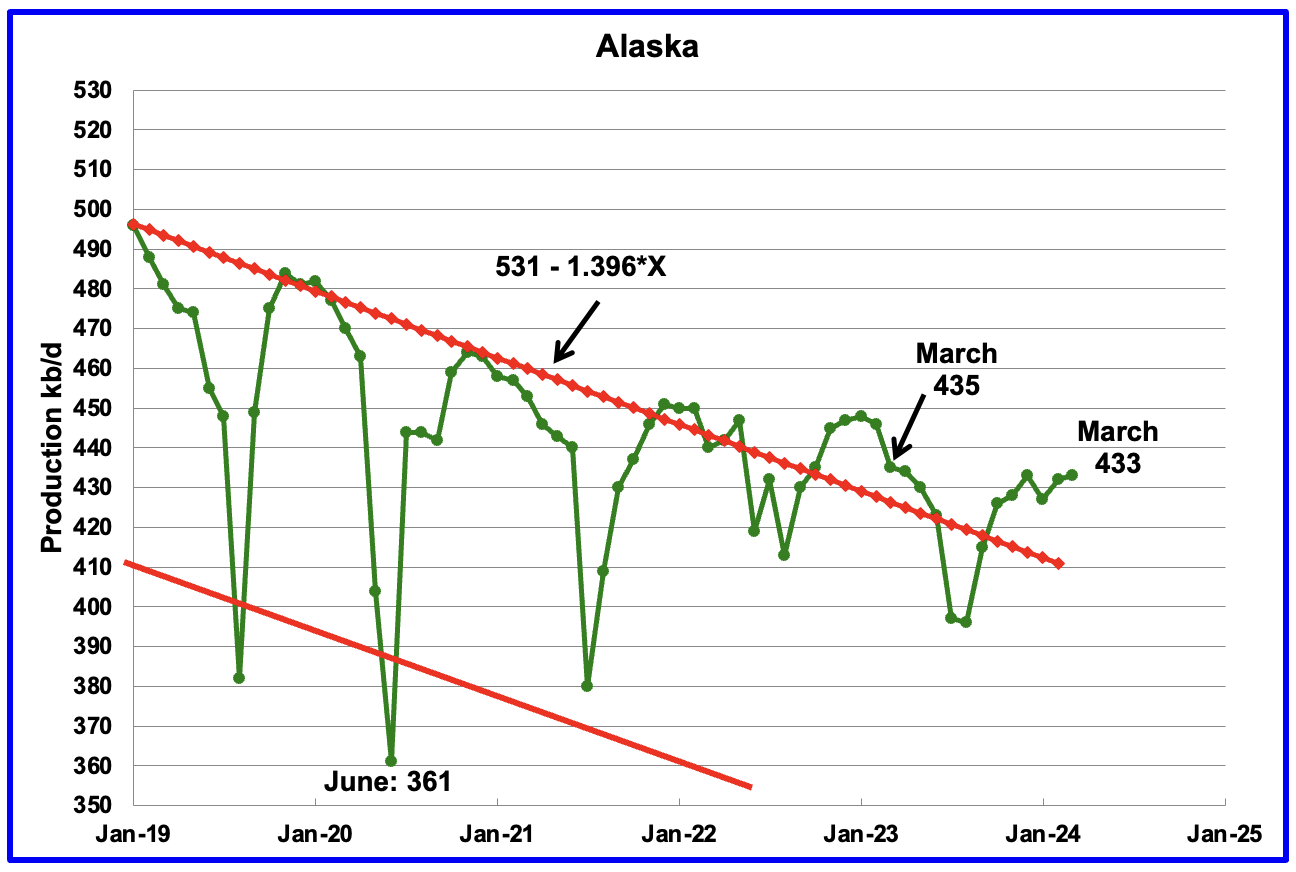
Alaskaʼs March output rose by 1 kb/d to 433 kb/d. Production YoY is down by 2 kb/d. The EIA’s weekly petroleum report continues to show Alaska’s oil production is dropping and May production is closer to 420 kb/d.
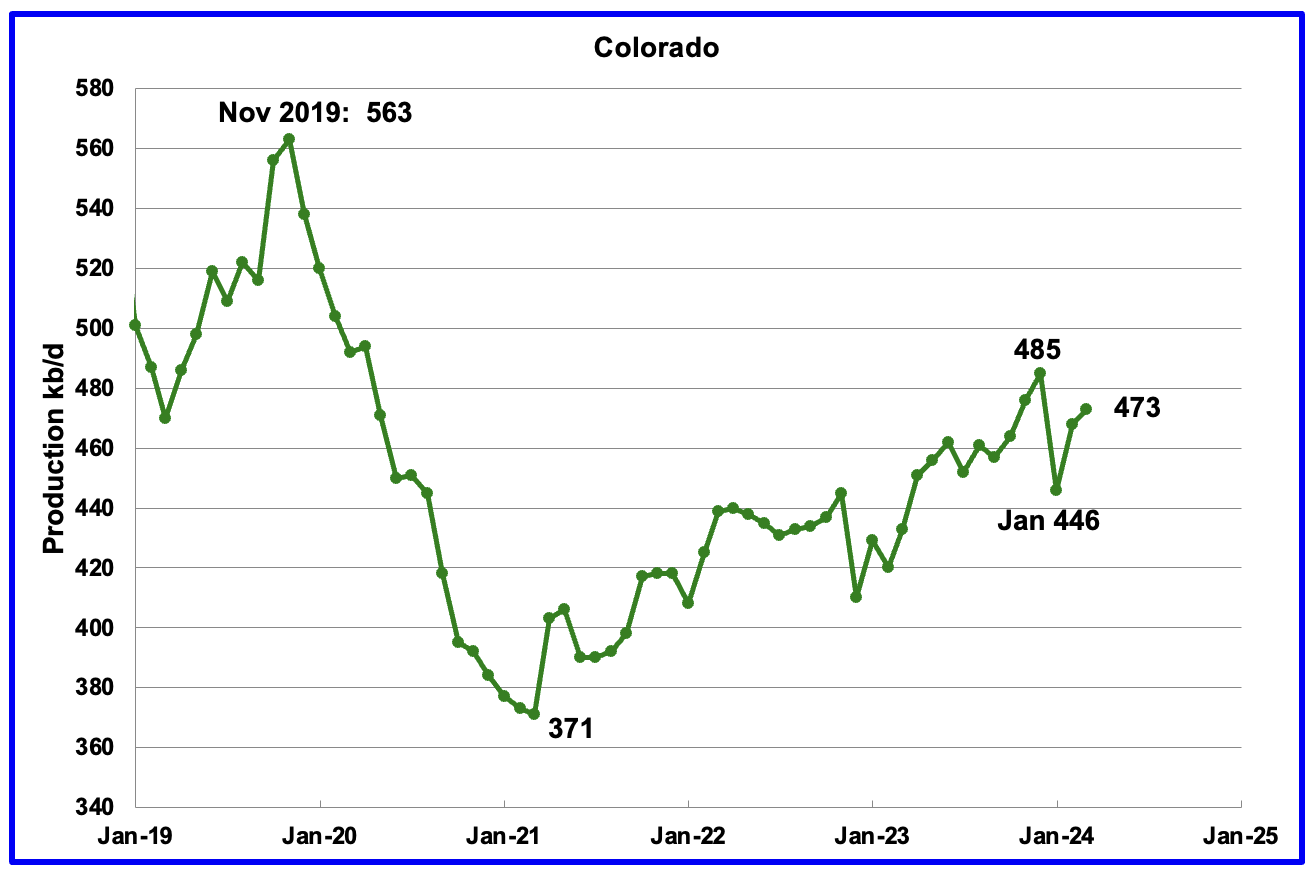
Coloradoʼs March production increased by 5 kb/d to 473 kb/d. Colorado has moved ahead of Alaska to become the 4th largest US oil producing state. Colorado began the year with 12 rigs but has now dropped to 9 during May.
Colorado’s oil producers are bracing for a new fee associated with their production as part of a compromise the industry reached with environmental groups that were pushing for more stringent regulations on drilling.
Colorado, the fourth largest oil producing state in the U.S., is a frequent battleground for the oil industry and environmentalists, who over the years have pushed for tougher regulations on fossil fuel production.
According to this article Colorado could jump-start a national push to ban new oil wells?
Colorado is weighing a major shift in its oil and gas policy, spurring a debate that could echo nationally in the push to slash greenhouse gas emissions.
Democratic state lawmakers have proposed two sweeping pieces of legislation — including what would be the first-ever statewide ban in the U.S. on all new oil and gas wells.
The bills are case studies of a rising intolerance to oil and gas production in blue states, even in a place like Colorado known for its large fossil fuel footprint.
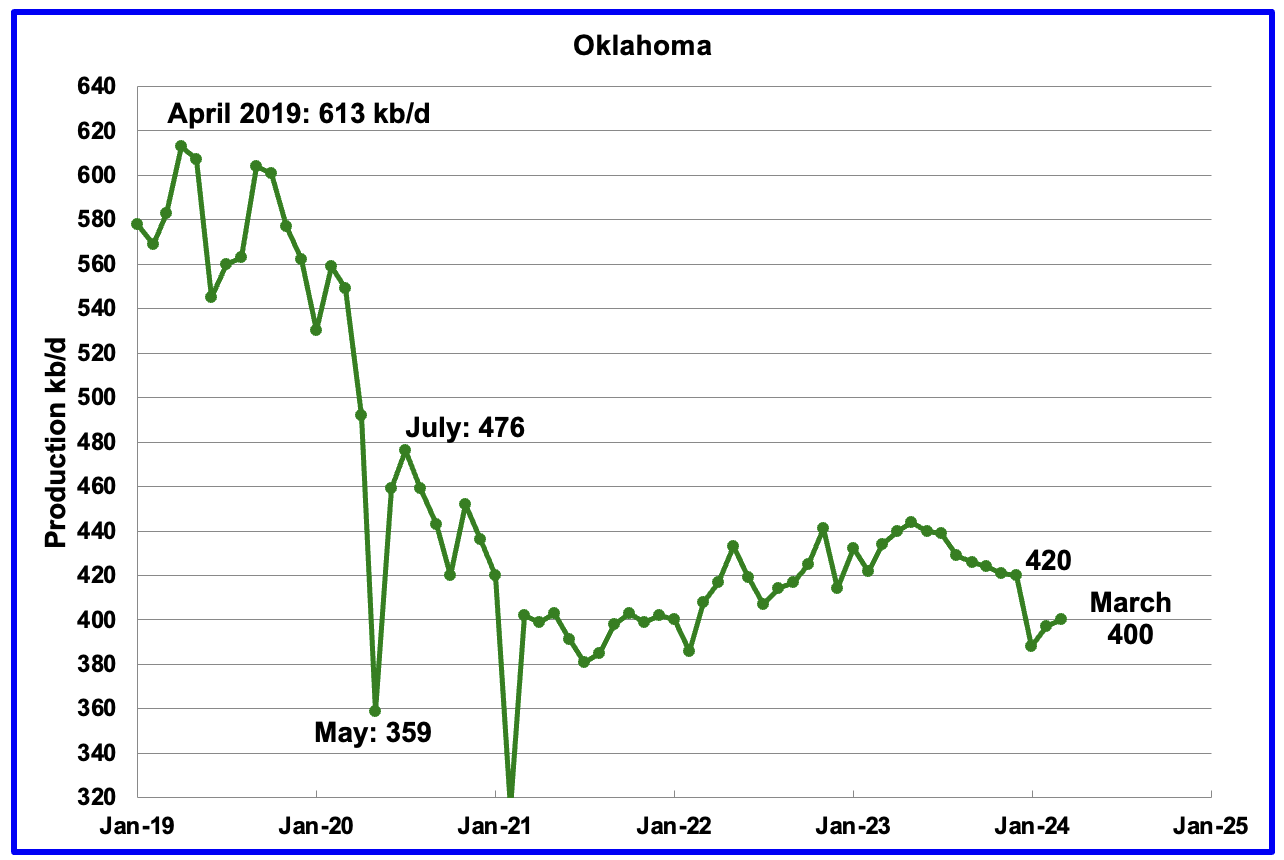
Oklahoma’s output in March rose by 3 kb/d to 400 kb/d. Production remains below the post pandemic July 2020 high of 476 kb/d. Output appears to have entered a slow declining/plateau phase. Note that January production dropped by 32 kb/d while February only rose 9 kb/d.
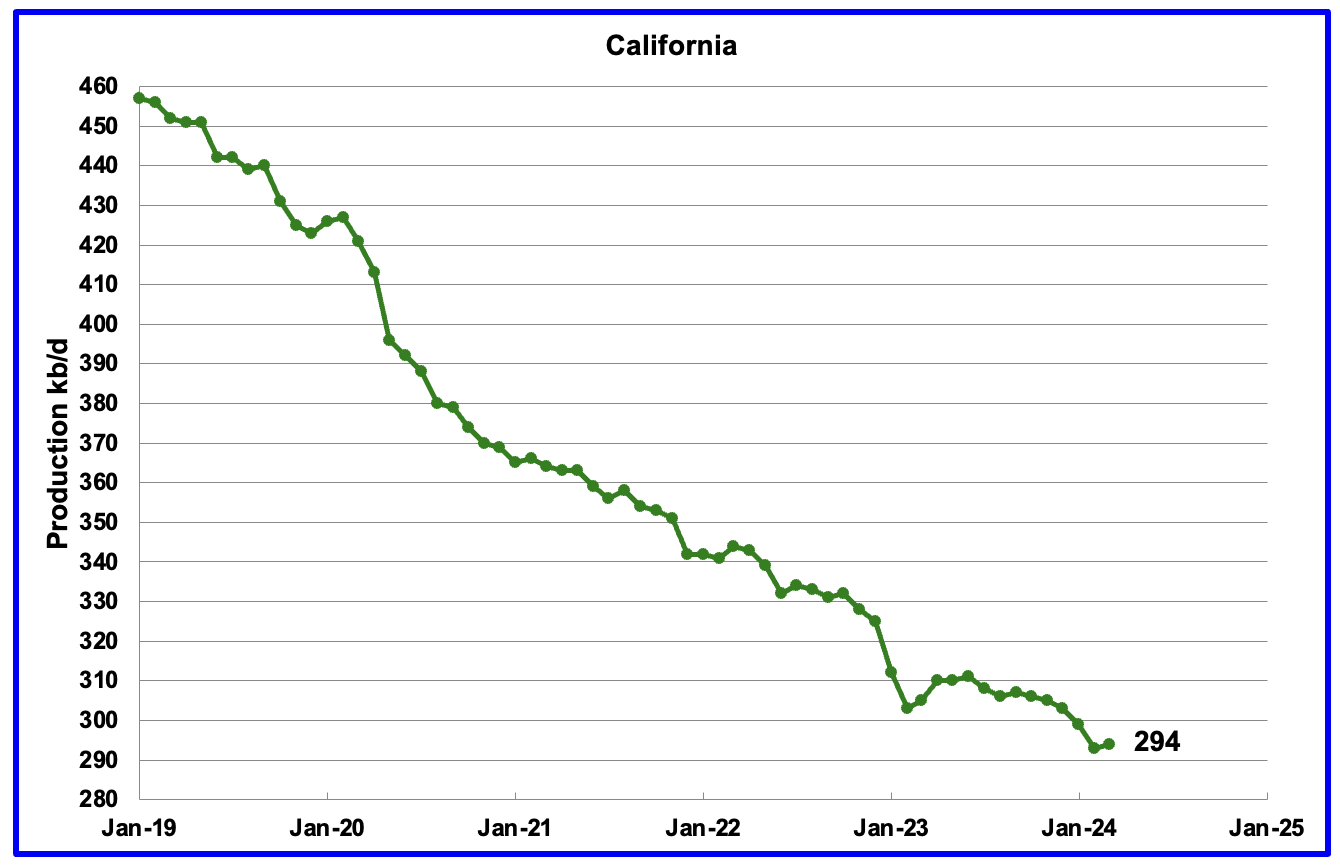
Californiaʼs March production had a slight reprieve to its slow decline by increasing by 1 kb/d to 294 kb/d. Production on average appears to be dropping at the rate of 2 kb/d/mth. From February 2021 to February 2024, production has dropped by 73 kb/d or close to 2 kb/d/mth.
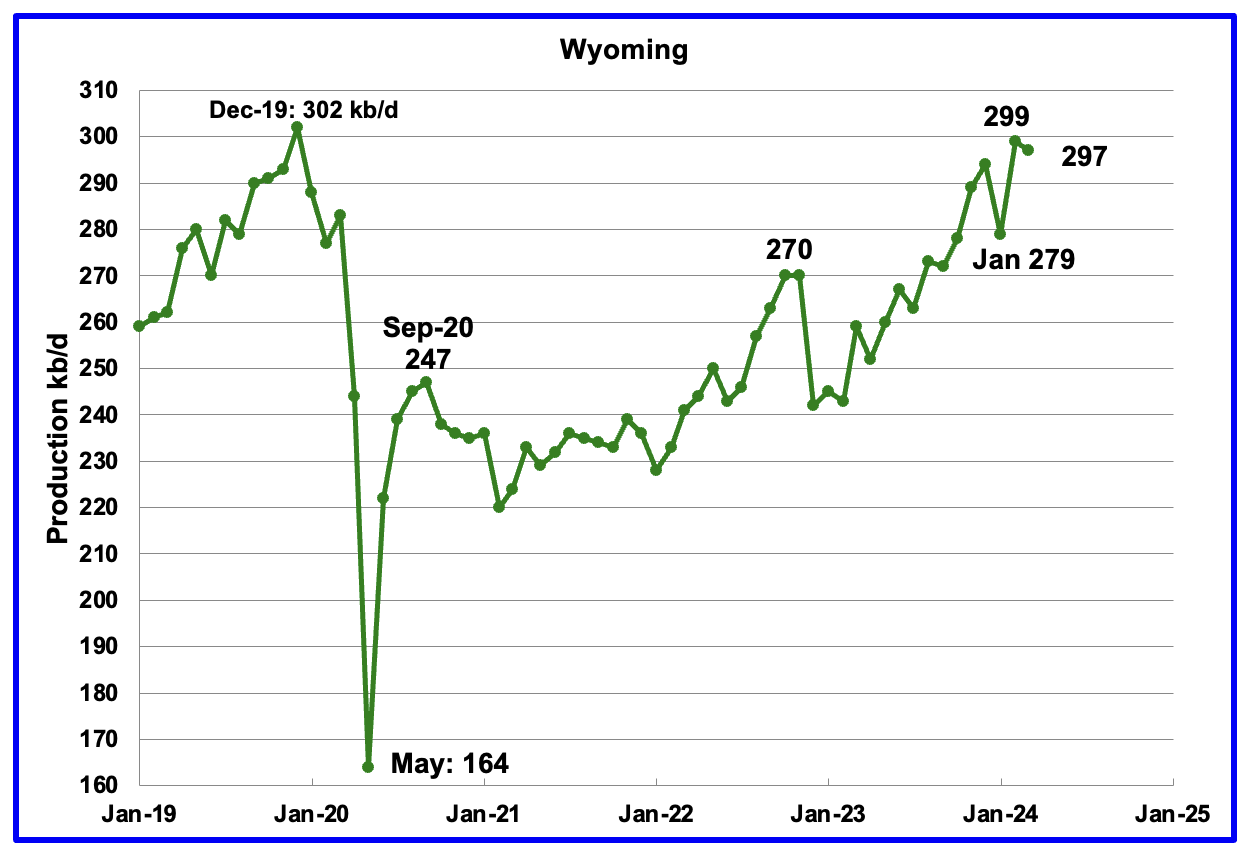
Wyoming’s oil production has been rebounding since March 2023. However the rebound was impacted by the January 2023 storm. While February’s oil production recovered from January’s drop by 20 kb/d to a new post pandemic high of 299 kb/d, March production dropped 2 kb/d to 297 kb/d.
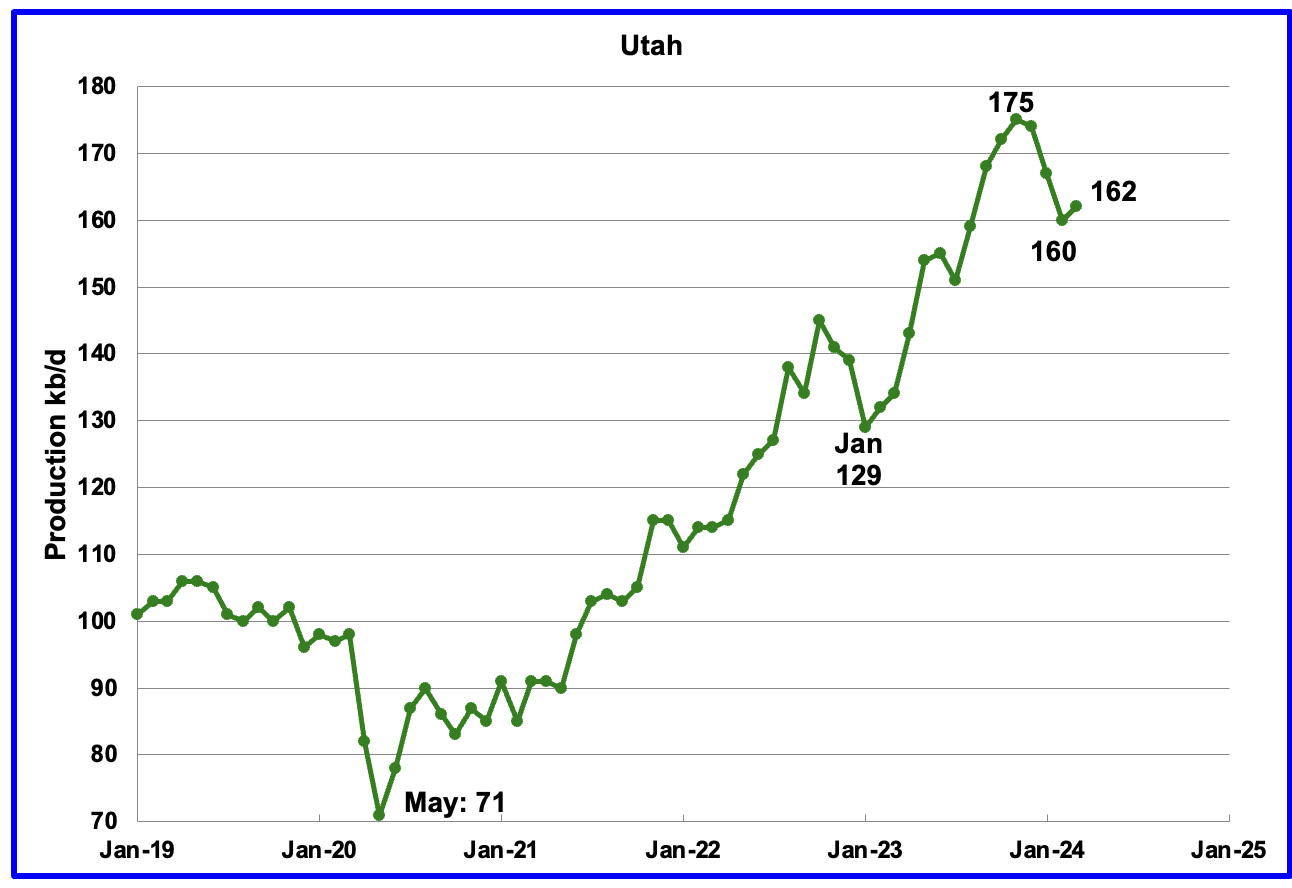
March’s production increased by 2 kb/d to 162 kb/d. For the first 5 months of 2024, Utah has had 9 oil rigs in operation. It is not clear why production dropped.
According to this article, one producer is using more proppant to increase production.
The mastermind behind Utah’s production increase is outlined in this article.
“Finley and other producers’ long-term vision for the Uinta could lead to as much as 350,000 barrels of crude oil being railed from Utah to Gulf Coast refineries every day, roughly tripling current basin production and increasing U.S. annual carbon emissions by 1%.”
The increased production since February 2023 has come from the Uinta basin.
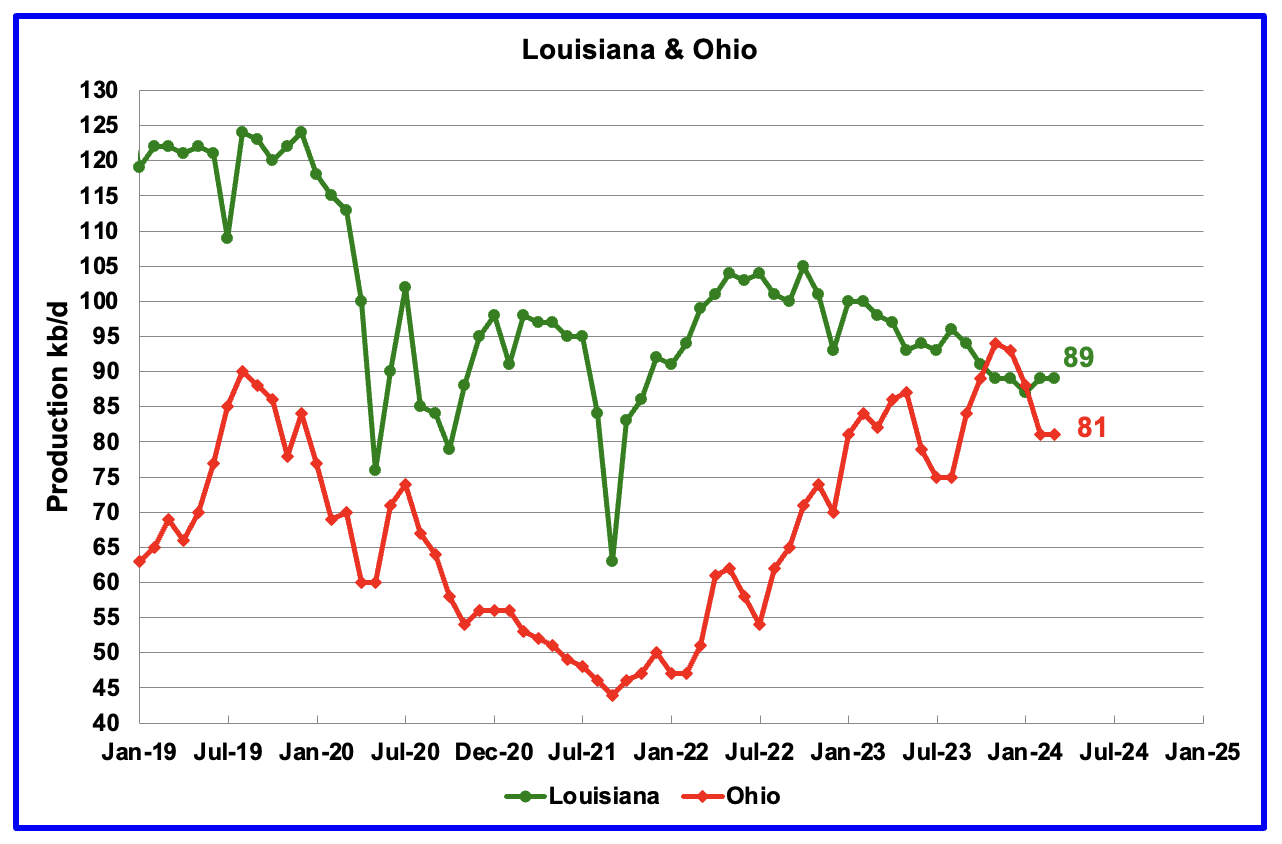
Ohio has been added to the Louisiana chart because Ohio’s production has been slowly increasing since October 2021 and passed Louisiana in November 2023.
Louisiana’s output entered a slow decline phase in October 2022. March’s production was unchanged at 89 kb/d. Ohio’s oil production was also unchanged at 81 kb/d after reaching a post pandemic high of 94 kb/d in November. The most recent Baker Hughes rig report now shows two horizontal oil rigs operating in Ohio in May.
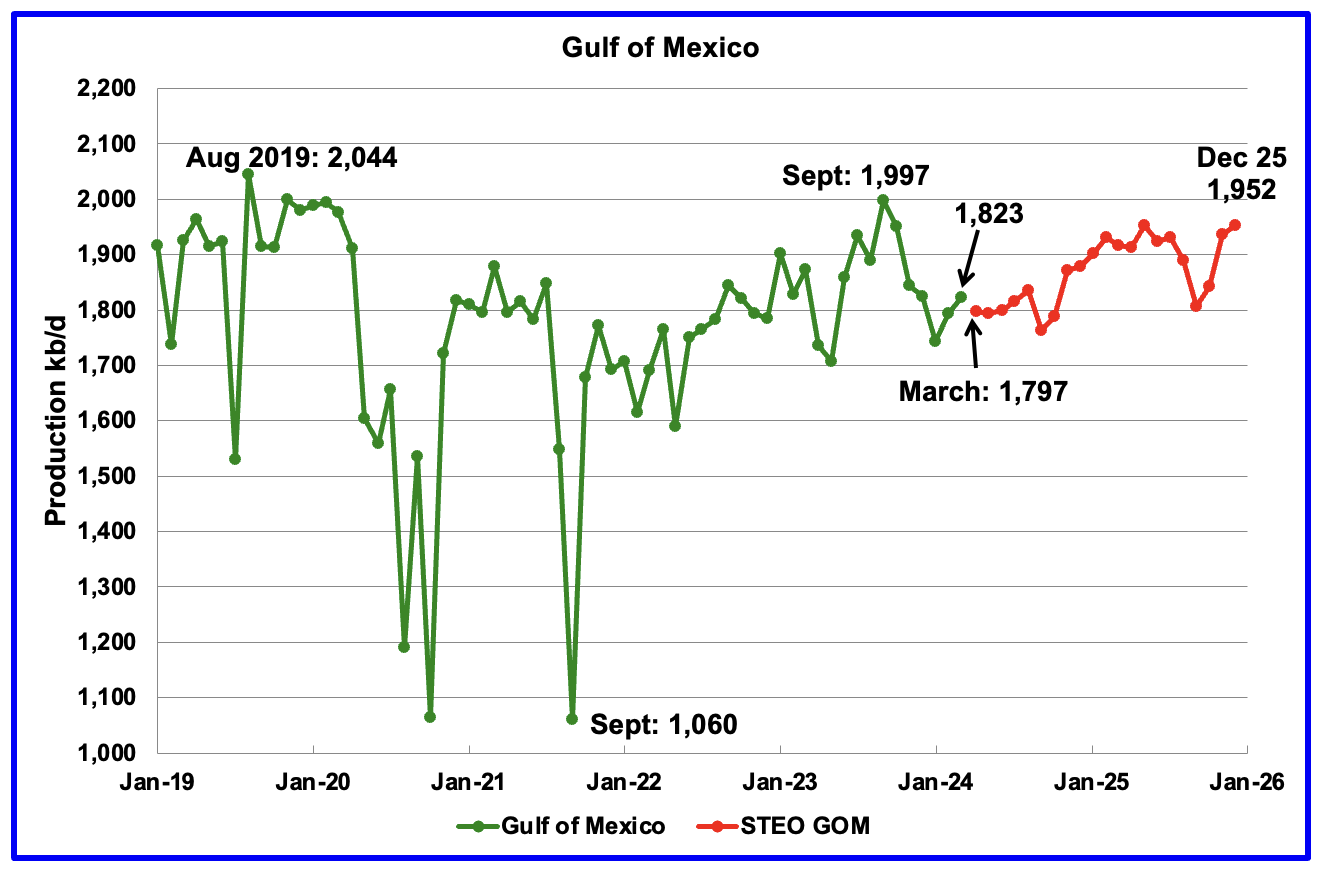
GOM production rose by 30 kb/d in March to 1,823 kb/d but is expected to drop in April by 26 kb/d to 1,797 kb/d.
The May 2024 STEO projection for the GOM output has been added to this chart. It projects production from April 2024 to December 2025 will increase by 155 kb/d to 1,952 kb/d, 60 kb/d lower than reported in the previous STEO.
A Different Perspective on US Oil Production
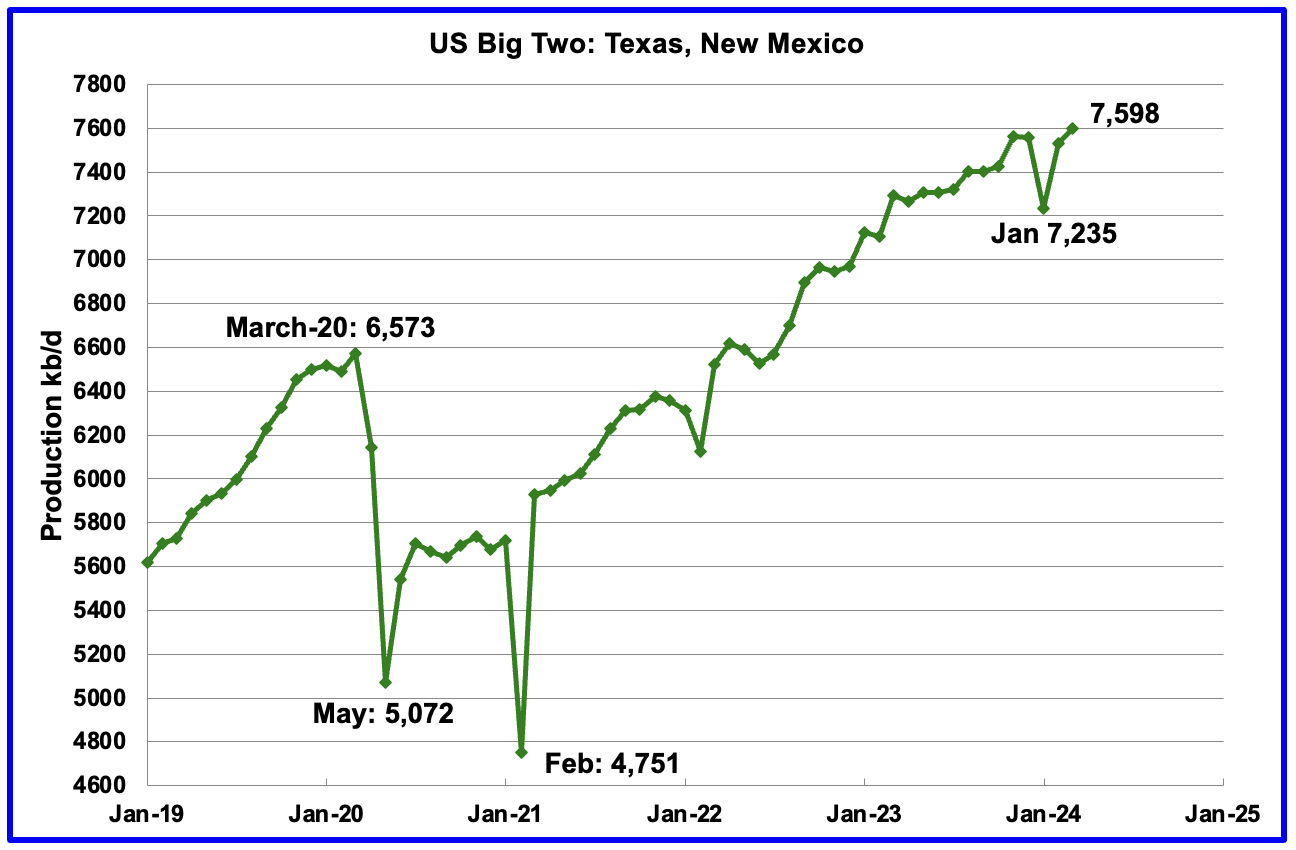
The Big Two states’ combined oil output for Texas and New Mexico.
March’s production in the Big Two states increased by a combined 68 kb/d to 7,598 kb/d with Texas adding 36 kb/d while New Mexico added 32 kb/d.
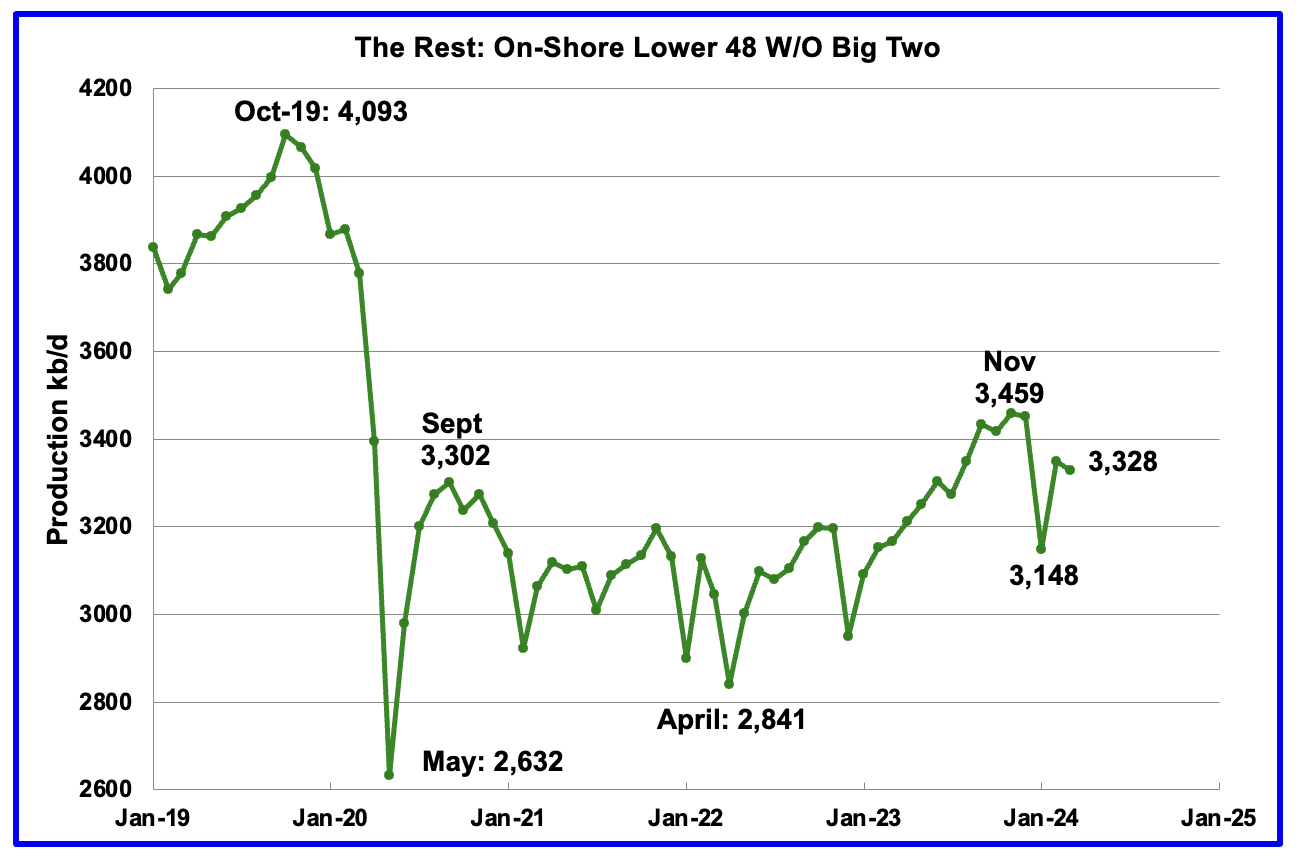
Oil production by The Rest
March’s oil production in The Rest decreased by 22 kb/d to 3,328 kb/d.
The main takeaway from The Rest chart is that current production is below the high of October 2019 and is a significant loss that occurred during the Covid shut down and will not be readily recovered.
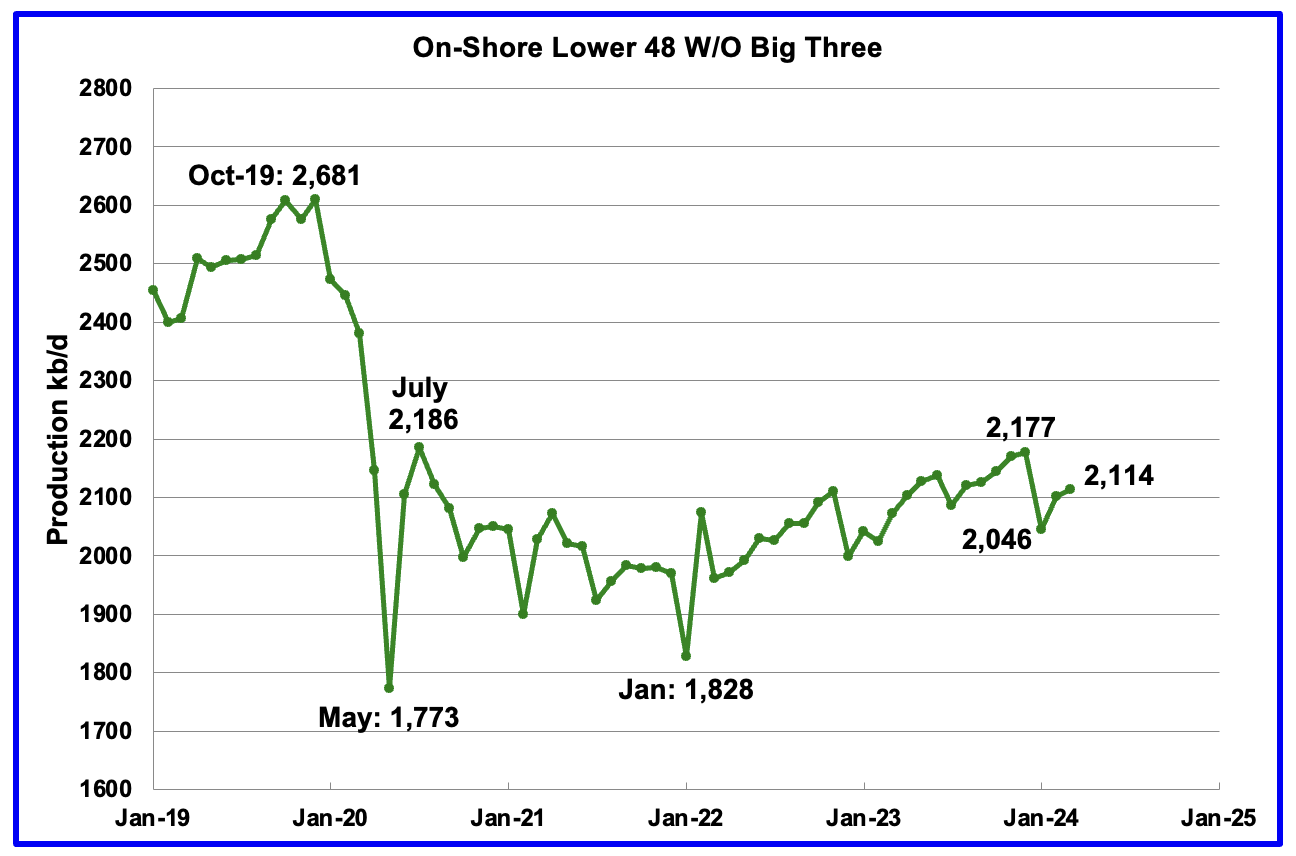
The On-Shore lower 48 W/O the big three, Texas, New Mexico and North Dakota, shows a slow rising production trend from the low of January 2022 to December 2023. March’s production increased by 12 kb/d to 2,114 kb/d.
Permian Basin Report by Main Counties and Districts
This special monthly Permian section was recently added to the US report because of a range of views on whether Permian production will continue to grow or will peak over the next year or two. The issue was brought into focus recently by the Goehring and Rozencwajg Report which indicated that a few of the biggest Permian oil producing counties were close to peaking or past peak. Also comments by posters on this site have similar beliefs from hands on experience.
This section will focus on the four largest oil producing counties in the Permian, Lea, Eddy, Midland and Martin. It will track the oil and natural gas production and the associated Gas Oil Ratio (GOR) on a monthly basis. The data is taken from the state’s government agencies for Texas and New Mexico. Typically the data for the latest two or three months is not complete and is revised upward as companies submit their updated information. Note the natural gas production shown in the charts that is used to calculate the GOR is the gas coming from both the gas and oil wells.
Of particular interest will be the charts which plot oil production vs GOR for a county to see if a particular characteristic develops that indicates the field is close to entering the bubble point phase. While the GOR metric is best suited for characterizing individual wells, counties with closely spaced horizontal wells may display a behaviour similar to individual wells due to pressure cross talking . For further information on the bubble point and GOR, there are a few good thoughts on the intricacies of the GOR in an earlier POB comment. Also check this EIA topic on GOR.
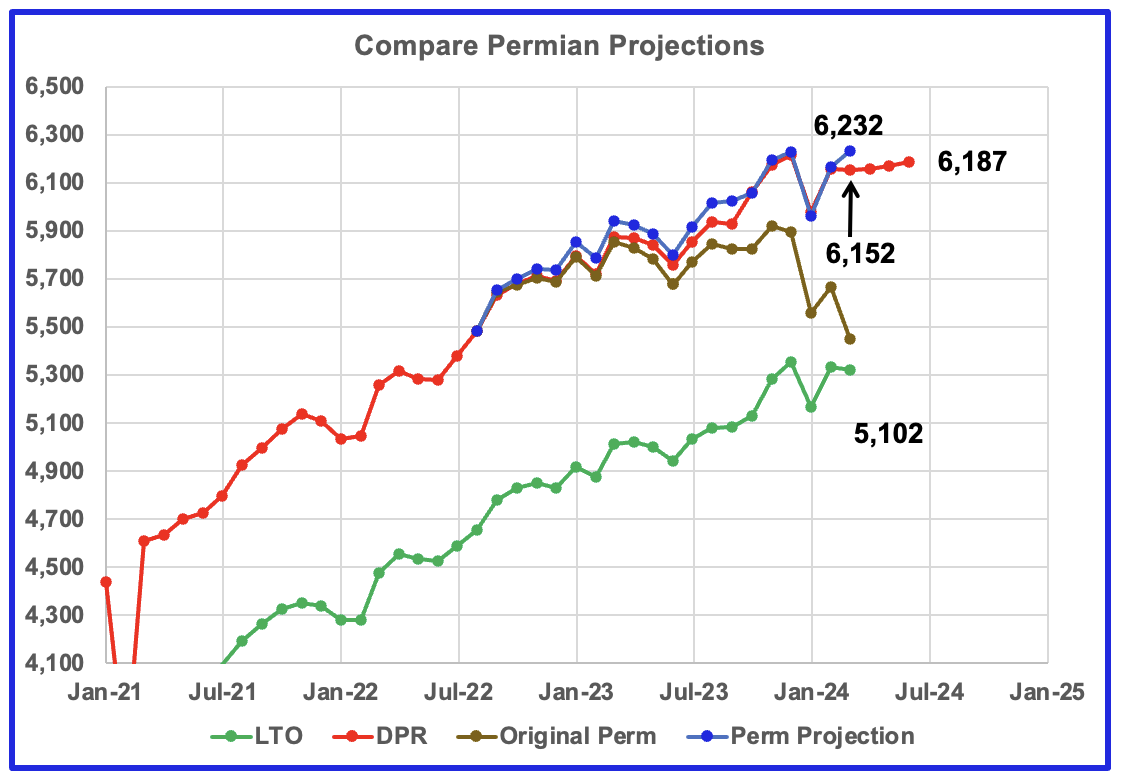
This chart shows four oil production graphs for the Permian basin updated to March and to June for the DPR. The gap between the DPR and LTO projections is there because the DPR projection includes both LTO oil along with oil from conventional wells in the basins that it covers.
The red and green graphs show oil production as published by the EIA’s DPR and the LTO offices. Comparing the two, it appears that both the LTO and DPR offices believe Permian LTO production is currently in a plateauing phase. The blue graph is a projection for Permian oil production. The brown chart is the sum of preliminary Permian production data as taken from the Texas RRC and the New Mexico Oil Conservation Division. The big January drop is due to severe weather in the central US.
The blue Permian projection graph only uses two months of preliminary production data, February and March, from the New Mexico OCD and the Texas RRC to make its March projection. The Permian projection is showing an extra 80 kb/d over the DPR production estimate for March.
The initial attempt to project the combined Texas and Permian results using the same methodology as used to project New Mexico production has not been successful. A modification has been introduced for projecting Texas results and limited back testing was undertaken. It will take a few more months of Texas data to see if the modification gives reasonable results.
New Mexico Permian
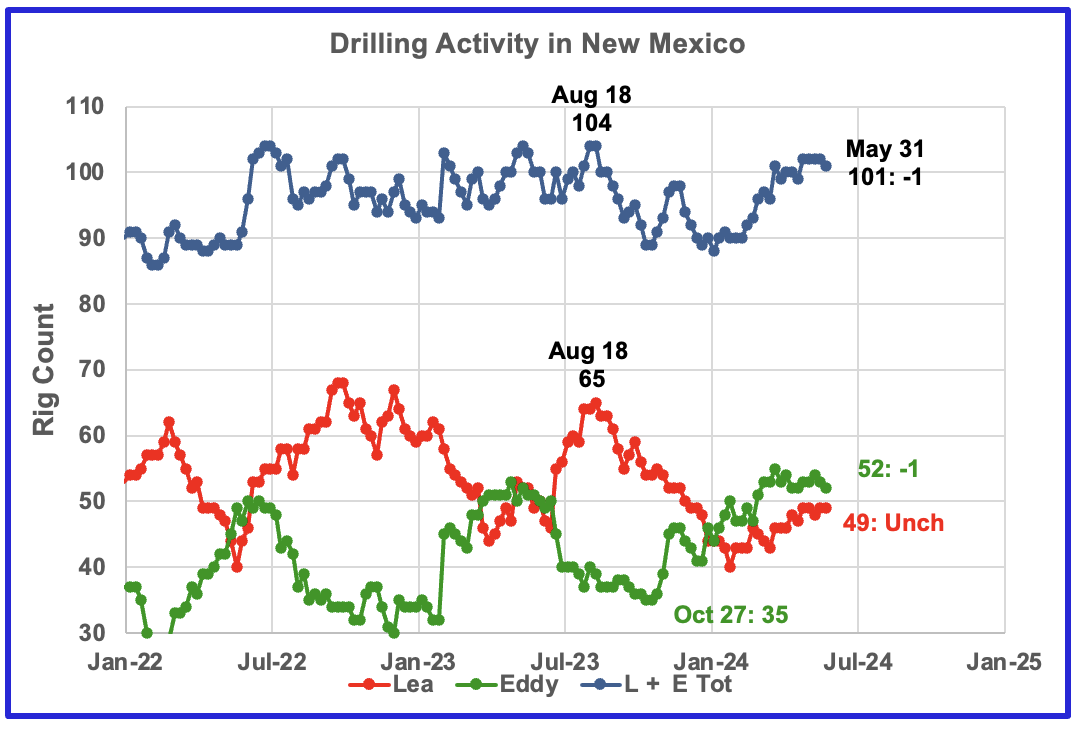
Since the middle of August 2023, the Lea county rig count has dropped from 65 rigs to 40 rigs in late January. For all of May 2024 the rig count has held steady at 49 rigs. At the same time production has increased slightly to 1,156 kb/d over the period January 2023 to February 2024. See next chart.
From a low of 35 rigs in late October 2023, 20 rigs moved into Eddy county at its peak in late March, 55. Currently 52 rigs are operating. Something is happening in Eddy county which will take at least six months to show up.
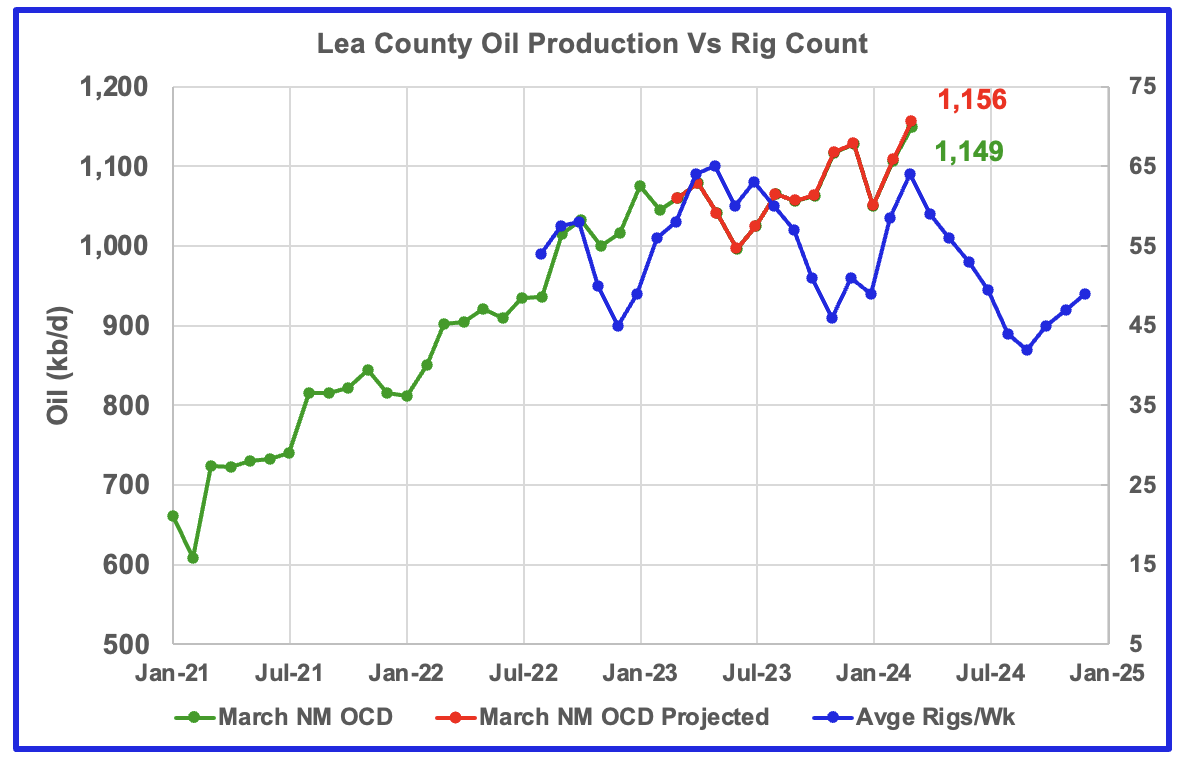
Preliminary March data indicates Lea County oil production increased by 47 kb/d to a new record high of 1,149 kb/d. A projection for March’s final production estimates it will be closer to 1,156 kb/d.
The blue graph shows the average number of weekly rigs operating during a given month as taken from the above weekly rig chart. The rig graph has been shifted forward by 7 months. So the 64 Rigs/wk operating in August 2023 have been time shifted forward to February 2024 to show the possible correlation and time delay between rig count and oil production. If the oil production were to follow the rig count going forward, oil production in Lea County should begin to drop in April or May.
Note that rig counts are being used to project production as opposed to completions because very few extra DUCs are being completed at this time.
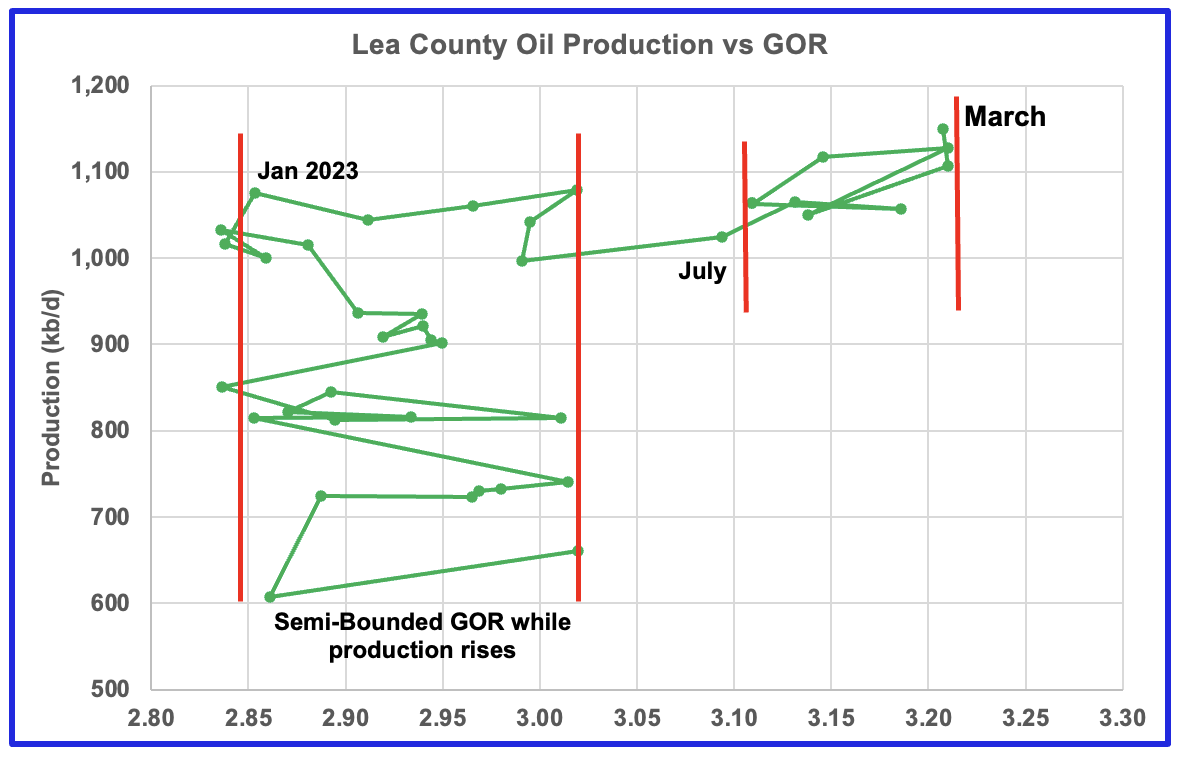
After much zigging and zagging, oil production in Lea county stabilized just above 1,000 kb/d. Once production reached a new high in January 2023, production essentially plateaued but the GOR started to increase rapidly to the right and entered the bubble point phase in July 2023.
However Lea county GOR has continued to increase as production reached a new high in March. This may indicate that the current production increase is coming from a new bench since the GOR’s behaviour since August 2023 to March 2024 time frame appears once again to be in a semi bounded GOR phase and rising production.
This zigging and zagging GOR pattern within a semi-bounded GOR while oil production increases to some stable level and then moves out to a higher GOR to the right has shown up in a number of counties. See an additional two cases below. This is the ninth month in which Lea county has registered a GOR outside the first semi-bounded GOR range.
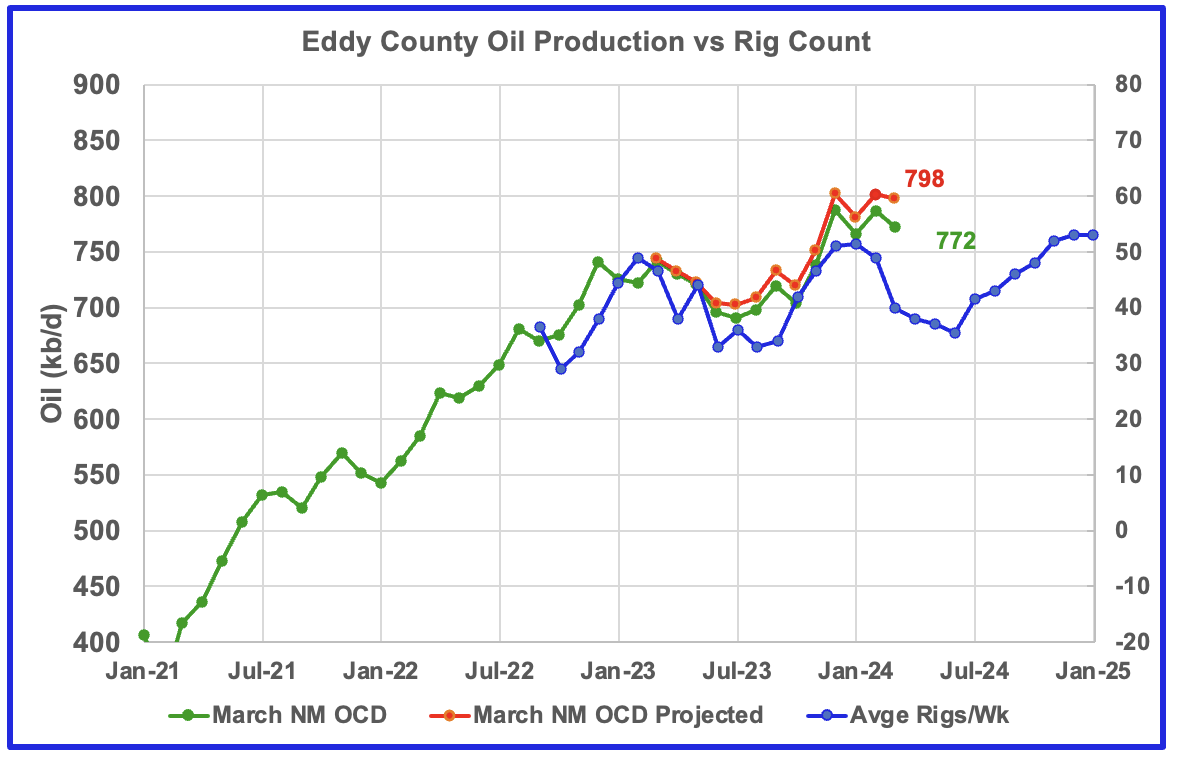
Eddy county oil production was showing signs it was in a plateau phase up to October 2023. However, production began to rise in November and hit a new projected high of 802 kb/d in February 2024. The rising production must be associated with the large increase in the rig count starting in February 2023. March production dropped by 4 kb/d to 798 kb/d.
The blue graph shows the average number of weekly rigs operating during a given month as taken from the above weekly drilling chart. The rig graph has been shifted forward by 7 1/2 months to roughly coincide with the peak in the production graph.
If production were to follow the rig count trend going forward, Eddy production should begin to drop in March/April before rising again starting in June/July.
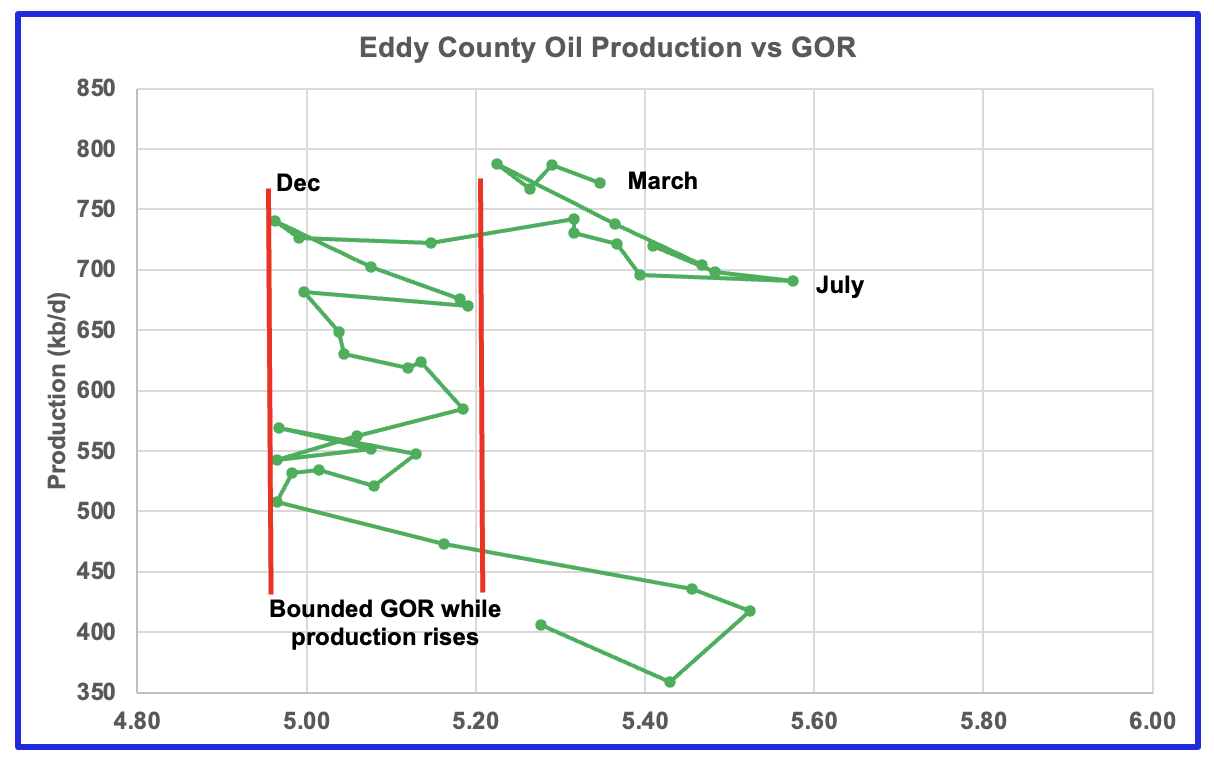
The Eddy county GOR pattern is similar to Lea county except that Eddy broke out from the semi bounded range earlier and for a longer time. For the last four months preliminary oil production has been bouncing between 750 kb/d and 800 kb/d.
August 2023 saw a reversal in the increasing GOR trend by decreasing which then was followed by the current oil production increase which reached a new high in December 2023, an atypical pattern. Since January the GOR has begun to increase again and production has been essentially flat.
The new November to March production highs along with a slowly changing GOR might indicate that drilling in Eddy county has punched into a new bench or some older wells are being refracted? Regardless Eddy might be on a plateau for the next few months and then begin to decline.
Texas Permian
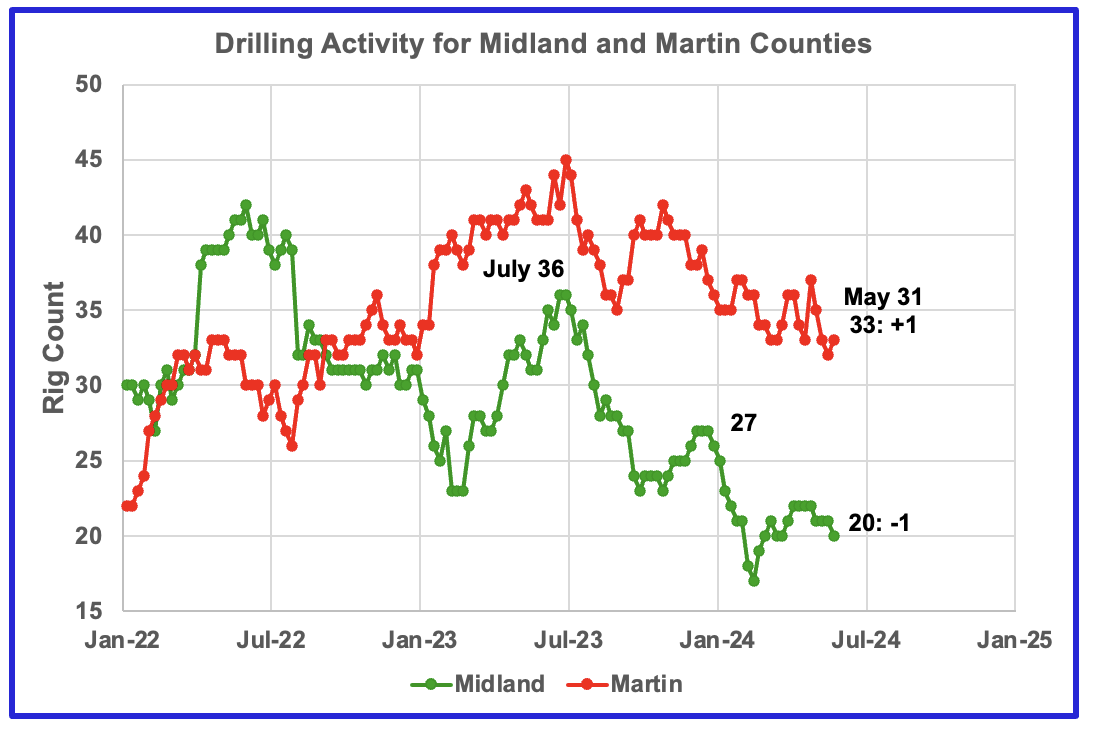
The rig count in Midland county started to drop again in May. Martin county rigs remain close to the lows of 2024. At the end of May the rig count was 20, down 7 from December.
Martin county rigs are in a slow decline and at the end of May the rig count totalled 33 down 4 from the beginning of May.
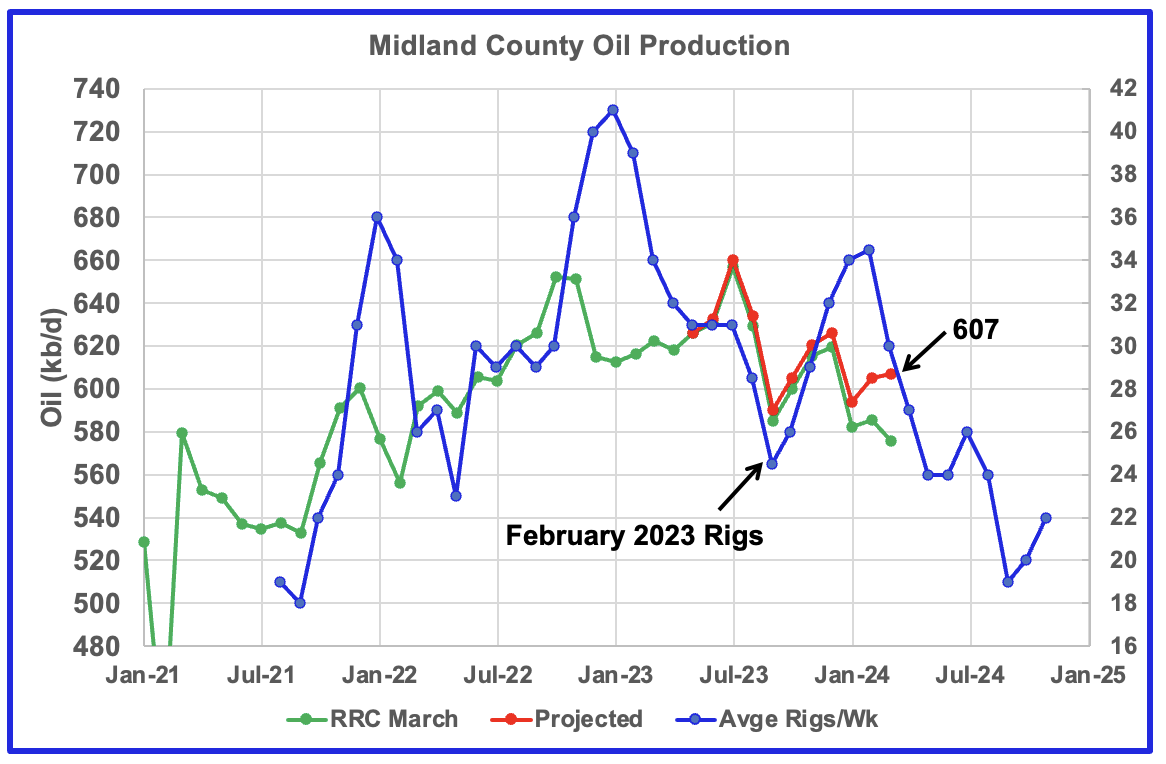
Midland County oil production appears to be in a slow and steady declining phase that started in August 2023. The green graph shows March’s preliminary production as reported by the Texas RRC. Note the small March drop. The rising production starting in October 2023 may be related to the rising drilling activity which started in March 2023. If correct, this implies Midland production peaked in July 2023.
The blue graph shows the average number of weekly rigs operating during a given month as taken from the previous weekly drilling chart. The rig graph has been shifted forward by seven months. So the 34.5 Rigs/wk operating in August 2023 have been moved forward to January 2024 to show the possible correlation and time delay between rig count and oil production. If the seven month shift in the rig count is approximately correct in that oil production can be tied to the rig count, oil production in Midland county should resume its decline after April/May 2024.
With Midland county deep into the bubble point phase, oil production continues to drop from previous highs, based on the previous graph, and should resume dropping in April/May. Note that oil production and GOR in this chart is based on the RRC March production data.
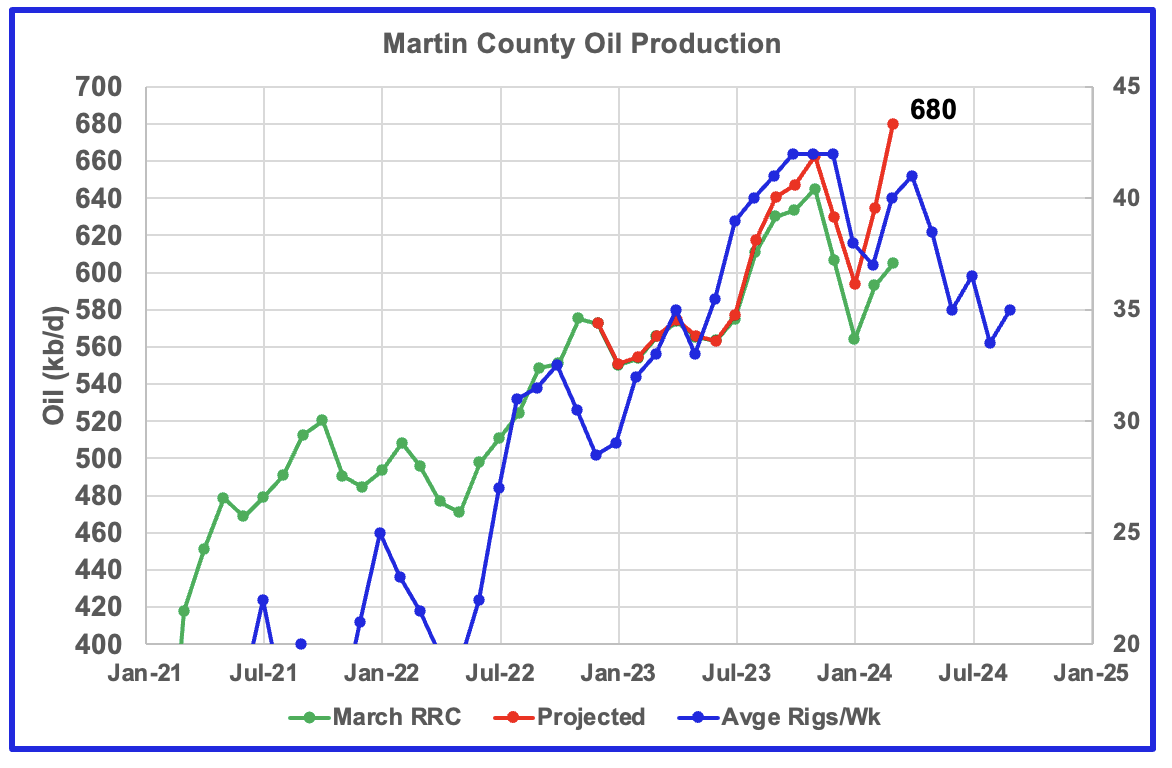
This chart shows Texas RRC oil production for Martin County. It was showing initial signs of peaking in November 2023. However projected March production exceeded November by rising to 680 kb/d. The rise followed the increase in rig count according to the time shifted rig count.
The red graph is a production forecast which the Texas RRC could be reporting for Martin county about one year from now as drillers report additional updated production information. This projection is based on a modified methodology that used February and March production data and will be re-estimated each month going forward. Production should begin to fall in April or May if production follows the rig count.
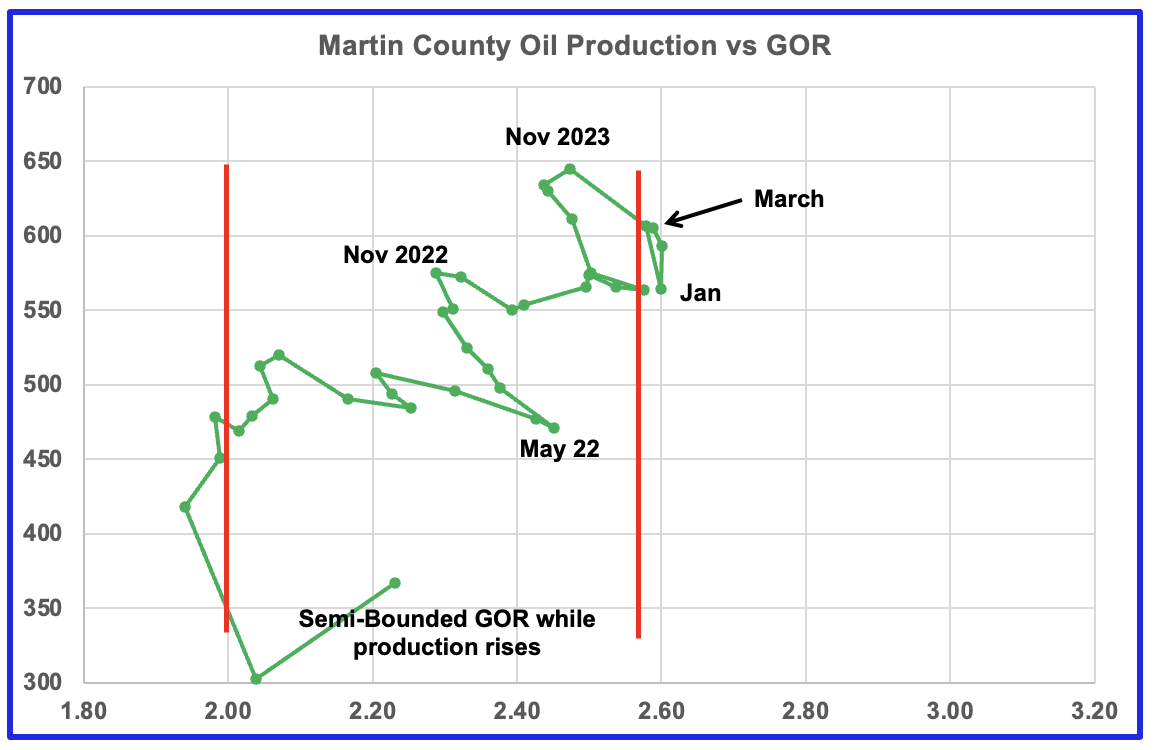
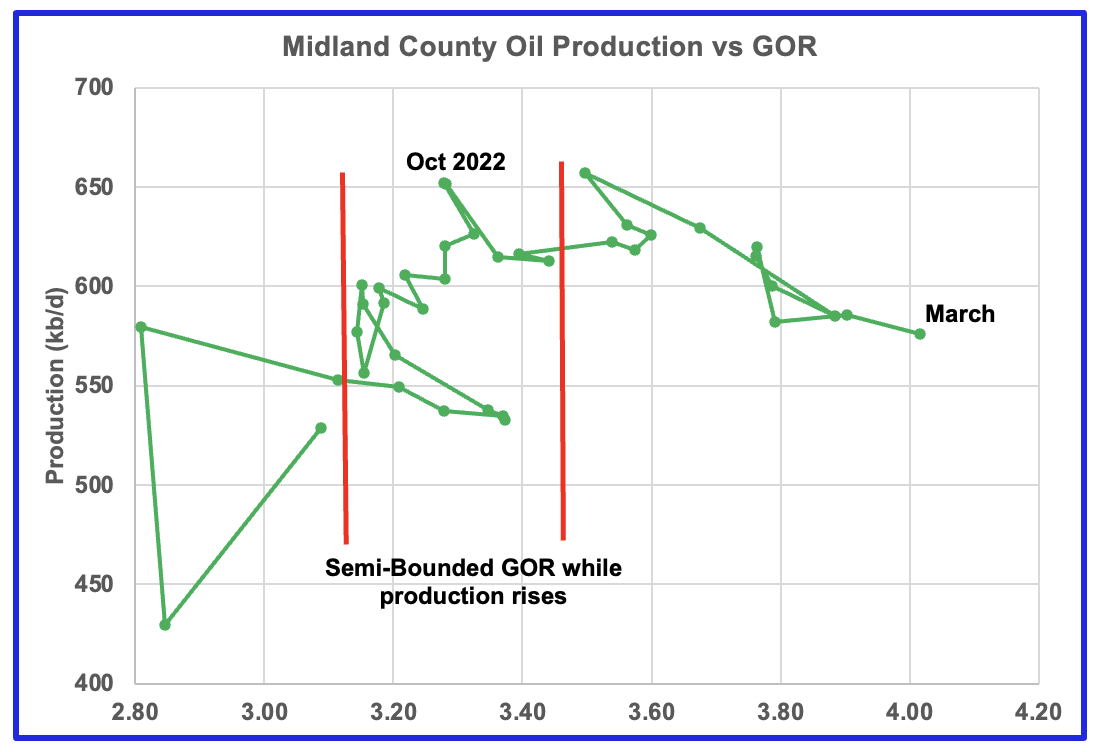
Martin county’s oil production and GOR up to December 2023 stayed within the semi bounded range and near peak oil production. However January, February and March saw production move higher while the GOR remained essentially unchanged at 2.6. Martin county has the lowest GOR of the four counties at a GOR of 2.60. Martin may be on the verge of entering the bubble point phase that results in a dropping oil production trend.
Exactly where to put the right hand red GOR boundary for Martin county is not exactly obvious. It is possible that the right boundary should be closer to a GOR of 2.5. Note the red line has been moved from 2.6 so that the production can be seen.
Findings
Forecast oil production continues to rise for Lea county while Eddy county is indicating signs of plateauing. However the rise and plateauing are due to increased drilling activities from months back and New Mexico production may be near a peak as drilling activity starts to decline.
Martin county production continues to make new highs but could be approaching a peak in a month or two if production follows the time delayed drilling trend in Martin County.
Midland county has peaked and has entered a declining phase.
Texas District 8
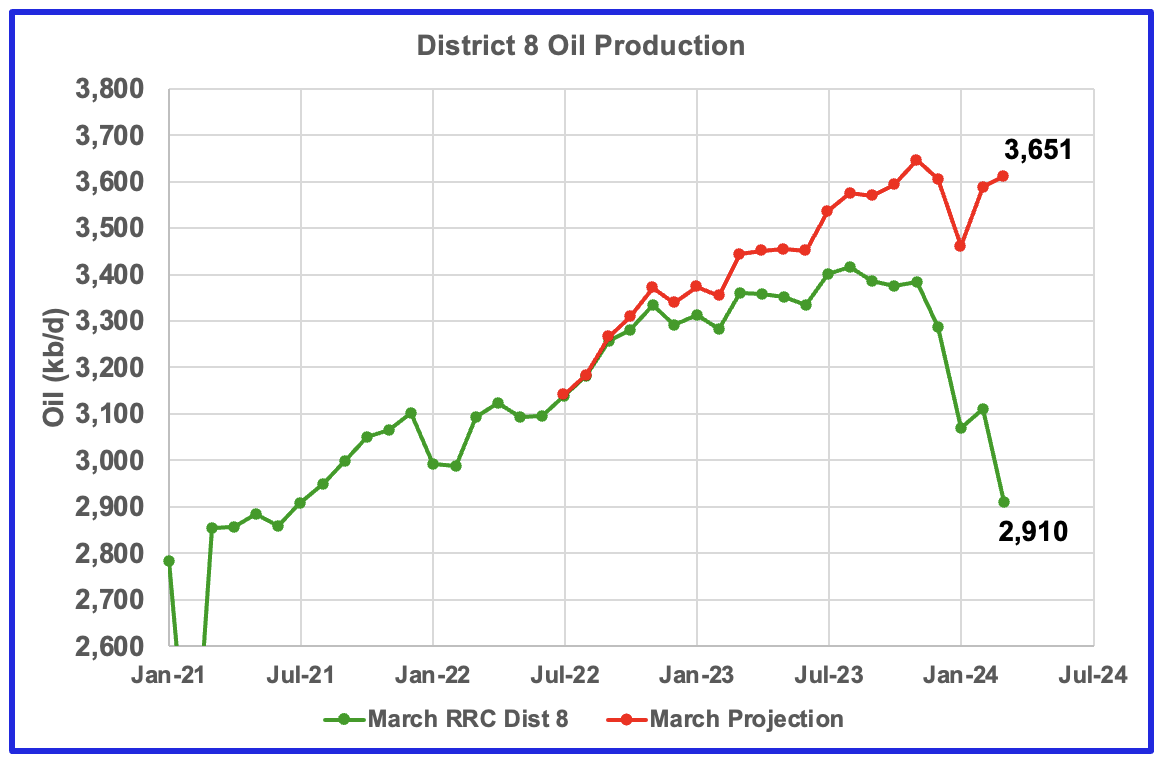
Texas District 8 contains both the Midland and Martin counties. Combined these two counties produce close to 1,200 kb/d of oil. While these two counties are the two largest oil producers, there are many other counties with smaller production, Reeves #3 and Loving #4, that results in total production of close to 3,650 kb/d. Essentially the Midland and Martin counties produce 1/3 of the District 8 oil.
This chart shows a projection for District 8 oil production. The red graph, derived from February and March production data indicates that oil production in District 8 may be entering a plateau phase.
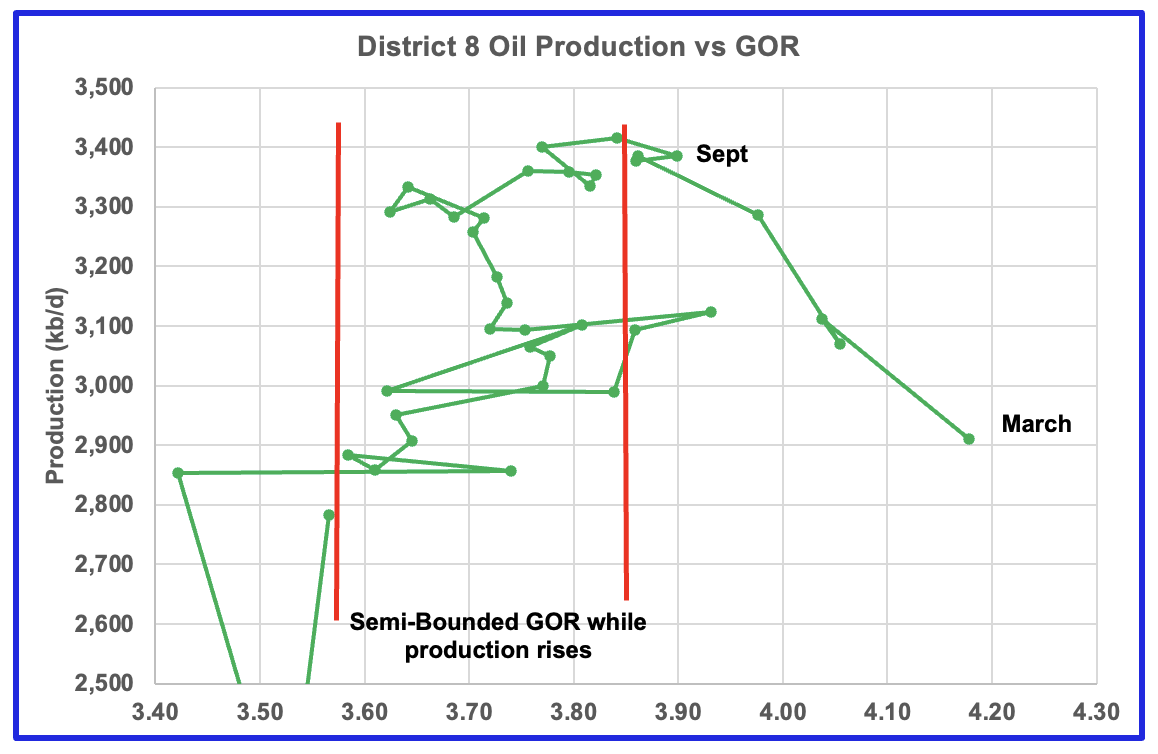
Plotting an oil production vs GOR graph for a district may be a bit of a stretch. Regardless here it is and it seems to indicate many counties may well be into the bubble point phase.
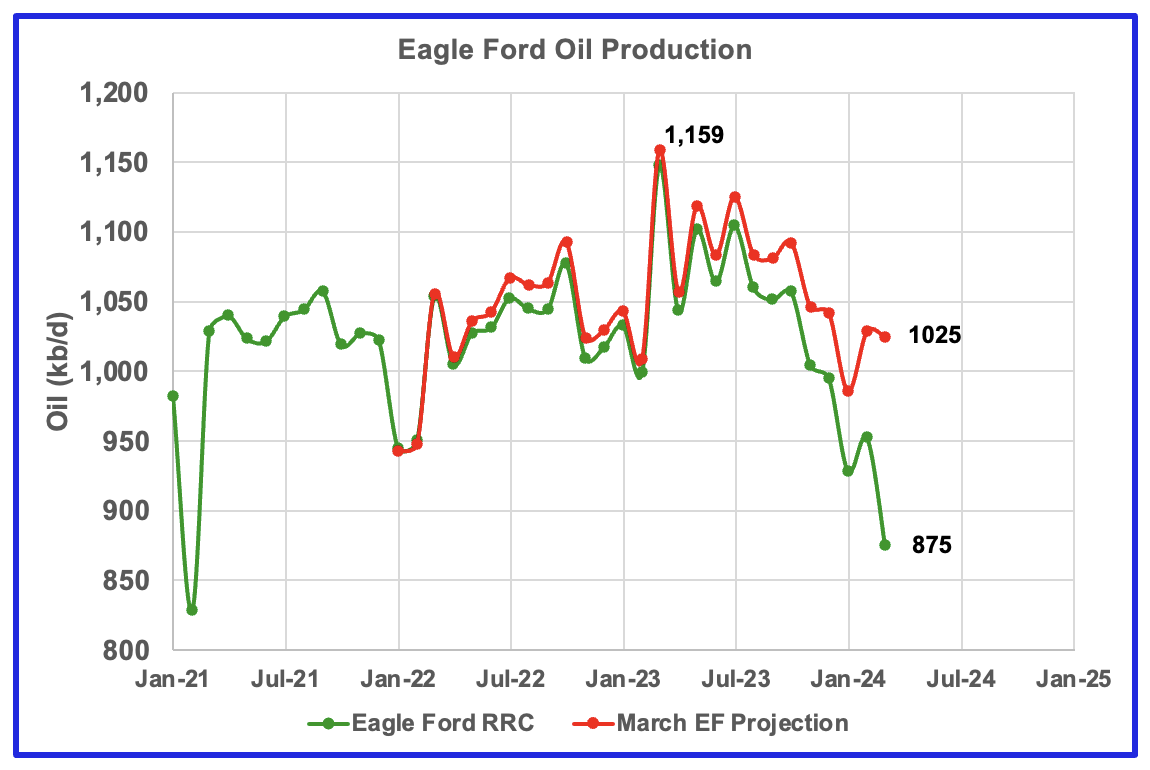
Production in the Eagle Ford is dropping and may have peaked in March 2023.
Drilling Productivity Report
The Drilling Productivity Report (DPR) uses recent data on the total number of drilling rigs in operation along with estimates of drilling productivity and estimated changes in production from existing oil wells to provide estimated changes in oil production for the principal tight oil regions. The May DPR report forecasts production to June 2024 and the following charts are updated to June 2024. The DUC charts and Drilled Wells charts are updated to April 2024.
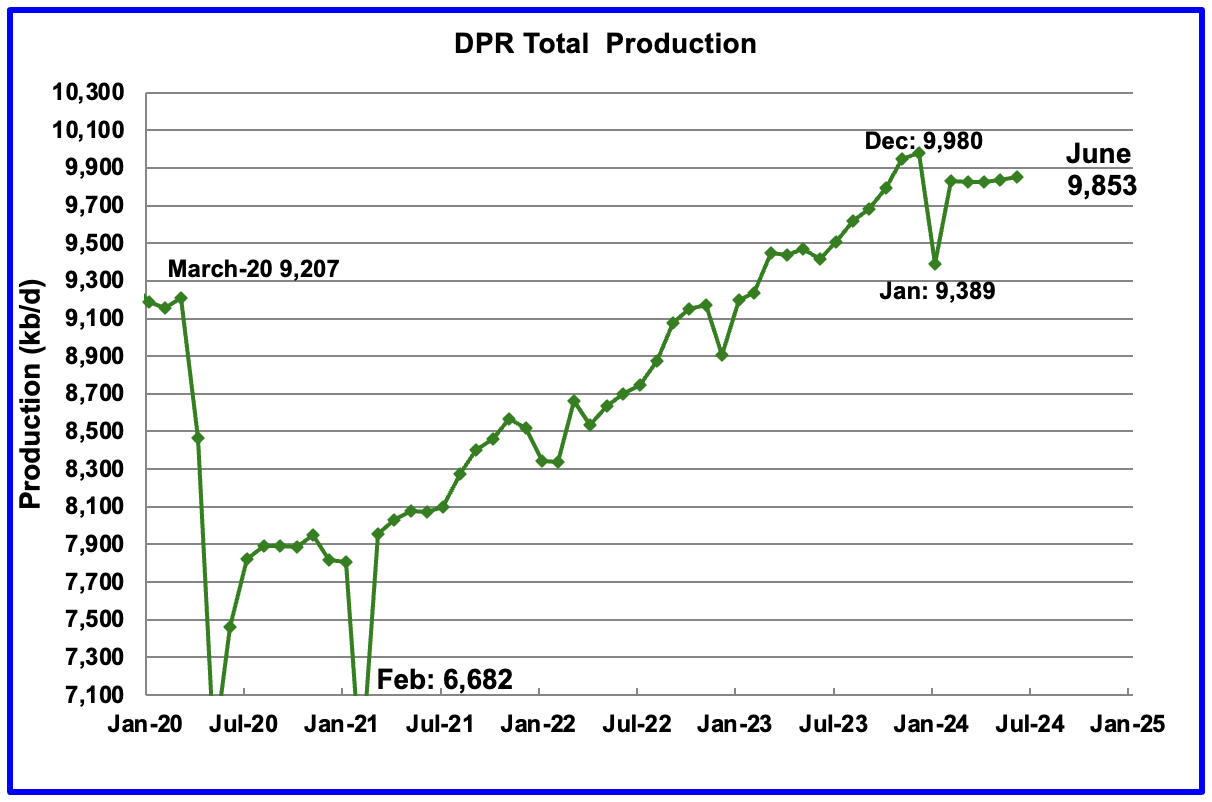
Above is the total oil production projected to June 2024 for the 7 DPR basins that the EIA tracks. Note DPR production includes both LTO oil and oil from conventional wells.
The DPR is projecting oil output for June 2024 will increase by 17 kb/d to 9,853 kb/d.
For the first time in many months, the May DPR report has also made a downward revision to its previous production forecast. For May, production was revised down by 27 kb/d to 9,836 kb/d.
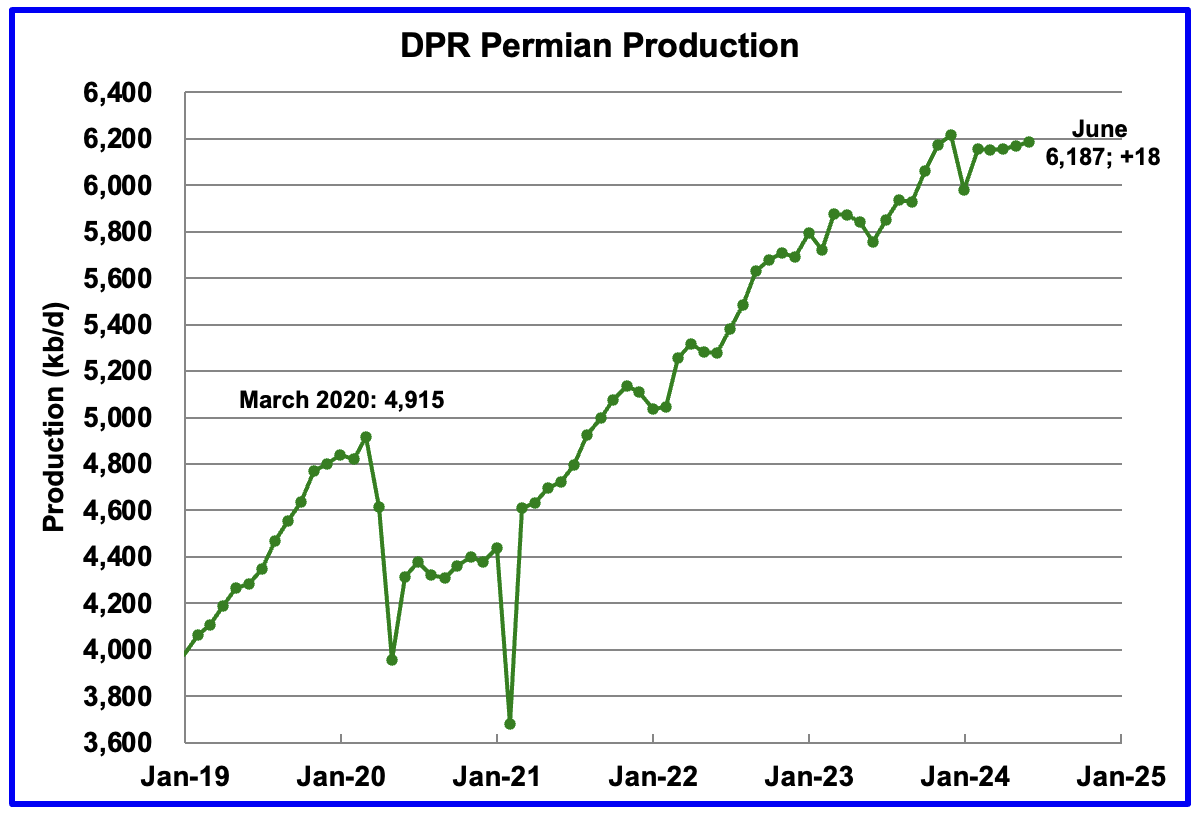
According to the EIA’s May DPR report, Permian output will continue its slow rise in June. It is expected to increase by 18 kb/d to 6,187 kb/d.
The last four months of Permian production show a slowly rising trend in monthly production. Production for the previous four months was essentially unchanged from the previous forecast.
Output in the Eagle Ford basin has been on a plateau since March 2021. On that date production was 1,103 kb/d. The DPR’s May forecast projects June output will increase by 4 kb/d to 1,106 kb/d. However the STEO May forecast has made a downward revision to Eagle Ford production. May was revised down from 1,164 kb/d to 1,102 kb/d, a negative 62 kb/d revision.
Since the beginning of 2024, the Eagle Ford rig count has been close to 47 ± 2 rigs. The current rig count is 48 which may account for its relatively flat output.
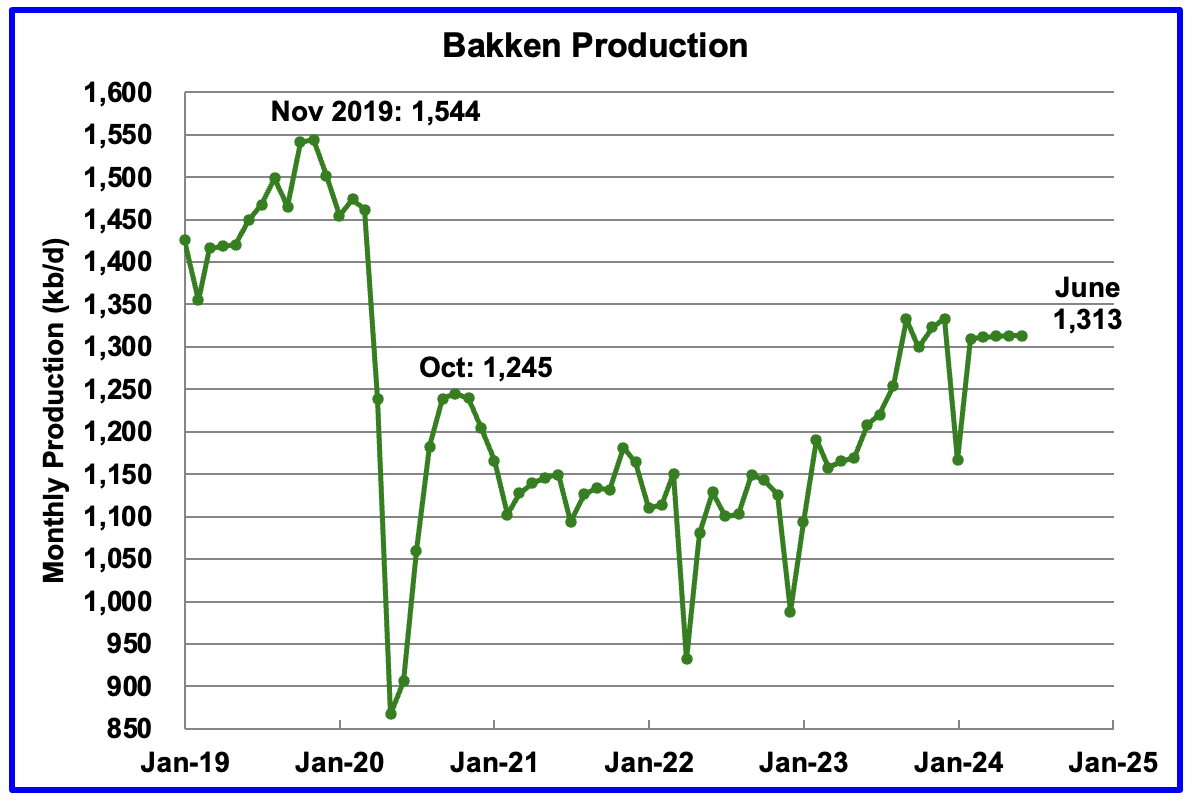
The DPR forecasts Bakken output in June will be 1,313 kb/d, unchanged from May. However May production has been revised up by 64 kb/d, so actually June production is up by 64 kb/d.
June 2024 production has now exceeded the 1,245 kb/d produced in October 2020 by 68 kb/d.
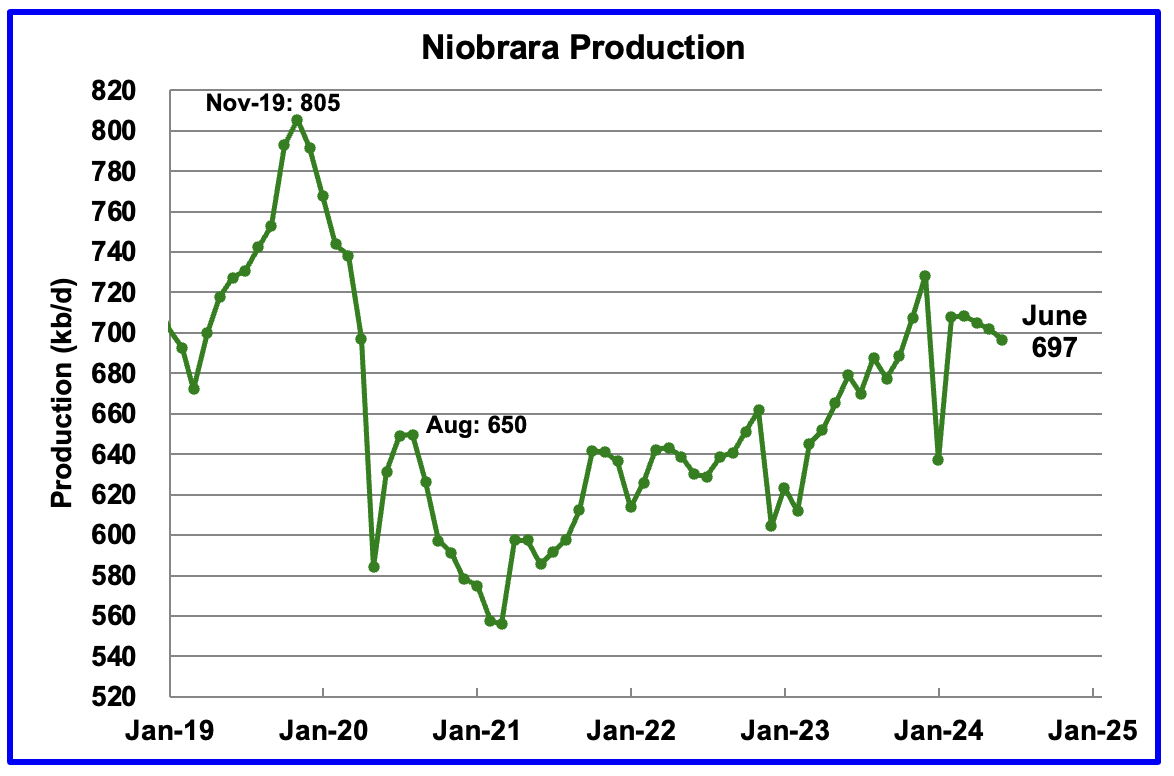
Output growth in the Niobrara continues to slow and has turned into a slow declining phase. June’s output decreased by 5 kb/d to 697 kb/d.
DUCs and Drilled Wells
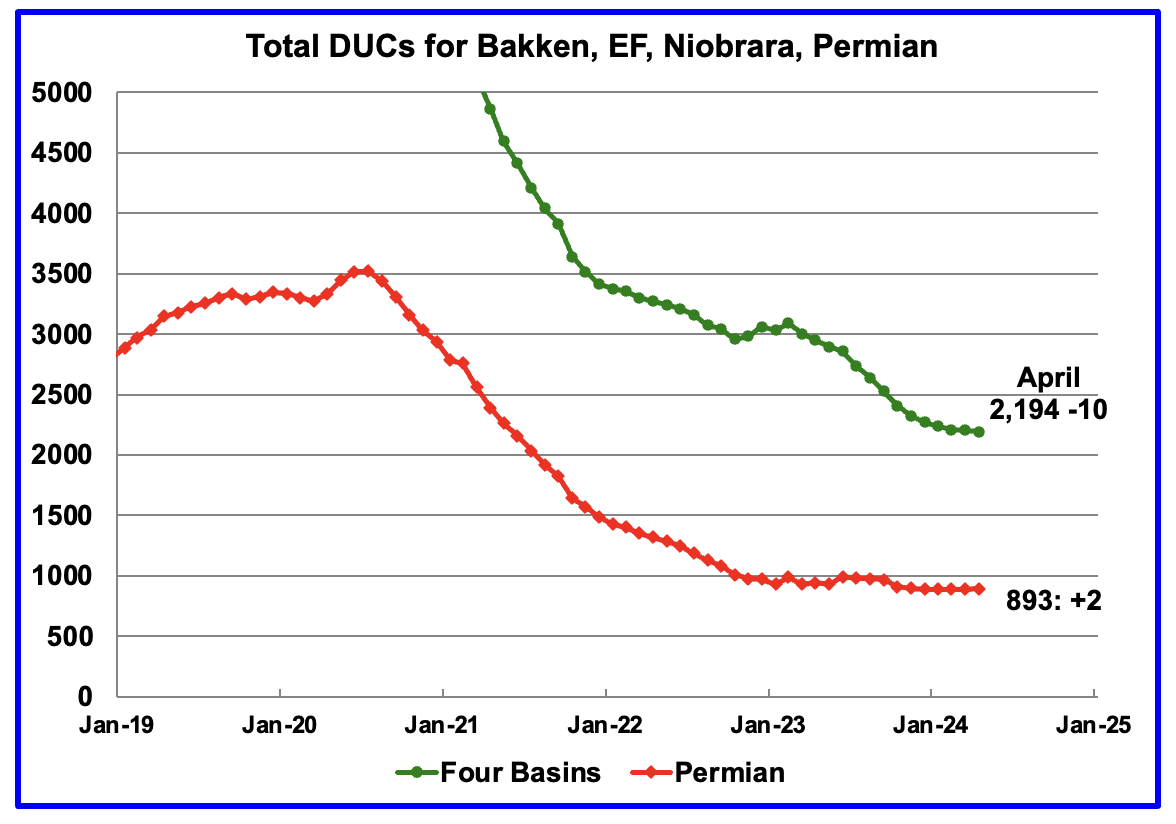
The number of DUCs available for completion in the Permian and the four major DPR oil basins has fallen every month since July 2020. April DUCs decreased by 10 to 2,194. In the Permian, the DUC count increased by 2 to 893, a rare event.
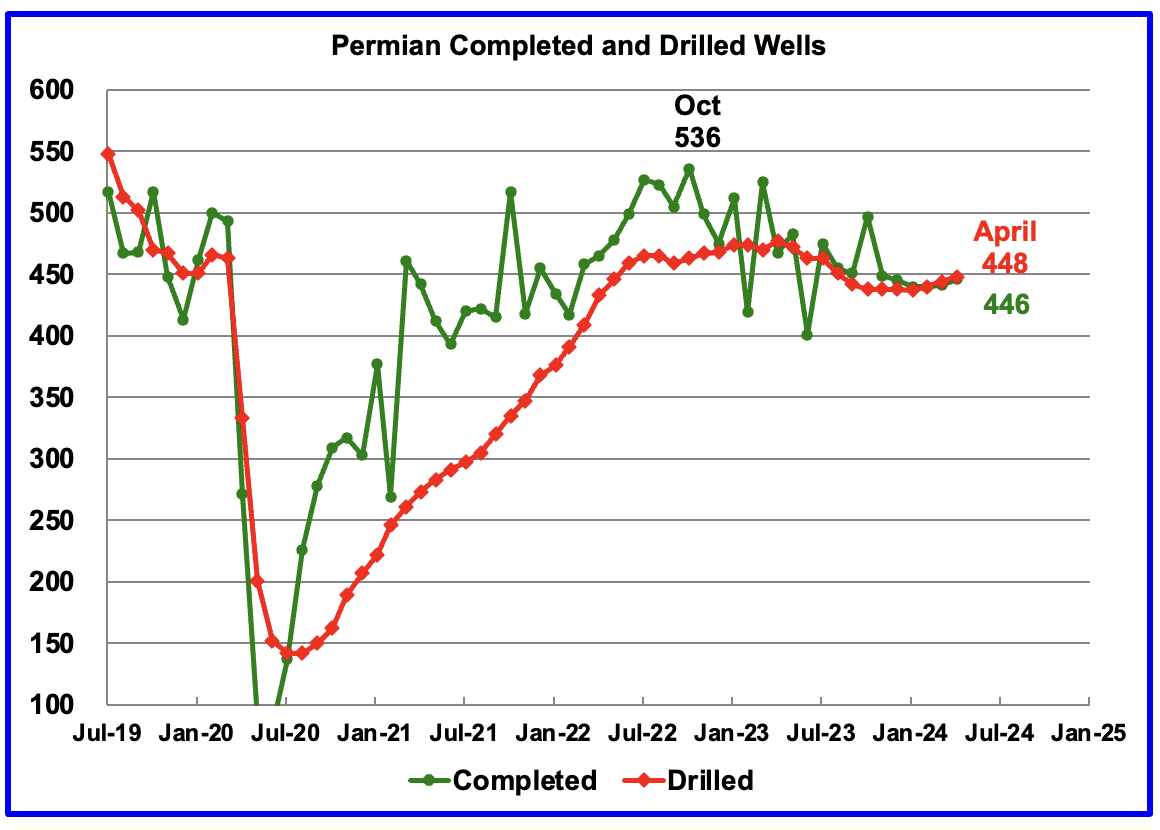
In the Permian, the monthly completion and drilling rates have been both stabilizing in the 440 to 450 range over the last six months.
In April 2024, 446 wells were completed while 448 new wells were drilled. This is the second month in almost a year where the number of wells drilled exceeded the completions.
95 responses to “Small increase for US March Oil Production”
Ovi,
Great job!
Andre the Giant
Thanks. Much appreciated
Oil is now down through an important support.
I think drilling activity should reduce now – otherwise the companies will drill themselves into a big black financial hole. Nat gas prices are already down, so when the oil income is reduced well profitability will come down by a big margin.
With the higher interest rates the time of drilling on cheap money are gone.
We’ll see in the next weeks if drilling and fracking activity is heading down.
Eulenspiegel
I agree that drilling should slow from here. However we need to know more about the lead time for drilling contracts. In other words, are the average drilling contracts made 3 months ahead of time, 6 months…?
Perhaps someone in the know could provide some insight on the question.
Hello Ovi,
On Drilling contracts… my experience is that they can vary greatly depending on the parties involved, size of the project and the obligations under the governing oil & gas lease for production in the USA.
The size of the companies involved and the project acreage size influence drilling contracts greatly. A 128,000 acre prospect is negotiated differently than a 1,280 prospect. Exxon negotiates differently than Comstock for a scale perspective.
Some Oil and Gas leases have minimum drilling obligation commitments to hold the acreage. Other leases don’t.
So, for your purposes…. “what are the average drilling contract times?” I think they vary greatly and also wander with market changes. It’s a tough variable to pin down in my opinion.
Thanks for the great data work.
Ovi. Thanks for another post!
On CNQ and other upstream stocks, CNQ has been a good performer.
I would note it also has lagged SPY over the past 10 years, which coincides with the steep drop in oil prices in 2014.
There were sure some great buying opportunities in 2020 in upstream. I just couldn’t pull the trigger, conserving cash was paramount.
Any company that is up from 2014 has to be considered a success, given the drop in oil and natural gas prices over that time.
Shallow Sand
Thanks
The S & P beats a lot of stocks. A colleague told me that his brother who lives in the US only buys SPY. Great returns, no advisor fees and beats most mutual funds.
I am looking forward to the next few months to see if the Permian enters a plateau phase.
Above I asked Eulenspiegel a question. Wondering if you can supply some info?
I don’t know the answer.
I agree, a few huge US companies have led.
My point is how much more can US grow? That’s the $64k question.
Ovi.
I looked at other large Canadian producers 10 year performance. Suncor, Ovintiv and Cenovus are all down quite a bit, Imperial up some.
Why has CNQ outperformed the others by such a wide margin?
Followed some of the canadian oil discussion on twitter for years:
CNQ, Best (payout) management so far, large buybacks and dividend, also more a “pure play” and not so “downstream” constraint like Suncor or Cenovus.
So Imperial Oil and CNQ outperformed the other large ones, but today – from value perspective I would add the laggrads, Suncor with great new managment is finally delivering and Cenovus almost reaching their debt goals, which will significant increase the buybacks/dividend (had some downstream issues until spring, including a refinery rebuild, which seems to be sorted out now)
Never the less, canadian oil sand stocks in general are quite attractive IMO – much cheaper, with long lifetimes, low capex and without the treadmill effect of US shale.
On top TMX expansion pipeline now online, which lowers the discount.
I have thought about SU. It was the Wall Street darling decades ago.
The only oil company stocks I own are XOM, COP, PSX, and hit the timing right on VLO after buying it in 2021 when things started to recover.
Owning oil production makes me steer clear, as I’m already way overweight oil.
The best thing I’ve done was selling some oil production to a young man, under 30, who is a true throwback to a different era. He does everything himself. Pumps, chemicals, pulls wells, repairs everything he can on his own. We financed him and so far he’s making it work. I’m hoping we don’t have another crash for his sake (and ours). He also contact pumps a few of our wells, which helps him out too, I’m sure.
After investing in oil for years, Covid was almost my breaking point, but in autumn 20′ – I went “All In” – mostly CNQ, SU, CVE and some mid caps … looking back: a once in a liftetime opportunity which paid out more than well.
Sold of CNQ early – with some trading in between I’m still invested in SU und CVE and others – this big boys really cleaned up the balance sheets and still better days to come, even on todays crude prices.
When US shale peaks, most likely canadian asset, already delivering double digit yields, will surge.
There are also rumors Buffet is planning a reenter in Canada energy sector after leaving his Suncor stake years ago.
– Special Thanks to all the contributors – on this forum, for helping to get such an good in deep view on the energy space and delivering the confidence to make some right decisions.
It is well known that US production has seasonality with winter but consistently misunderstood by peakers, eager to interpret every slowing as a turning point. A SEP to MAR flat is not that noteworthy. Growth might be slowing down. But I fully expect SEP24 to beat SEP23. To be more fair, just look at the MAR23 to MAR24 comparison, which matches the ~+500,000 bopd/year figure we’ve been tracking for a while
You’re also making the classic peaker (Berman, Patterson) mistake of underestimating North Dakota and its ability to come back from winter with the comment about it being hard for them to hit 1.3. How do you know? Just smell that? I would bet you money they hit 1.3 before the year is over.
GOM will probably get back a bit too in the next few months. It is more driven by long term drilling plans, but hurricanes tend to impact it in late fall. Note that it was 1.997 MM bopd in SEP23.
So when are we hitting 20 million per day Nony?
Soon. Then we’re on to 40 and beyond. Just gotta keep the faith. Endless, glorious growth.
Anonymous
I was looking at the number of rigs in ND and they have been steady at 31 from the beginning of the year. Also looked at legacy decline and new well monthly additions from the DPR. Legacy decline and production are very close.
Ovi,
But that is rational thinking, Nony will have none of it.
Nice work as always.
Thank you.
Permian scenario where it is assumed that the rig count remains where it was last Friday for Permian horizontal oil rigs (297 rigs) until May 2029 and then declines, completions 449 per month from December 2024 to December 2029 rig productivity unchanged, and new well EUR decreases by 3.35% per year for a well with 10k lateral (roughly the Permian average lateral length) starting in 2023. This scenario assumes oil, NGL and natural gas prices remain near current level until December 2029 and decrease after that date.
For Permian tight oil scenario in comment above, cumulative Permian tight oil output as of March 2024 is 12.7 Gb and cumulative output reaches 20.5 Gb by January 2028. In January 2047 (last point on chart) cumulative Permian tight oil output has reached 39 Gb. After September 2056 there is no further tight oil output from the Permian basin in this scenario. The last well is completed in May 2042 and average well lasts 14.33 years after which it is plugged.
Noticed slight error in spreadsheet on total wells drilled, it should be 112 thousand total horizontal tight oil wells completed in the Permian basin for scenario above, nothing else is changed, the total wells drilled was simply added up incorrectly in spreadsheet.
NOVI just release their estimate of inventory of undrilled targets in Midland with different breakeven economics.
only 18k wells with $80 or lower breakeven
https://www.linkedin.com/feed/?highlightedUpdateType=PAGES_TRENDING_CONTENT_BY_COMPANY_YOU_FOLLOW&highlightedUpdateUrn=urn:li:activity:7202292786862186498
Sheng Wu,
Those may be optimistic numbers from Novilabs, they use 500 foot spacing as their bench mark, but according to LTO Survivor we get better economics with 1300 foot spacing, so this reduces the number of potential sites by about a factor of 3. In addition how is breakeven defined, does it mean no profit or does it include a viable IRR of at least 10% per year (and even that seems low to me given the risk, seems 15% would be a minimum to justify an investment)? Also what natural gas and NGL price was assumed in the analysis? Often these analyses are very generous in their assumptions. My analysis of the entire Permian (both Midland and Delaware sub-basins) suggests at $2/MCF for NG and $75/bo at wellhead and NGL at 30% of wellhead crude price and a 15% annual discount rate, the discounted net revenue over the life of the average 2024 Permian well is about equal to the capital cost of the well plus plugging cost at end of life. Perhaps 20 to 30 k locations that might meet that criteria for the entire Permian basin. Maybe 12k for Midland basin and 18k for Delaware basin at most for a WAG.
this 500ft spacing if used by NOVI is indeed too tight.
1300ft spacing probably is already well above the optimal in the prolific part of Permian.
Scott Lapierre seems to suggest 700~1,000 ft.
It is easy to go wider spacing first than immediately doing dense cube drilling, but production guys like to tout factory mode to save $$$ now, but actually see EUR crash and GOR fly in a year.
The decline type curves need to be adjusted for each version of completion design, and yet they often lag behind, and then often the higher IP tends to give a false EUR if using the old type decline curve.
Sheng Wu,
I am not an expert, just repeating what someone in the oil business told me. In any case 500 seems too low on that we agree.
No one.
And I mean no one.
Is drilling 1300′ well to well spacing. 660 to 800 is pretty standard
Tim the Tiny,
Typically if the lease is 1 mile wide, 8 wells would be 660 and 6 wells would be 880. LTO survivor suggested better EUR at 4 wells per 1 mile or 1320 feet. 7 wells would be 754 feet.
I don’t know, perhaps 660 or 754 feet is what is done currently, but it seems you agree 500 feet is a bit optimistic (or even 528 feet which would be 10 wells per section width).
very interesting discussion on spacing.
My understanding is that NOVI’s data mining and machine learning analysis has come out with 500 ft optimal spacing, so they are pushing that. Interesting to read that the industry is not buying the number-crunchers at face value and leaving some safety margin to secure the ROI of the well.
It will be interesting to see if the massive consolidation of the past 18 months or so would lead to a more systematic approach and denser drilling. A company like XOM would not care much if a few wells puke out due to the denser spacing, as long as system-wide they get better results.
Kdimitrov,
Perhaps there are newer techniques that have reduced the optimal spacing, LTO Survivor is in the oil industry and has said (this was 2 years ago) that his experience was that the tight spacing reduced profits due to a significant decline in average EUR for tightly spaced wells, he suggested that in the Delaware basin the optimal spacing was about 1320 feet. Perhaps this is not the case in the core areas of the Midland basin.
If we look at Midland County Texas and assume all of it is core acreage (probably it is less than 100%) that would be about 577 thousand acres and assuming 3 main benches (most wells are Wolfcamp A, Wolfcamp B, or Spraberry formation) and about 115 acres per well (10k feet by 500 feet) would result in 15 thousand potential locations. My understanding is that Midland County has few new locations available in core areas and is currently at about 5500 wells completed as of Jan 2024 (Novi labs estimate) about 37% of potential locations (this seems too low).
If we use 880 foot spacing we get 8600 potential well locations which leads to 65% of potential drill locations already utilized which seems more reasonable.
If the Novilabs analysis is roughly correct for Midland basin and we assume prices of less than $80/bo and that Delaware basin might have 1.5 times the locations as the Midland we would have roughly 45 thousand future potential wells in the Permian. So far about 48 thousand horizontal tight oil wells have been completed in the Permian basin so at low (less than $80/b) prices we might have a total of 93 thousand total wells completed in the Permian basin. I tried such a scenario with rig count falling after December 2024 at 1 rig per month at first (until the end of 2032) followed by faster decline as we run out of potential well locations. URR is about 35 Gb for this scenario.
If we use the Permian scenario above and leave the other tight oil scenarios for non-Permian basins unchanged we get the tight oil scenario below, URR=64 Gb. Cumulative output of 32 Gb is reached in mid 2025 for this scenario which assumes low oil prices under $80/b.
Williston Basin horizontal oil rig count (monthly) shifted forward by 7 months (on right axis) and Bakken output (from NDIC) on left axis in kb/d. The low rig count for past 7 months may lead to a low completion rate through December 2024 and I agree with Ovi it seems doubtful we will see a big increase in Bakken output, indeed a decrease seems likely especially if oil prices remain under $75/b for WTI.
Longer term Bakken horizontal rig count (shifted forward by 7 months).
Bakken output and horizontal oil rig (HOR) count shifted forward 7 months. In 2021 and early 2022 DUCs were being completed faster than wells were being drilled and DUC inventory decreased by 224 over 15 months (an average of about 15 per month). About 39 wells were drilled per month on average over the Jan 2021 to March 2022 period. Thus about 54 completions per month was enough to maintain output at about 1075 kb/d on average over this 15 month period. From April 2024 to December 2024 there will be an average completion rate of about 65.5 wells per month (assumes no change in DUC inventory level). Based on recent maximum completions of 114 per month and maximum output of 1251 kb/d along with output of 1075 kb/d at a completion rate of 54 per month we can determine that each completion over 54 per month adds about 3 kb/d to output. So 11.5 more wells completed per month over next 7 months adding 11.5*3=34.5 kb/d to 1075 kb/d for a total of 1110 kb/d.
So for the next 7 months if DUC inventory remains constant, then Bakken output should average about 1110 kb/d over that period (April 2024 to December 2024).
Dennis
Think about reposting production/rig chart with the latest rig data down to 31. It should look pretty good.
I kind of did that before seeing your comment, we are on the same page it seems.
The assumptions about rigs and completions staying flat is iffy. It may be true, but we just don’t know.
The Permian activity levels hinge on a single company, IMO. XOM/PDX just has too much acreage, I find it hard to believe that they’ll be sitting on it and just nibbling.
Williston has seen a lot M&A recently. These acquirers probably have some ambitions.
It’s probably better to just sit back and see what happens in the second half, especially after Matterhorn goes online…
Kdimitrov,
Just a what if exercise, rigs could increase or decrease, it will depend on oil prices which will be influenced by both World demand and OPEC supply. Matterhorn helps the price of natural gas and will influence profits for tight oil producers, but oil price is the main factor in my view. Any scenario is one of an infinite set of possible scenarios and will be wrong, on that we agree. The future is not known.
How much do you think rigs will increase, they have been flat for the Permian basin for about 9 months (Sept 2023 to May 2023) if we push these out 7 months we have flat rigs from Feb 2024 to December 2024, after that we don’t know. This also assumes no change in DUC inventory which may well be wrong.
Hi Dennis,
I don’t know if rigs will increase and by how much. All I know is that Exxon made a big acquisition, got massive acreage, and talked big game. Maybe it’s just talk, but it would make sense for them to ramp-up instead of nibbling at the acreage.
Price is important, but their economics is different than that of small private producers. They have economies of scale, bargaining power with suppliers and service companies, etc… (OTOH waste and overhead is also traditionally higher, so…)
How many rigs were XOM and PXD running in the Permian at the time the merger was announced?
I suppose the same could also be argued regarding the CVX/HES merger. That might move the needle in the Bakken?
Am I remembering wrong, or did CVX buy significant assets in the Niobrara? What have they done with those?
Last I knew, Wall Street was still valuing dividends over production growth for upstream USA oil & gas.
What is the Wall Street case for these companies to significantly increase drilling with oil below $80 and gas near $0?
Just looked it up regarding CVX in Colorado.
CVX touts that it is the first company to have a Comprehensive Drilling Plan approved by the State of Colorado. This is on the 64,000 acre Mustang project.
The State agreed to issue 6 year drilling permits for about 400 wells, instead of the standard 2 year drilling permits. This is so CVX can drill at the best times for agriculture and environmental reasons. In exchange, CVX agreed to plug over 1,400 vertical wells on this acreage.
This information is on the CVX website.
Colorado and Wyoming both are significant oil producing states that aren’t discussed a lot. Colorado is not an easy place to operate. Looks like CVX struck an important deal there with this project.
Shallow sand,
Good point on Rocky Mountain States of Colorado, Utah, and Wyoming, as a group from Jan 2023 to March 2024 their C plus C output increased at an annual rate of 13.5%, for Texas, New Mexico, and North Dakota (where I tend to focus because the absolute numbers are larger and there is more tight oil data available) the annual rate of increase from Jan 2023 to Mar 2024 was 5.6%. Thanks for pointing this out.
Part of the reason they get ignored is that the absolute level of output of the Rocky mountain States is roughly 13 times less than the larger oil producing states of Texas, New Mexico, and North Dakota (696 vs 8812 kb/d in March 2024).
Dennis. Completely understand. Didn’t realize those three (I should have included Utah) have grown at a faster rate in percentage terms.
Kdimitrov,
It is possible XOM might produce more while smaller producers produce less with the result being a wash, I am looking forward 7 months as that is what those in the business have told me is a reasonable estimate for average time between spud and completion. Essentially I am assuming wells drilled in May will be completed in December. It takes time to drill wells, move rigs, move in frac spreads, frack the wells, etc, roughly 7 months from start of drilling to fracked well producing oil.
Obviously nobody knows what will happen in the future, you seem to believe that the rig count will increase, I guess I am the only one willing to make a guess. Just don’t claim after I have made a guess, that it should have been higher or lower, I asked and got no answer.
Haha, Dennis,
Nobody is going to beef you for your projections, you are doing a great service providing them here. You may very well turn out to be right. I just think that there is very high uncertainty on how the activity in the Permian will shake out in the second half and in 2025.
Kdimitrov,
I agree we can only guess, the future is always uncertain, I sometimes leave this fact unstated. In addition any assumptions I make about the future are certain to be incorrect.
Horizontal oil rig (HOR) count for Colorado, Utah, and Wyoming as a group.
Horizontal Oil Rig (HOR) count for Permian and Williston basins
A more recent view of HOR counts for Permain, Williston (lhs)and Rocky Mountain (rhs) states from Jan 2022 to May 2024 (these should be shifted forward by 7 months to imagine completion rates with the assumption of constant DUC inventory).
Permian scenario with rig count increasing by 1 rig per month from Jan 2025 to October 2027, then remaining flat until December 2029 and then declining. URR for Permian basin increases by 2 Gb compared to previous scenario to 43 Gb, peak in July 2028 at 5827 kb/d about 128 kb/d above the Feb 2024 modelled output.
Alternative scenario with rig count decreasing by one rig per month after December 2024.
https://oilprice.com/Energy/Energy-General/Is-a-Tipping-Point-Approaching-for-Americas-Most-Prolific-Oil-Basin.html
Permian Basin GOR.
only lacustrine shale basin in US surpass Delaware best with 1/3 GOR, and heavier oil
https://www.linkedin.com/pulse/uinta-rise-us-lacustrine-shale-oil-lowering-gor-sheng-wu-dajoc/?trackingId=x2YHaMMxQ8%2Bx83p7fY4qew%3D%3D
Sheng wu,
Utah’s C plus C output has grown at an annual rate of about 22% for the past 24 months. Most of this may be from the Uinta Basin. Though there is limited data available.
Dennis,
novi has a page for Uinta,
https://novilabs.com/uinta-basin/
From Novilab’s summary on Uinta, we could see that the basin’s overall GOR is about the same at ~2MCF/bbl in the past decade. The fast rise of XCL as the #1 oil producer while the lagging gas producer in the top operators camp in the past 3 years shows that XCL is operating in the lower GOR part of Uinta. XCL IP GOR is about 600scf/bbl and trending lower considering the old wells will have rising GOR, obviously lower than the core marine shale basins which usually have sweetspot IP GOR at around 1MCF~2.5MCF/bbl.
The Uinta also has density obviously higher than marine shale oil and yes, plus the waxy oil just crystallize once on the ground, and yes they produce just as good if not better than marine shale oil.
Will Uinta repeating the similar story in Vaca-Muerta (click link for the story), i.e. when they drill into the even lower GOR block, the oil production will actually rise(click for the story)? watch my youtube here: https://www.youtube.com/watch?v=2wwoUOT4rGE
or as Geopolitics Peter Zehan and mainstream geologists claim that lacustrine shale oil with high wax is hard to produce actually?
from TGS:
XCL typically outcompetes Delaware peers by 72% on Ultimate Oil production and 20% on a Ultimate BOE basis, while underperforming by 60% in gas production and 70% in EUR/1000 ft (gas) lateral length on a well-by-well basis.
Sheng Wu,
Peter Zeihan who seems unpopular on this site is a generalist not a petroleum specialist.
He was recruited by Stratfor for his geopolitical talent. Not geological.
https://worldview.stratfor.com/
I think he is really good. And would be interesting to the people on this site.
But not infallible.
thanks for clarification about Peter Zeihan, Andre!
I picked out Peter just to show the mainstream opinion about lacustrine shale oil production.
I also noticed geologists like Art Berman and many others working in the shale geology and production hold such opinion.
Often, mainstream including Novi using AI seem to hold one simple explanation for improvement in the shale patch — it’s the proppant size. The GOR in the NOVI page clearly shows that XCL has 1/3~1/4 of the average GOR in the Uinta basin, but NOVI does not say a word about GOR. TGS compared XCL GOR with Delaware GOR and shows it has just ~1/3, and yet TGS kinda expressing the suspicion on XCL claim that they are beating the best of Delaware.
https://www.tgs.com/weekly-spotlight/06-16-2023
Peter Zeihan is the ” Jim Cramer of geo politics ” . Now back to drinking my single malt . 😂
Zeihan is much much better than hole in head and opposite cramer (do the opposite of jim cramer reccomendations).
I really like internet hole in head. But……
He previously claimed the USA Navy is outdated and Iran controls the Strait of Hormuz.
They shot down 99% of Iranian missiles fired at Israel.
You do not want a USA Carrier Fleet parked off your coastline!!!
The USA Navy does whatever it wants and you cannot stop them!
Very fortunately, Americans are generally good hearted people and not like Kim Jong Un and Hitler.
Zeihan’s biggest blunder is he thinks the USA is oil independent.
Spot on, Andre; thanks for the analysis. No, Iran does not control the Strait of Hormuz. Iran controls nothing but their people and keeps them under control by the threat of death if they rebel. Women are forced to wear their Islamic garb under threat of death.
Peter zeihan is always worth a listen he often presents a different perspective, his history is usually accurate and he makes some good calls.
However he repeatedly states that the US is oil independent and a net exporter. He also appears to believe that natural gas will be priced as waste for the middle term and will enable a massive build out of new electricity capacity to supply the re industrialization of the US.
If we assume horizontal oil rig counts in the US remain at about the current level, we get a revised tight oil model with slow decline from Jan 2024 to Dec 2029 followed by steeper decline as rig counts are assumed to decrease starting in 2030. URR for scenario about 70 Gb with about 27.5 Gb extracted up to March 2024 and 35 Gb cumulative output in August 2026. Peak 12 month average output for this scenario is 8800 kb/d.
Alternative low oil price tight oil scenario at link below, URR=64 Gb.
https://peakoilbarrel.com/small-increase-for-us-march-oil-production/#comment-776551
Dennis – That still looks pretty optimistic to me…
Here’s an update after ~24 months (credit to Seppo Korpela (06/29/2022 at 1:49 pm)
So when will Saudi A. bounce back to 10 mbpd?
Kengeo,
Simply assumes rig count remains roughly constant from now until May 2029, rig count may increase or decrease depending on oil prices, NGL price and natural gas price and costs for materials and equipment to drill and complete wells.
Nobody knows what will happen, it is likely the resources can be extracted, prices and costs will determine if it is profitable to do so.
Saudis will produce at 10 Mb/d when oil prices rise above $90/bo and remain at that level or higher for 6 months or longer.
Kengeo,
Here is the latest. The production rates for the last six years have been adjusted based on the data.
The Rig report for the week ending June 7
– US Hz oil rigs decreased by 2 to 444. This is the fifth consecutive weekly drop, down 14 from 5 weeks ago. There are no changes in the basins being tracked.
The 2 rig drop reflects 3 fewer rigs in Oklahoma and an additional one in Colorado. The drop in Oklahoma rigs may be pointing to further oil production drops there as shown in the posted production chart
– Texas and New Mexico Permian were unchanged at 195 and 102 respectively. The Texas Permian is down 49 rigs from May 2023 high of 244.
– In New Mexico, Lea and Eddy counties were unchanged at 49 and 52 respectively.
– In Texas, Martin and Midland were unchanged at 32 and 20 respectively.
– Eagle Ford was unchanged at 47. EF has had 46 ± 2 operational rigs for the last 4 months .
– NG Hz rigs dropped 3 to 86. (Not shown)
Frac Spread report for the week ending June 7
The frac spread count dropped by 6 to 247 and is down by 19 from one year ago. It is also down by 25 spreads since March 8. The overall trend in frac spreads is down.
It should be noted that the rig count and frac spread count both peaked in November 2023.
Ovi,
Thank you for providing the Rig and Frac summaries every week!
It will be interesting to see next week’s STEO. The May report showed production declines through June and then an inflection, however, with these Frac and Rig counts any uptick will likely be later in the year.
OTOH, the Apr-June decline in May’s STEO hasn’t really been reflected in the weekly stocks data, so it is probably reasonable to expect that Apr,May,June should be flatter with March…
So let’s see, it will be an interesting STEO, it will be incorporating the DPR and the LTO production reports as well, so quite a change in format. Let’s see if there is a change in methodology as well.
Kdimitrov
I am also looking forward to next week’s STEO to see if the falling rig count will influence their outlook. With regard to their July uptick, I wonder if it is related to the opening of the Matterhorn pipeline.
With regard to the stocks data, that is influenced by the balance of imports vs exports. Because the import side is unknown, I think that is why the stock prediction’s are wrong so often. I prefer to look at the weekly production data and it has been flat at 13,100 kb/d for the past 13 weeks and dropped rapidly from 13,300 kb/d in February to 13,100 in early March. I think the weekly data is about right these days.
Attached is a rig chart I haven’t posted for a while. It shows the rig count for all of Texas. Note that that the rig count is down 80 since January 2023, 25%. That will start to show up shortly in Texas production. November 2023 may be a production peak or the beginning of a plateau. Midland has peaked, Martin is close to peaking and the EF has peaked. The drop in rig counts may reflect higher productivity but it also must include fewer Tier 1 drilling locations.
It’s unfortunate that the Frac data doesn’t disaggregate the spreads into oil and NG.
Ovi,
The following chart shifts the weekly horizontal rig data forward by 7 months for the 4 main tight oil basins (Permian, Bakken/Williston, Eagle Ford, and DJ/Niobrara) and the rest of US horizontal oil rigs (HOR) besides the big 4. After March 2024 and through December 2024, the horizontal oil rigs are relatively flat which suggests little change in the completion rate for tight oil wells in the US, if DUC inventory is relatively stable.
Dennis
That should be an expected result. What is surprising is the drop in completions that started 3 months ago. Maybe they will shortly settle into new equilibrium level below 250.
Ovi,
Not sure there is a one to one correspondence between frac spread count and completions, I agree it would be nice to have more information on frac spread counts in various basins and split between oil and natural gas frack spreads. Rig count is the best information we have. A problem with the DPR is that they use only a 2 month lag for rig count to completions, based on information from Mr. Shellman that is not a good estimate, 7 months is his opinion and is likely a better estimate.
Tight Oil completions (estimate from EIA-DPR) for Permian, Bakken, Eagle Ford, DJ/Niobrara, and Anadarko Basins. Average completions from July 2022 to July 2023 was 879 per month, level falls to about 750 by April 2024, about a 17% decrease from July 2023 to April 2024.
Shale gas completions fell by about 52% from July 2023 to April 2024 with the percentage of tight oil completions rising from 85% of total shale oil and gas completion in July 2023 to 88% in April 2024.
Also about 3.2 to 3.4 completions per frack spread over July 2023 to April 2024 period based on EIA completion estimates.
Permian vs non-Permian Horizontal Oil Rigs shifted 7 months forward, flat April to Dec 2024.
Dennis
Doesn’t this chart just say that Tier 1 wells started vanishing sooner in the Non-Permian basins/filelds/counties?
Ovi,
Either that or industry realized that the best investment return was in the Permian basin and they moved their investment dollars to the Permian from other tight oil basins. Probably some of both. Also note that on a percentage basis. the non Permian went from a high of about 235 to around 160 (over the April to Dec 2024 period), roughly a 47% decrease in horizontal oil rigs (HOR). For the Permian HOR went from about 330 to 295, a decrease of about 12%, so the decrease in the non-Permian was almost 4 times larger on a percentage basis. Some of this might also have been due to the higher interest rate environment since 2023 (prime rate in US rose from 3.25% in March 2022 to 8.5% in July 2023.)
Also note the drop for the lesser tight oil basins not part of Big 4 tight oil basins (P, EF, B, and DJN) were quite large going from 110 to 60, about an 83% drop vs about a 42% decrease in B, EF, and DJ as a group (128 to 90).
Phantom Barrels
Rosneft’s Sechin blasts spare oil output capacity rise in Middle East, West Bold mine.
ST PETERSBURG, Russia, June 8 (Reuters) – Igor Sechin, CEO of Russian energy major Rosneft (ROSN.MM), opens new tab, said on Saturday that an increase in spare oil production capacity offset efforts by OPEC+ to reduce oil output.
He said that combined spare oil production capacity of Saudi Arabia, United Arab Emirates, Kuwait and Iraq stood at 5.6 million barrels per day, or 13% of OPEC+ current output.
“The creation of reserves as we observe by both Western and Middle Eastern companies may be an expectation of serious market changes,” Sechin, who has been sceptical about Russia’s cooperation with OPEC, told St. Petersburg International Economic Forum.
“The presence of such ‘phantom barrels’, which can have a large-scale impact on the market, offsets the impact of the voluntary reduction in production quotas undertaken by the main OPEC participants,” he said.
“This is also shown by the market prices, which went down after the recent decision of the ministers of the (OPEC+) participating countries.”
Some OPEC+ members, including Russia, agreed on Sunday to phase out voluntary cuts of 2.2 million barrels per day over a year beginning from October. OPEC+ also agreed to maintain other cuts amounting to 3.66 million bpd until end-2025.
Some OPEC members are up to their old tricks of increasing their reserves with a pencil in order to increase their production quota.
It looks like OPEC Middle-East is using quotas to mask their lack of spare production capacity, and is this is why they’re extending their quotas longer and longer into the future.
I understand that the break-even cost for new wells in the Permian is $65/barrel oil. Given that fact, coupled with the expectation that OPEC+ will increase production in the fall, it seems that US oil companies would be very disincentivized to start any new wells. This in turn suggests that US production will fall for two reasons: reduced production from existing wells and a reluctance to initiate new ones.
Such is the thinking of this biology major who knows almost nothing about the oil business.
Sam,
For the Permian basin the average well needs about $80/b to earn a decent return (enough to encourage new wells to be drilled and completed for a rational investor). The $65/bo estimate is investor presentation hype that the small print tells you to ignore, it is not a fact.
I agree tight oil output may decrease if fewer new wells are completed in the future due to relatively low oil prices.
Thanks, Dennis, for taking the time to respond. I’m a small time retail investor who has been persuaded that upstream oil companies are worth the risk, in response to which I’ve started to read a lot on the subject. I find it very interesting, as there are major divergences in opinions of very informed people (e.g. spare capacity in the Middle East — massive or limited; demand — increasing or soon to plunge; etc.)
This website is very informative, and it looks like you’re integral to it. Keep up the great work!
Thanks Sam,
Keep in mind that nobody knows what will happen in the future, especially me. I agree there are many different opinions on OPEC plus spare capacity, the future potential of US tight oil, and future World Demand for oil.
Some good insights can also be found at http://www.oilystuffblog.com, the owner of that blog is a retired oilman who owned an oil company and was in the business for 50 years or so, he knows much more than me about the oil business.
New Aramco Share Sale Does Not Change The Company’s Dire Situation
Saudi Aramco’s recent $11.2 billion share sale raises questions about its competitiveness and ability to support Saudi Arabia’s financial system and Vision 2030 development plan.
The company’s high dividend commitments strain its finances, potentially hindering investment in oil production and challenging the original purpose of the IPO.
This is an interesting comparison of OPEC’s Big 5 versus the total production from the rest of OPEC Plus. Data is through May 2024.
Russian crude-only production has fallen 294,000 barrels per day in the last two months. Are these voluntary cuts or Ukrainian aggression?
Ron
I think it is a real cut because Russia has not been keeping their commitments and I think UBS read the riot act to P. Ukraine is attacking refineries. Their objective to is to reduce gasoline and diesel supplies to the Russian logistics system.
We need to distinguish between refineries and crude oil processing plants such as the Saudi GOSPs. The US government may have told Ukraine not to attack those crude processing plants because it would drive up the price of crude.
According to the article blow, Russia ordered companies to cut oil output to meet OPEC+ target.
Moscow, meanwhile, has ordered companies to reduce oil output in the second quarter to meet a production target of 9 million barrels per day (bpd) by the end of June, in line with its pledges to the producer group OPEC+, three industry sources said on Monday.
“Russia’s government has ordered companies to reduce oil output in the second quarter to ensure they meet a production target of 9 million barrels per day (bpd) by the end of June in line with its pledges to OPEC+, three industry sources said on Monday.”
https://www.reuters.com/markets/commodities/oil-rises-heightened-geopolitical-risks-exacerbate-supply-concerns-2024-03-25/
Perhaps, but I am suspicious. I think Russia and Saudi Arabia are having problems with a decline in production. The cuts in quota give them perfect cover to hide that fact.
Ron,
We will know more if oil prices rise to over $95/bo in 2023 US$, at that point the OPEC Big 4 (excludes Iran because they are not subject to quotas presently) may increase output. If they do not then perhaps they cannot, in any case we will only know when prices rise and there is no increase in OPEC output. It is possible oil demand starts to fall before we reach that point and OPEC falls apart as they open up the taps and compete for buyers by offering lower prices.
Dennis, I do not doubt that OPEC does have some spare capacity. Just not nearly as much as they claim or many people think. Almost every member is producing at full capacity. I believe they might increase production by one million bpd, one and a half at most. We will know when and if prices increase quite a bit.
I think it is a combination of things that are impossible to parse out.
1. Russia was projected to peak around 2021, even before COVID hit. The COVID curtailment may have postponed the peak, which is hitting now.
2. The war, the chaos, the departure of many Western OFS companies are not helping, by any means.
3. There are voluntary cuts as well, as part of the DoC commitments.
we’ll probably know more when DoC lifts the quotas, but even then it may be murky. Data quality is terrible for Russia and the “secondary sources” are not the absolute truth by any means…
Hi POB,
Am I’st missing something? Please let me know. Think it’s weird that none of this has shown up on the MSM, or POB.
https://www.bizcommunity.com/article/saudi-arabias-petro-dollar-exit-a-global-finance-paradigm-shift-670911a
https://www.youtube.com/watch?v=aKnX5wci404
I don’t think it’s a very big deal. Saudi Arabia’s sovereign wealth fund is denominated in USD. If the dollar were to crash the purchasing power of the Saudi’s wealth fund would take a huge hit.
That’s not going to happen though. If you start trading in other currencies the value of the dollar goes higher not lower. As the supply of other currencies expands while the supply of dollars contracts.
Understand there is about $100 trillion USD denominated debt outside the US. There is no exiting the dollar system without an incredible amount of pain via the currencies. Most of this debt isn’t owed to the US or US banks either.
The dollar becomes weak when the global economy is running on all cylinders. That’s because the dollar supply is expanding rapidly when the economy is doing well.
They really want NEOM to be a success. For some reason.
They think it will generate tourism dollars. It’s not just a place for people to live. My thoughts are when the world becomes energy deprived how many people are going to be jumping on planes to go visit NEOM in Saudi Arabia?
A report on February World and Non-OPEC oil production has been posted
https://peakoilbarrel.com/march-non-opec-and-world-oil-production-rises/
A new Open Thread Non-Petroleum has been posted.
https://peakoilbarrel.com/open-thread-non-petroleum-june-12-2024/