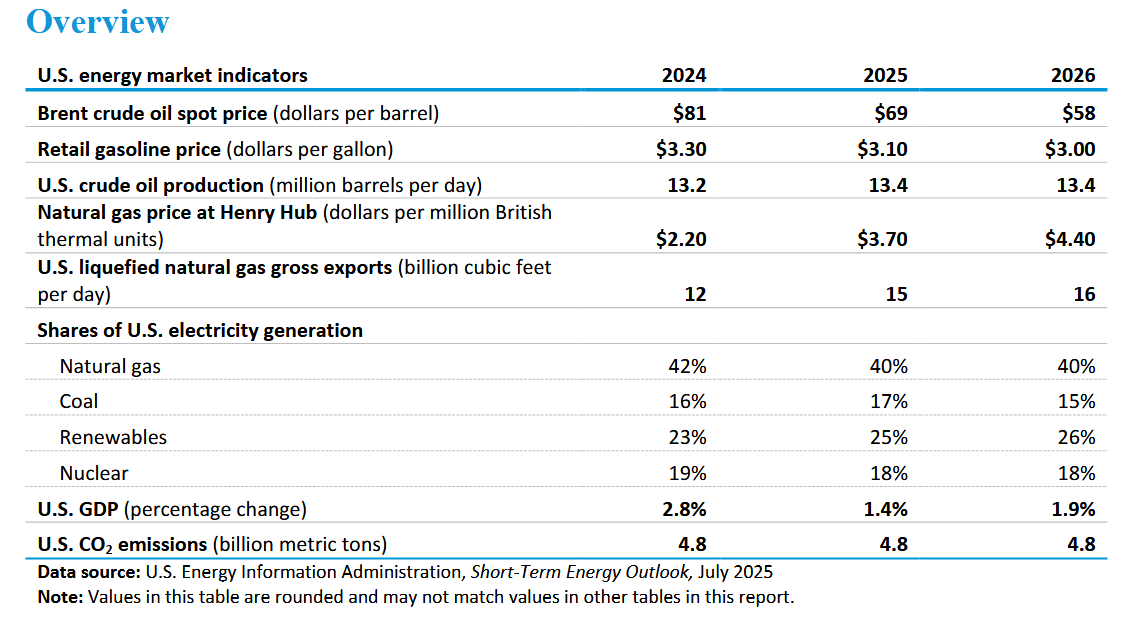
The EIA Short Term Energy Outlook (STEO) was published recently. A summary in chart form.
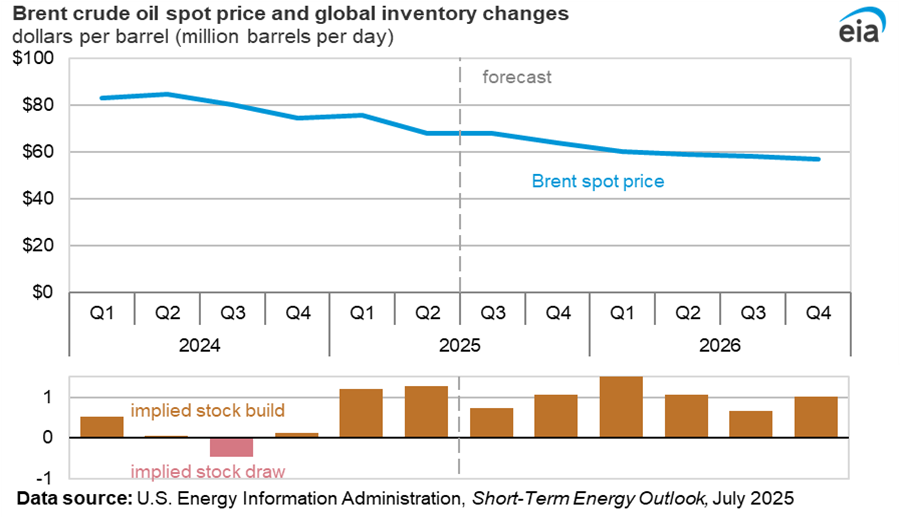
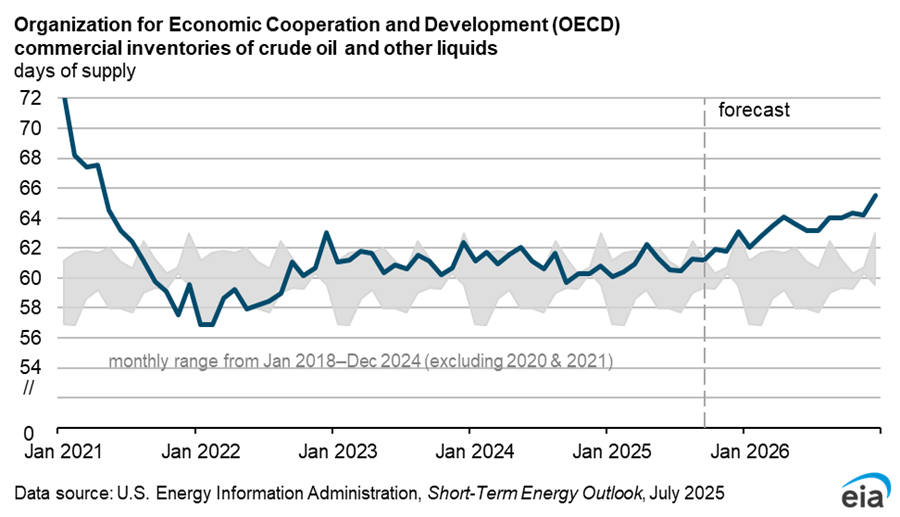
Commercial OECD inventory is expected to rise to 66 days of supply by 2026Q4, since the pandemic stocks have been in the 57-62 day range. High stock levels lead to the low oil prices in the previous charts.
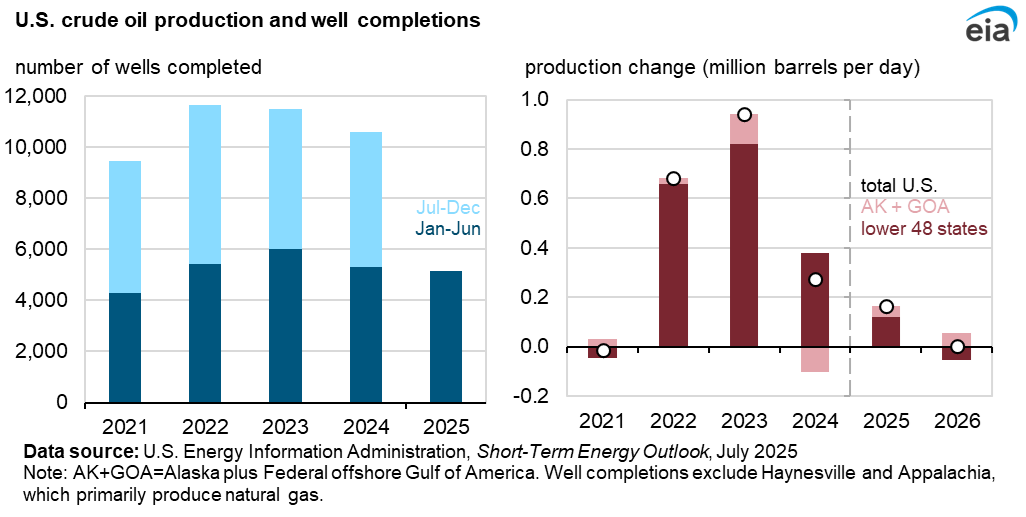
Lower completion rates and lower new well productivity lead to slower growth in US output in 2025 and 2026, Completion rates are expected to be even lower in 2026 due to very low oil prices (WTI=$55/b) leading to no increase in US average output in 2026 compared to 2025.
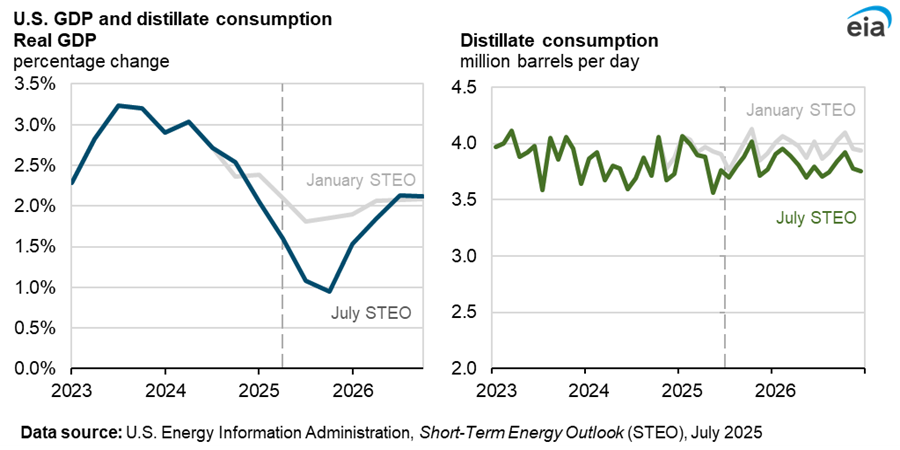
US GDP and distillate consumption are closely correlated and the outlook is less optimistic now than in January 2025. The rebound at the end of 2026 for US GDP looks like wishful thinking to me.
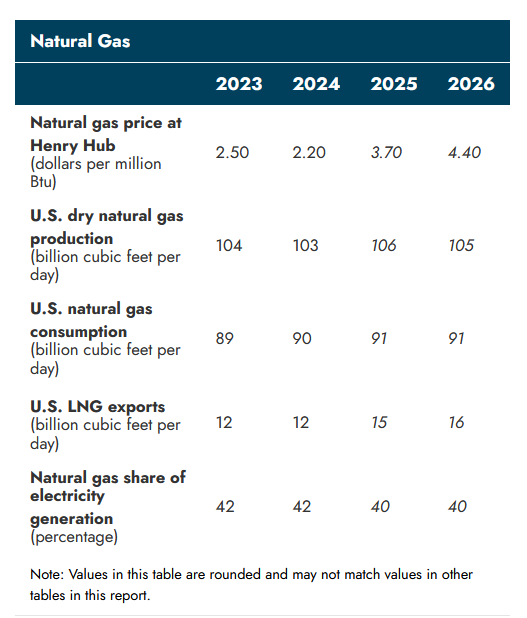
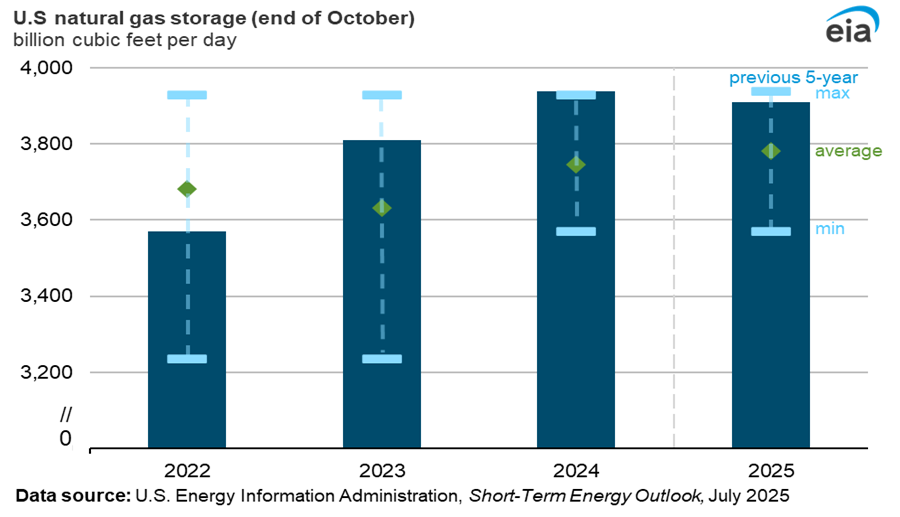
Higher natural gas storage levels in October 2025 lead to lower natural gas prices than in last month’s STEO. This is due to higher output than expected and lower demand for natural gas from power plants due higher natural gas prices.
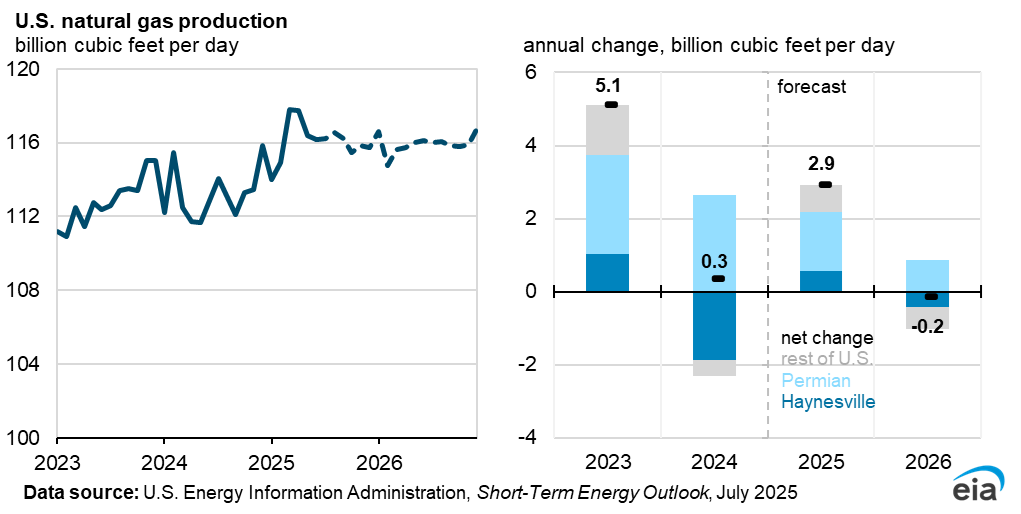
Marketed natural gas output is 2.9 BCF/d higher in 2025 than in 2024, but in 2026 output decreases slightly by 0.2 BCF/d due to low natural gas prices.
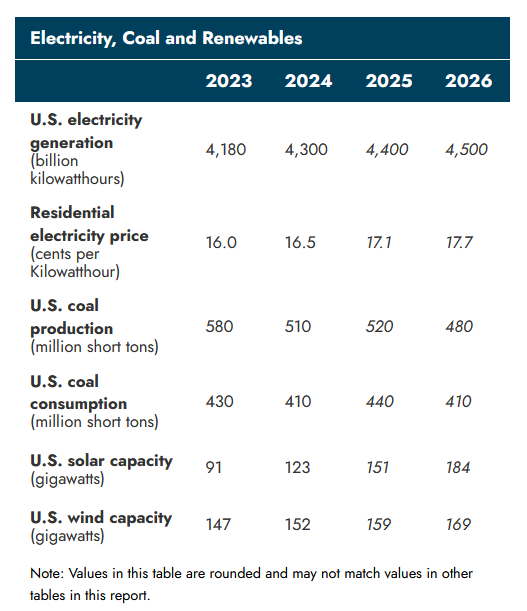
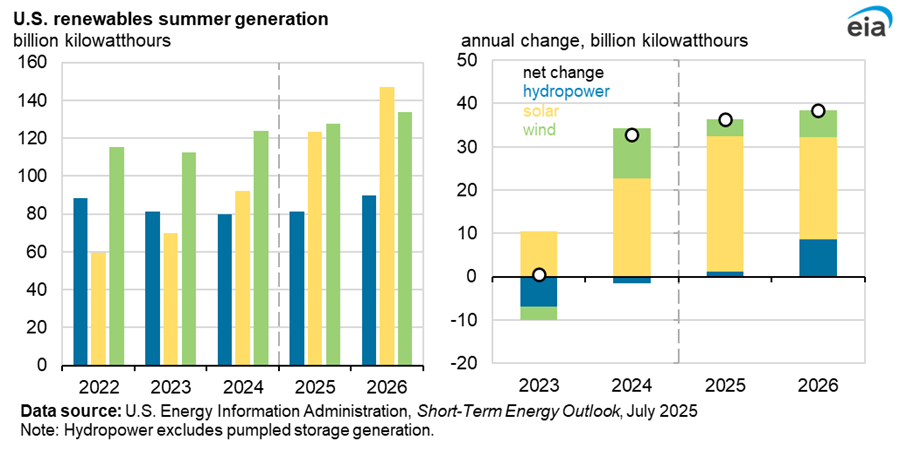
Solar is expected to surpass wind in 2026 to become the largest source of renewable power in the US.
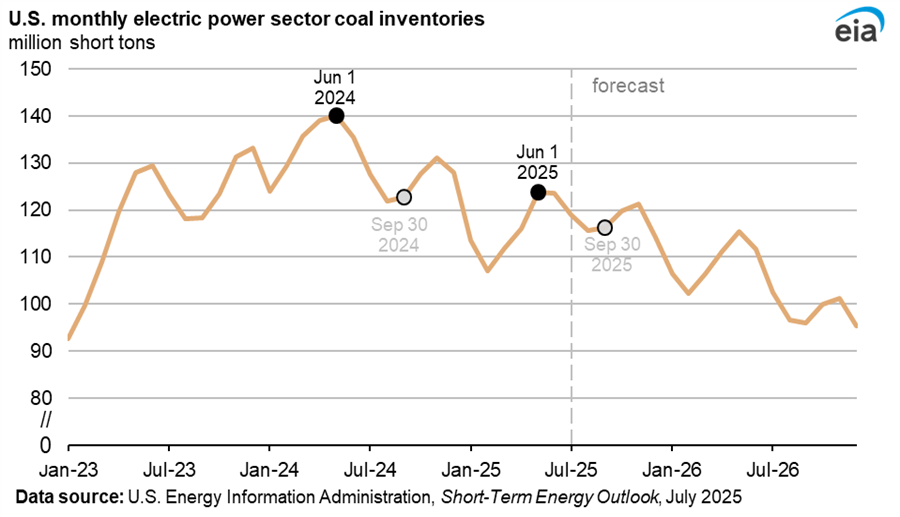
Inventories of coal at US power plants are expected to continue the decline that started in 2024 through 2026.
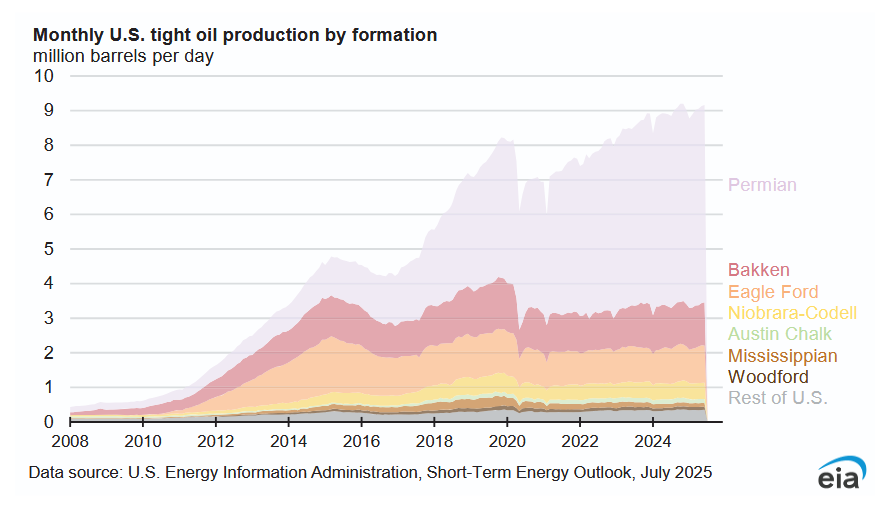
US tight oil output has not increased much since early 2024.
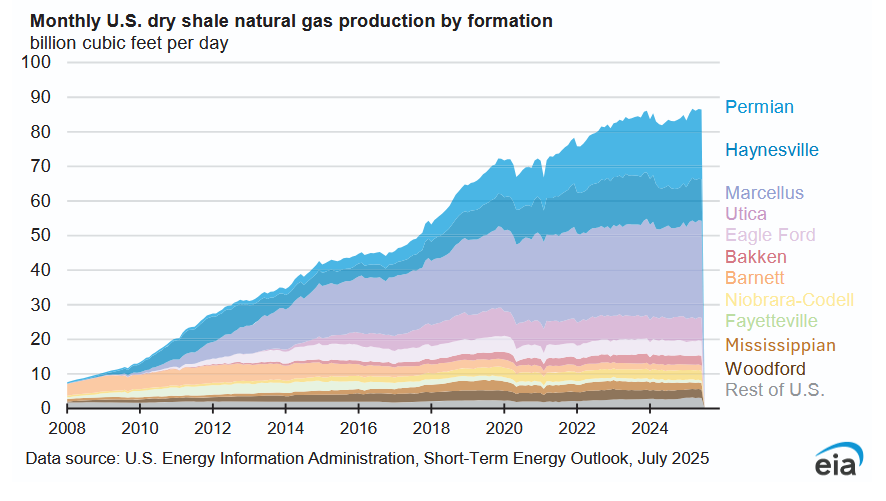
US Shale gas output has been relatively flat since 2023.
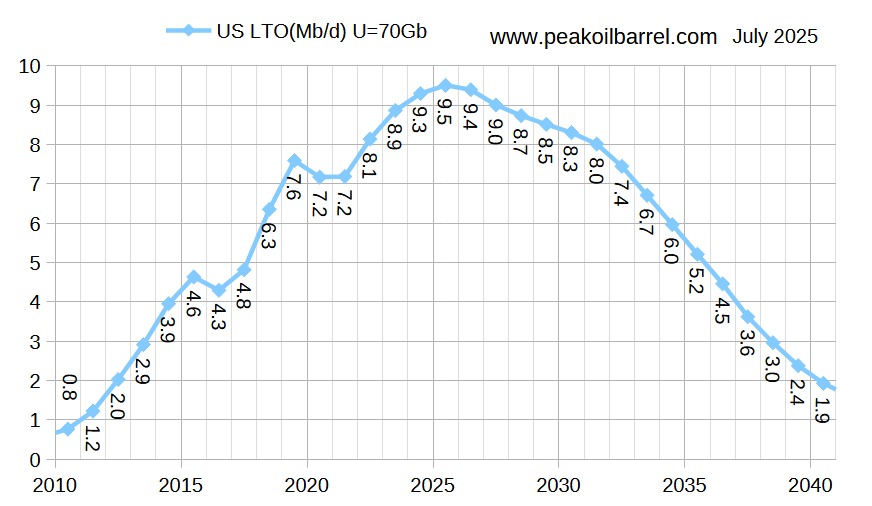
This updated tight oil scenario expects the peak to be in 2025 for US tight oil, a year earlier than last month’s scenario.
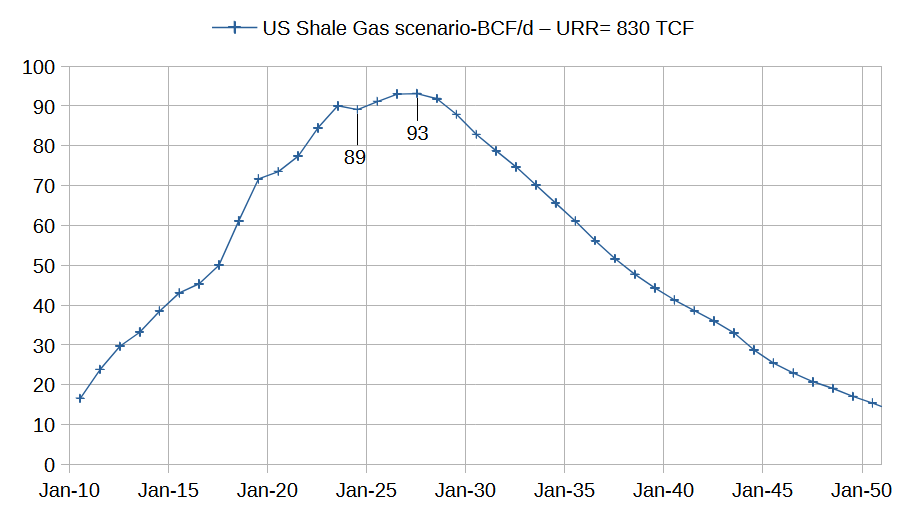
The scenario above attempts to model marketed shale gas production where it is assumed that dry shale gas is about 92% of marketed shale gas production.
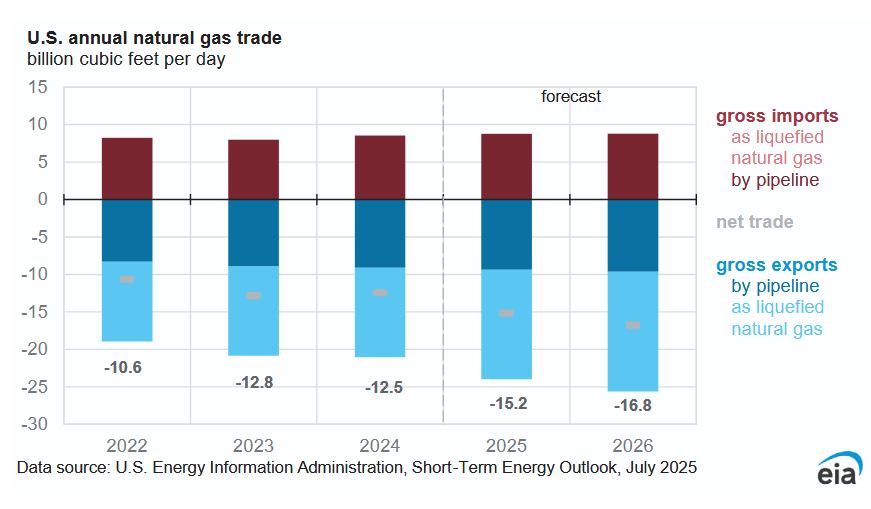
Net exports of natural gas are expected to increase by 4.3 BCF/d from 2024 to 2026 and there are 24 BCF/d of LNG capacity under construction or approved which are expected to begin exports between 2024 and 2030. Assuming all of this is developed and net pipeline exports are unchanged the net exports would increase by 24 BCF/d from 2024 to 2030. It looks to me that unless natural gas consumption in the US drops by 20 BCF/d, there will not be enough natural gas produced in the US to meet the demand from LNG exporters. In the next few years we will see just how much natural gas can be produced in the US, it may be much less than many believe.
185 responses to “Short Term Energy Outlook, July 2025”
Thank you, DC. Looking at your outlook on shale oil and shale gas production, I believe that investments should be made to determine the feasibility of large-scale methane production through methanization of microalgae biomass, another kind of renewable energy. Indeed, it remains only 25 years before 2050.
Thanks for all that information Dennis.
At some point there looks to be a lot of US LNG export capacity that will end up short of product. The populous and industry will eventually demand that domestic consumption be prioritized.
Its a lot of capital at risk-
“Mar 6, 2025 — On its current trajectory, the US LNG Export industry will experience cumulative capital and operating expenditures exceeding $938 billion”
https://www.spglobal.com/en/research-insights/special-reports/major-new-us-industry-at-a-crossroads-us-lng-impact-study-phase-2
Who knows?, but I believe it would be unwise to underestimate demand for Nat Gas, and that increased offtake (pipeline) capacity will enable higher production than you project in the 2030’s.
Hungry data centers are a big ingredient to consider. That industry pays more for electricity, enabling higher production attempts from all sources. Same goes for the electric transport industry demand- will pay more for electricity from any source in the 2030’s as petrol production declines.
Hi Hickory,
My shale gas scenario does not assume there is a lack of demand, but that the resource that is profitable to produce is limited. I agree US consumers may demand that fewer new LNG facilities are built in order to reduce demand for natural gas and keep prices low in the US. The EIA’s most recent AEO has natural gas prices rising to $4.70/MCF by 2047 in 2024$, natural gas exports rise to 32 BCF/d in 2047 from 13 BCF/d in 2024. They also assume that US consumption starts to decrease after 2032 and that US production of dry natural gas peaks in 2032 at 118 BCF/d, but the EIA assumes much more available natural gas than is likely, they expect roughly 1557 TCF of dry shale gas output from 2008 to 2070 (if we assume a linear decrease to zero output from 2050 to 2070.) This is more than 2 times what I expect. Note that the AEO estimate for tight oil using similar methodology from 2008 to 2070 is about 140 Gb, also about 2 times my tight oil estimate.
Perhaps my estimates will be too low. They are certain to be wrong, whether too low or too high is unknown.
Bottom line, both my tight oil and shale gas scenarios are supply curves that are independent of demand for oil or natural gas, I assume oil prices of $75/b or less in 2024$ and natural gas prices of $4/MCF or less. It is possible that ver high oil or natural gas prices might increase the URR somewhat, but I doubt this will be more than 20%, so for tight oil maybe a URR of 84 Gb and for marketed shale gas perhaps a URR of as much as 996 TCF in a high oil and natural gas price scenario. My best guess for URR remains what is shown in the charts in the post with a margin of error of plus or minus 20% for the 95% confidence interval for tight oil and shale gas URR.
On the data centers, they are businesses and will buy the cheapest electricity they can find. If supply of natural gas is short which may lead to high natural gas prices, there will be alternative forms of electric power that are cheaper whether nuclear, solar, wind, hydro, or coal.
I share the view that there may be US gas shortage by the end of the decade. The original plans were based on the assumption that solar and wind would displace some NG generation and the gas would be freed for export. I am not sure about that.
In Canada, however, there’s a gas glut. The way things shake out may be that US imports more from up north…
Kdimitrov,
I guess the US could import natural gas from Canada so they can export as LNG, or Canada could build their own LNG export facilities if they can make a good estimate of their natural gas resource, something that the US has done a very poor job of.
What is the source for
https://peakoilbarrel.com/wp-content/uploads/2025/07/blog250726w-768×446.png
I mean, what is the model, and where are the declining rates for that coming from?
Svaya,
The model s my own based on modelling of Permian basin, Bakken/Three Forks, Eagle Ford, DJ/Niobrara, and other tight oil plays. The decline comes from fewer completions as space in sweet spots decreases and average well productivity declines leading to less profitability. It is my best guess assuming oil and natural gas prices remain at $75/b or less and $4/MCF or less in 2024$. Mostly it is a reflection of a lower scenario for the Permian Basin as rig counts and average new well productivity normalized for lateral length continues to fall as sweet spots run out of room. Scenarios for 4 major tight oil plays and “other tight oil” in chart below.
A worst case, best case scenario would be interesting, fracking wells have notoriously steep decline rates. the curve you put reminds more of the convetional.
Svaya,
The model accounts for the steep decline of tight oil wells. The model matches fairly well with the data. You can just imagine something 20% lower and 20% higher to get a rough idea of the probable range (70% confidence interval). EIA data is red crosses, except Permian based on Novi data, PSM and RRC data for Permian basin.
Svaya,
Here is the Permian scenario with monthly completion rate on right vertical axis, the STEO has oil prices falling to $55/bo for WTI in 2026 so I assume the completion rate falls from about 460 wells per month in June 2025 to 364 wells per month in December 2026, the completion rate remains at this level until December 2030 and then decreases to zero by Feb 2027. Clearly this is a guess, but oversupply of oil seems to be the trend and eventually all tight oil plays will become unprofitable as resources deplete. average well productivity decreases and oil prices potentially remain low due to low demand relative to supply.
Alternative Permian scenario, obviously the future is unknown. For this scenario an extra 16500 Permian tight oil wells are completed and URR increases by about 6 Gb (from 37.5 to 43.5 Gb) for the alternative scenario.
Note that for both Permian scenarios the completion rate up to December 2025 is based on Permian horizontal oil rig counts up to June 2025 where I assume a 6 month delay between the start of drilling and first flow from the well, I also assume DUC count remains at the June 2025 level (no increase or decrease).
After December 2025 the scenarios diverge due to different assumptions about the future horizontal oil rig count after June 2025. The lower scenario assumes that the rig count continues to decline and the alternative scenario assumes that the horizontal oil rig count stabilizes at the June 2025 level until June 2028 with declining rig count after that date.
Using the alternative Permian scenario presented above, we get the following for US tight oil (other basins besides the Permian have the same scenarios as presented earlier). Note that the original US tight oil scenario presented in the post is 71 Gb rather than the 70 Gb on the chart (which was mislabelled, my apologies.)
Chart below shows other basins besides Permian summed up as “US tight less Permian” with “alternative” US tight oil model (URR=77 Gb).
For the Bakken/Three Forks URR=9.3 Gb, Eagle Ford URR=9.8 Gb, DJ/Niobrara URR=2.9 Gb, and Other tight oil output URR=11.4 Gb (this other tight oil group excludes Bakken, Eagle Ford, Niobrara, and Permian tight oil output).
“The U.S. oil rig count just suffered its fastest collapse since the pandemic.
From January to July 2025, rigs dropped 13.7%, the steepest 15-week plunge in five years.
This isn’t just about oil, it’s about inflation, jobs, energy security, and the global economy.
“
https://bsky.app/profile/investinq.bsky.social/post/3luy3xzhhbm2i
Interesting piece from EIA
https://www.eia.gov/todayinenergy/detail.php?id=65824
They predict an increase in Appalachian natural gas output of 8 TCF per year over the 2024 to 2050 period, that is about 22 BCF/d. This is a very optimistic estimate. For more reasonable estimates see
https://pubs.geoscienceworld.org/aapg/aapgbull/article/108/1/15/631779/Forecast-of-economic-gas-production-in-the
About 180 TCF for maecellus in paper above
and
https://www.sciencedirect.com/science/article/pii/S2949891024008613
this paper is quite optimistic with 157 TCF for core areas, though if condensate prices are not high enough, then it might only be about 120 TCF of URR for Utica (they use $80/b for NGL in their economic analysis which is likely 3 times too high).
The EIA’s AEO 2025 reference scenario has Appalachian output at about 52 BCF/d in 2050. A more realistic scenario has Appalachian output reaching about 40 BCF/d by 2029, in 2050 output will be about 6.2 BCF/d or about 46 BCF/d less than projected in the 2025 AEO. This scenario combines a Marcellus scenario with a Utica/Point Pleasant Scenario.
Also keep in mind that the rest of the US besides Appalachia will decline far more steeply than projected by the EIA, output of shale gas besides Appalachian falls by 50 BCF/d from 2030 to 2050. Total US Shale Gas falls from 96 BCF/d in 2030 to 17 BCF/d in 2050 (or by 79 BCF/d over 20 years).
D C,
The Marcellus-Utica gas production is not resources-limited, it is take-away & demand-limited, there has a been a glut of supply and price way depressed.
The solution now is to put AI data-center there, and hope to solve the demand limit.
The Utica Forecast paper (Patzek group) has metric “kTon” and MCF all together, and the less than 300kton for dry gas EUR means 10BCF EUR, this is even lower than Marcellus. Hope they were not confused as the Vaca Muerta gas report where they also confused with “BCM” with “BOE”.
The EIA obviously wants to please the Trump energy policy, they also add 7~8BCFPD for Haynesville EF which might be underestimated if EU and rest of the world eat up all the LNGs. Also, they should expect Gulf of America to decrease in gas when the deep low GOR part takes the major production increase.
The past decades old energy policy has now been reversed,
https://myemail.constantcontact.com/Killing-the-Endangerment-Finding.html?soid=1101509381788&aid=94wt5wchouw
https://www.energy.gov/sites/default/files/2025-07/DOE_Critical_Review_of_Impacts_of_GHG_Emissions_on_the_US_Climate_July_2025.pdf
“A Critical Review of Impacts of Greenhouse Gas Emissions on the U.S. Climate”
Report to U.S. Energy Secretary Christopher Wright
July 23, 2025
Climate Working Group:
John Christy, Ph.D.
Judith Curry, Ph.D.
Steven Koonin, Ph.D.
Ross McKitrick, Ph.D.
Roy Spencer, Ph.D.
The worst player in this group of worsts is likely Koonin, former bureaucrat in the DOE, who never mentions peak oil, depletion, or reserves in this report or the book he has written on climate change.
Hi Paul,
In the future please put this type of comment on the non-petroleum thread please.
Sorry, I was just providing the link to the actual gov’t paper that Sheng WU was referencing per the changed energy policy, not from some denier website.
IOW, see Nick below “Sheng Wu started it!” 😉
But Dad, Sheng Wu started it!
(muffled sounds from back seat)
You’re poking me. Stop POKING me!
(from front seat) Quiet down! Do you want me to turn this car around??
Sheng Wu,
We will see, the Marcellus Saputra paper looks very good. Patzek is a geophysicist, pretty sure the Marcellus estimate of 180 TCF is pretty solid, they used ktons because there is a mix of gas and NGL output in Utica. That estimate for the core areas is about 120 TCF which is probably pretty good, the non-core areas of the Utica/Point Pleasant play will not be profitable to produce unless natural gas prices and/or NGL prices are very high. The Utica paper uses and NGL price of $80/b which is about 3 times higher than reasonable (this is equivalent to about $240/bo for C plus C).
I use an average EUR of 11.8 BCF per well of natural gas for my Utica Model and and average EUR 14.9 BCF per well for my Marcellus model, based on a Hyperbolic fit to Novilabs data for each basin.
The Utica well profile is based on the average 2018 Utica well (last year with 24 months of data to make a decent estimate, 2019 looks very similar), the Marcellus well profile is based on Pennsylvannia data only in 2020 so may be a bit optimistic because the average W V well is not as prolific as those in PA.
D C,
The “ktons” unit might make others having a hard time to compare Utica to other shale gas basins, where “BCF” is often used. The mean more optimistic (without exterior input) EUR of 282 “ktons” dry gas is roughly only 11.5BCF, and this way lower than real core Utica wells which should deliver over 18BCF EUR with mean average.
The first obvious reason for the poor forecast is that there are 1-2 companies drilling in the northern-Middle PA area with non-core Utica, and they are drilling there because they have gas pipeline commitment/take away capacity to New England with good price, so they could drill in the non-core Utica. Also, this part of Utica has shallower depth and therefore D&C cost lower than the real Utica core part in the SWPA-WV-OH triangle area. This should not be inferred as or mix with core-Utica where the cost is higher but EUR is also way higher.
Similar economic/geological reasons for the Utica wells further west of the OH-WV border, and inside Ohio mixed with the wet gas/lean condensate area, here the shallower depth and lower pressure makes the original lean codensate/wet gas shale fluid fractionate into dry gas (non-core performance) and lean condensate liquid, and therefore they are confusing the operators who are just targeting liquid part.
In the end, the gas production is different from oil/liquid production here, it is like Marcellus shale gas production, the larger newer frac designs really lift not only the IP, but also the tail after 5 years. I believe this is also what Patzek forecast EUR deviation comes from.
Sheng wu,
My guess is that the Patzek analysis is fine, their analyses are very good for Permian and Marcellus and the only problem with their Utica analysis is the economic analysis which leads them to conclude that non-core areas will be profitable to produce, I doubt this is the case long term. A 120 TCF URR is probably reasonable (their drilling scenarios 1 and 2), the non-core areas will not be profitable. As far as I know there is no Appalachian Gas going to New England, no pipeline has been built.
There is not much evidence the tail is significantly different with new frac designs.
Also note that my model considers the Average Utica/Point Pleasant well and does not focus on core wells only. Note that the Arias-Ortiz et al 2025 Utica analysis does not separate the wells into core and non-core cohorts it simply creates two cohorts by time (2011-2017) and (2018-2024) with survival times of the newer wells expected to be shorter (about 6 years vs about 15 years for the older wells) and divides the wells into dry gas, wet gas, lean gas condensate, and rich gas condensate cohorts. So my estimate for the average 2018 Utica/Point Pleasant well matches the Arias-Ortiz estimate for the average 2018-2024 Utica/Point Peasant well fairly closely (11.8 BCF in each case). No estimate of “core wells” was done either by me or Arias-Ortiz. The non-core areas of that study are areas where very few wells have been drilled and that is likely to continue in the future in my opinion based on how poorly the wells perform in the lower producing counties.
Estimates by some such as Boswell take a county where 5 wells have been drilled and assume the entire county will be filled with wells in the future that all perform like the 5 that have been drilled to date. Such analyses are likely to be very far from the mark. So far the USGS analyses of mean TRR adjusted downward by about 60 to 65% to account for economics yields a far more reasonable estimate of URR.
Well profiles for PA Marcellus wells from Novi, note the increase from 2018 to 2020 followed by a decrease in 2021 and 2022 (wells from 2018 to 2022 are shown). I don’t have good data on Point Pleasant wells beyond 2018, the data for non-core Point pleasant wells is very sparse, but I am very skeptical of claims that such wells will be profitable. Probably the jump from 2019 to 2020 was high grading. The drop after 2020 may indicate that core areas may be nearly fully drilled and companies may be facing falling average well productivity as they begin to drill in less favorable areas. Link to chart below
https://public.tableau.com/shared/HT659DNFN?:toolbar=n&:display_count=n&:origin=viz_share_link&:embed=y
well profile for core counties of Point Pleasant formation
https://public.tableau.com/shared/6D7YB7DRG?:toolbar=n&:display_count=n&:origin=viz_share_link&:embed=y
core counties are Belmont, Jefferson(OH), Marshall (WV), Monroe (OH), and Westmoreland (PA). Cumulative is about 8.6 BCF at 36 months for these 4 counties for 2018-2021 average well profile.
Point pleasant 2018-2021 average wells from non-core counties in PA, OH, and WV (excludes the 5 core counties in previous chart).
https://public.tableau.com/shared/S6MG7NN5Q?:toolbar=n&:display_count=n&:origin=viz_share_link&:embed=y
At 36 months cumulative output for average non core well is about 3.7 BCF which is about 43% of the cumulative output from core counties. This is why I expect the non-core areas are not likely to be profitable for the Utica/Point Peasant formation and believe the URR will be 120 TCF or less.
For all of these charts just click on chart for larger view.
Also consider chart linked below which shows that longer term the Marcellus wells outperform the Point Pleasant wells after about 50 months for cumulative output for the average 2015 to 2017 wells.
https://public.tableau.com/shared/JN6YWTYRW?:toolbar=n&:display_count=n&:origin=viz_share_link&:embed=y
D C,
I agree that the REAL dry core parts of Utica (WV-SWPA and a small part of OH) have been barely drilled that any projection, i.e. by Boswell, has large uncertainties. Although, the successful wells are indeed spectacular. Probably the D&C cost for these core Utica parts is just too high to justify the the drilling, given there are already low cost prolific Marcellus wells on top in these areas.
But, it seems that Arias-Ortiz&Patzek (AOP) paper’s figure 1 obviously lumped all Dry Gas wells together and did not separately count the 5 wells that Boswell used to count the real core Dry Gas counties.
One of the reasons that the Utica is producing quite some gas right now is associated with liquid drilling, and the dry gas wells in this liquid-rich area is the result of PVT liquid and gas separation(most Dry wells in OH in figure 5a in AOP paper), and certainly not as good as original core real Dry Gas part, which are left in blank in figure 5a in AOP. This lumped average practice also discount the real potential TRR in the real Dry Gas Core counties.
About the Utica wells drilled in norther PA that has connection to New England (actually not direct), here is the info along with what Coffeeguyzz posted:
National Fuel Gas (NFG)’s primary natural gas pipeline infrastructure is located in New York and Pennsylvania, not New England. They own and operate nearly 2,800 miles of pipeline, providing access to markets in the Mid-Atlantic, Midwest, Northeast, and Canada. While National Fuel’s pipelines don’t directly serve New England, they connect with other interstate pipelines that do, allowing for gas transportation to the region.
This really demonstrates that what is preventing drilling in non-core area of Utica/Marcellus is not “non-core”, but rather take-away capacity that could deliver a reasonable price per MCF.
Finally back to Marcellus, the drop in 2022 curves is probably a combined result of exhaustion of “legacy tier1” or start test drilling into “tier2“ (led by Cotterra drilling into the upper Marcellus with shorter laterals), and more drilling into the lower IP wet gas SWPA. But, after 2022, the Marcellus type curve is again back to the highest level, probably a result of improved D&C and longer laterals, but certainly no obvious sign of deterioration.
see,https://thundersaidenergy.com/downloads/marcellus-shale-well-by-well-production-database/
Sheng Wu,
Longer laterals make the wells look more productive, but it does not create greater rock volume, it simply reduces costs a bit, the important metric is output per lateral foot as drilling longer lateral just uses up available rock volume.
You can’t pick 5 wells out of 500 and base the analysis on the best 5 wells, or if you do you will get an estimate that is 6 times higher than is realistic. Does the Boswell estimate look reasonable to you? I would say the mean TRR estimate in Boswell for the Appalachian (1400 TCF) is 3 to 4 times too high. Generally I have found using the average well profile from a play yields fairly good results. Note that when this is done the average well is heavily weighted towards the average core well productivity in any case because most of the producing wells are drilled in the core areas.
Notice on those type curves that the 2023 and 2024 curves cross the 2020 curve at around 10 months, so they have high IP, but look like they may not have very good cumulative production in the long run. A cumulative output curve is more useful in my view.
Sheng Wu,
In addition to the added cost of drilling Deep Utica wells versus Marcellus and the decade’s worth of Tier 1 Marcellus acreage remaining (Patzek’s figure), the SWPA operators stopped targeting the Utica due to the horrendous decline of the majority of the ~dozen Utica wells.
Results like the legendary Scott’s Run (72 MMcf 24 HR IP from a 3,200 foot lateral), the Gault and few others were not the norm. That is why the ongoing results from CNX are so intriguing as their work is consistently producing very high output Utica wells in SWPA.
Another interesting situation is the step out work of Seneca Resources up in Elk and Cameron counties … the very definition of Tier 3 acreage.
As their parent company – National Fuel Gas – guarantees purchase and transportation through their company-owned pipes and large customer base in the Buffalo/Western NY region – Seneca has been able to methodically, systematically learn best practices and locations without the normal financial pressures under which most operators toil.
The results are impressive.
Despite numerous ~10 year old Marcellus wells having produced over 4 Bcf cums – and STILL throwing off a half million cubic feet per day – virtually all the newer Utica wells are producing double the numbers of their Marcellus brethren in the same area.
This doubling coincides with CNX’s results as well as XTO’s single Utica well on its Trilogy pad.
For all these reasons – expansive (and expanding) footprint, ongoing lessons learned, demonstrated superior results from co-located Utica/Marcellus wells – many of us hydrocarbon boosters foresee the Utica ultimately surpassing its Little Brother several decades out.
D C,
I agree that longer laterals also deplete the TRR faster, but the cost-down also help make more 2nd tier more economical, and hence more TRR.
For the Boswell 1300TCF Appalachian TRR forecasts, I would put 80~95% confidence for the Marcellus and 50~70% for the Utica.
Similarly, I would put 30% confidence for the Marcellus TRR and 30~50% for the Utica TRR numbers by Patzek group. One technical note about Patzek model — it is actually based on conventional draining model, and not able to include the true original gas in place, i.e. OGIP, which is highly dependent on completion technique— like Coffeeguyzz discussed here.
The OGIP which still a myth, especially for the Marcellus SWPA and it continues to surprise in the upside for the past 6~8 years.
Sheng Wu,
So are you of the opinion that all og the recent USGS mean TRR estimates are too low by a factor of 2? USGS mean TRR estimates seem pretty reasonable for tight oil plays if reduced by about 2/3 to account for real world economics.
What is your explanation for why their estimates would be so far from the mark for natural gas?
Also note that many of the Boswell assumptions such as a 50 year well life with terminal declinecat 6% are not reasonable and at minimum their -30% scenario is somewhat more reasonable, though even this uses the 50 year well life but uses the more reasonable 10% terminal decline. A better model would assume a 20 or 30 year well life. No downhill repair at 500k will be done on a well over 15 years old, it won’t have high enough ROI to justify. Very few wells will produce beyond 20 years for this reason.
We need to look at both economics and physics to understand the reality of oil and gas production.
Using the Appalachian scenario with URR=338 TCF we get the following for US Shale gas where we assume natural gas prices remain under $4/MCF in 2024 $ and NGL less than $27/b. In 2050 for this scenario output is about 17 BCF/d with peak in 2029 at 100 BCF/d.
As far as I know, no pipeline to New England has ever been approved.
Maildog,
From the western direction, New England receives natty via the Algonquin, Iroquois, and Tennessee Gas Pipeline systems.
Not only does Marcellus gas flow through these pipes, the upstream company subsidiary of National Fuel Gas – Seneca Resources – is drilling Utica wells in Tioga county, PA, which might be sending its output farther northeast via NFG’s Empire Pipeline which hooks up to, I believe, the TGP pipes.
The New Englanders shot down 2 large greenfield pipes about a decade back, but incremental expansion capacity continues to fitfully be implented farther upstream which then allows the ‘end of the line’ folks in Dracut to stay warm during brutal winter cold snaps (albeit at very high cost).
Dennis,
So … EIA now speculates the AB will produce ~43 Bcfd in just a few years and go over 50 Bcfd down the road.
Hmmmm. Didn’t I read on this very site a week or so back someone else claiming almost those exact same numbers?
Oh yeah, it was Coffeeguyzz.
There may be little to be gained for you and I to go back and forth on what future natgas production will eventually emerge from the Appalachian Basin.
When super heavyweights like Engelder, USGS, UT-BEG, Patzek, NETL, et al have projections all over the map, we informed mortals are left with choosing in whom to believe.
Although I’ve spent way too much time on this the last couple of days, I will point out a randomly selected 8 well pad (from Range, Washington county) to show why – to me, anyway – I think Patzek is way, way off in his highly sophisticated analysis.
This Southwest cohort – according to Patzek – should have a ~13 year survivability rate. (I still do not understand his Equation #6 referring (?) to a~33% probability rate).
Anywhoo, the Breese Emma Jo pad came online in 2014 with 5 wells showing online production histories of ~10 years except for one (#8) which seems to be having operational issues.
Cums are 3.4, 3.8, 3.9, 5 and 6 Bfd. They presently flow from ~300 to ~500 thousand cubic feet per day which equates to roughly 30 to 50 thousand bucks per well per month gross revenue.
Some tens of thousands of barrels of condensate have been produced from each well, also.
Now, 3 new wells came online 20 months back.
Cums are 7.1, 7.6 and 7.8 Bcf with condensate production of 85,000, 109,000 and 114,000 barrels.
Big, BIG improvement in output.
Again, Dennis, you and I will – most likely – continue our long running stances of holding near 180 degree viewpoints on US hydrocarbon production.
However, should any of the more curious of your readers choose to ‘jump in’ and read the 44 page 2021 NETL report (author Boswell) and compare it to your linked Patzek report, I believe any and all would be highly impressed by the level of expertise that is displayed in both of these efforts.
Paraphrasing Mr. Patterson, Sir Francis Bacon, and many other wise sages throughout history, choose to believe that which you want to be true.
Coffeeguyzz,
The EIA often overestimates future production. In 2006 the EIA’s International energy outlook (IEO) had World liquids consumption at about 111 Mb/d in 2025 where the current STEO expects about 103.5 Mb/d in 2025. For Natural gas World consumption for the 2006 IEO was expected to be 165 TCF in 2025 where the 2023 IEO forecasts 153 TCF in 2025 (in 2024 World consumption of natural gas was 146 TCF.)
You have faith that the EIA is correct, but note that their recent AEO estimate for the Appalachian has 524 TCF produced through 2050. If we assume that’s the peak and cumulative output to tht point is 50% of URR this would imply a URR of 1048 TCF. This is consistent with Boswell if we assume about 68% of TRR is profitable to produce (Boswell TRR is 1400 TCF times 0.68=952 TCF.) To me the Patzek student’s estimates of 300 TCF for Appalachian shale gas are far more reasonable (Marcellus 180 TCF and Utica/Point Pleasant 120 TCF) and also consistent with the 2019 estimates by the USGS.
Well we also have the fact that the Saputra et al estimate for the Marcellus aligns with the USGS estimate. I would also note that usually Boswell has a number of other co-authors on his papers (much of his published work is on natural gas hydrates which is not closely related to shale gas geophysics) the paper you cite is Boswell alone, could he not find anyone who would sign on to that work?
https://scholar.google.com/citations?user=CpW5Jq4AAAAJ&hl=en
Three citations of the 2021 paper
https://scholar.google.com/citations?view_op=view_citation&hl=en&user=CpW5Jq4AAAAJ&cstart=100&pagesize=100&citation_for_view=CpW5Jq4AAAAJ:xGWFX6Gbr9MC
For USGS Marcellus there is this
https://pubs.usgs.gov/fs/2019/3050/fs20193050.pdf
For Utica USGS see link below
https://pubs.usgs.gov/fs/2019/3044/fs20193044.pdf
USGS Mean TRR for Marcellus when cumulative output to Dec 2018 and proved reserves at end of 2018 are added to mean undiscovered TRR is 273 TCF. For Utica/Point Pleasant the USGS mean TRR is 149 TCF when cumulative production to end of 2018 and proved reserves at end of 2018 are added to undiscovered mean TRR. Total TRR for Appalachian shale gas is 422 TCF and ERR is about 283 TCF if we assume that 67% of mean TRR is profitable to produce. Note that the 338 TCF Appalachian Scenario is 80% of USGS mean TRR and is quite optimistic (probably 55 TCF too high for URR).
D C,
couple of cents here about App gas,
1. Utica dry gas part (including so called 2nd/3rd tier where Seneca is improving fast) still way under-drilled to have confidence close to Marcellus. If well-head price goes up to $4/MCF, Utica could be extensively tested and the potential to give ~500TCF close to Boswell iss not totally mission impossible. One could use Seneca as example as Coffeeguyzz detailed, and you find the progresses Seneca made in Novi link, they are drilling in the non-core Marcellus and Utica and the progress is just spectacular. For now, it is still a wild guess without high confidence, same for AOP biased forecast using the liquid-drilling + Seneca non-core results.
2. Marcellus wet-gas part is indeed amazing as Boswell forecasted, and as we discussed before Saputra work was way too outdated to reflect results/progresses after 2019. The Dry gas core part (Coterra) had some down-side in their reserve when they try to add infill and see obviously lower EUR, but efforts to lower cost with longer lateral and larger frac really extends the core area in the NEPA, not just Coterra in Susqueshanna but also other 2nd Tier counties, and again Seneca is the good example, along with Expand(Chk and Southwestern).
3. USGS 2019 forecasts on Utica and Marcellus are for “Undiscovered” and again outdated, and their “Discovered” forecast numbers are even older and further more outdated than Saputra/Patzek.
4. EIA estimates back in 2006, I am surprised that the upside offset to today’s reality is not that huge, compared to other peaker’s 2011 forecast and particularly given the Covid which basically paused all increase by 5~7 years? I had thought the newly released EIA natty forecast in 2050 is a result of Trump and Chris Wright, but now I have to say they are optimistic with caution and solid facts.
Sheng Wu,
I think you are quite optimistic, the USGS estimates since 2013 have been quite good, just because lateral length increases by a factor of 2 or 3 and well EUR improves as a result, does not mean that play TRR changes, it simply results in fewer total wells drilled as the volume of rock that is productive is unchanged.
For Pennsylvannia wells from 2015 to 2021 here are the well profiles for Marcellus, Utica and Point Pleasant wells, point pleasant lowest and Marcellus highest
https://public.tableau.com/shared/5ZD52MMFP?:toolbar=n&:display_count=n&:origin=viz_share_link&:embed=y
I do agree that estimates for Utica/Point Pleasant are highly uncertain due to so few wells having been completed to date.
If we look at only the best 3 Ohio Counties (Belmont, Jefferson and Monroe) for Point Pleasant wells the well profile is excellent with cumulative output of 7290 MCF at 24 months for 403 wells that started producing in 2018 and 2019. For the other Ohio counties with Point Pleasant wells started in 2018 and 2019 (215 wells) cumulative output at 24 months is only 2975 MCF (41% of the best 3 counties). If these 3 counties were filled with wells (10k lateral on 1320 foot spacing) there could be about 3000 wells drilled. The EUR might be about 1.33 times the average well completed to date so if we increase the EUR from 12 BCF to 16 BCF that would cover these core counties with total EUR of 16 BCF times 3000 or 48 trillion cubic feet for URR, whether the non-core areas with average EUR of 6.6 BCF on average are likely to be fully drilled will depend on natural gas and NGL prices. I certainly think any assumption that these other counties besides the big 3 will be blanketed with point pleasant wells is far fetched.
So far for WV and PA the drilling in Point Pleasant has been very limited, some drilling of Utica in PA but also quite limited relative to Marcellus. The results from county to county have been highly variable and no doubt this is true within counties as well. The Patzek and students analysis for variuos shale gas and tight oil plays has been very good so fat and generally agree with the USGS assessments published since 2013 for Bakken, Permian, Haynesville/Bossier, Marcellus, and Utica/Point Pleasant.
The Boswell analysis seems problematic with very high EUR estimates (50 year well life with assumed terminal decline of 6% which does not match with reality).
COFFEEGUYZZ,
Just read Saputra 2024 paper on Marcellus and indeed there is the intriguing Equation 6, and the hard to believe 13 year survival rate for SouthWest cohorts, and the subs in figure 11 reads something more astonishing –=- “For instance, in the northeast core area,only 75% of wells completed in 2009 survived afte r11yr. The newer wells survive
less longer, so that the average survival probability is only 52%.
Finally, from a parabolic extrapolation, we obtain the maximum
time of well survival of 14 yr”.
Sheng Wu,
Yeah, I was so taken aback by the outlandish claim that Marcellus wells have a lifespan of 13/14 years that I was certain that I must be misinterpreting what Patzek was saying.
Consequently, I meticulously pored over every scrap of info that was presented, including footnotes, formulas, various definitions/stated parameters, yada yada.
While I was inclined (still am) to label the entire effort just ‘dressed up’, contrived bullshit, I decided to dig deeper and glean the actual production numbers/drilling histories of some NEPA and SWEPA counties to see how Patzek came to the absurd analysis that he presented regarding well survivability and lifespan.
Seems like he must have lumped in all the dry holes and drilled-but-never-producing wells along with the ‘normal’ producers we have today.
The degree of distortion that this ploy introduces to honest analysis is profound as Susquehannah county has over 100 plugged wells (mostly early vintage) with 69 being non producers and most of the remaining 32 being virtual dry holes (understandable in the early, wildcatting days).
Same for Washington county with 60 plugged total, 13 being non producers, all of the remaining 47 being dry holes.
Tioga county’s 171 P&A wells undoubtedly contain many of the older cohort that likely were included in the ‘drilled’ or ‘completed’ or ‘developed’ categories that can now be presented under the labels such as “wells from 2010” or some such.
Honest observers such as Dennis are susceptible to being misled by these types of (nefarious?) approaches.
FYI, Sheng Wu, the site Marcellusgas.org contains the complete drill/production/permitted histories of every Pennsylvania horizontal well dating back to the Renz 1. 20 bucks first year, 10 bucks annual thereafter.
Outstanding resource.
Coffeeguyzz,
An honest analysis looks at all of the drilling results, not just the above average wells. Note that the results you see in investor presentations drops the bad wells ond only considers the best wells. In the real world there are costs to failed wells and poorly performing wells, dropping them from the analysis gives a distorted perspective.
Dennis,
I am starting to wonder if you are just stringing me along here.
Of course all wells should be included in any analysis.
If the prior statement “~460 out of ~665 Marcellus 2010 are still producing” includes ONLY about 450 of what might be considered normal, productive wells, about 10 that were producing and then permanently shut in for whatever reason, and the remaining 215 were essentially dry holes and thence plugged … a HUGE difference in ‘analysis’ would be called for rather than making a sweeping generalization that “2010 Marcellus wells have a (fill-in-the-blank) lifespan” based on this cohort with an astronomically high level of non-producers.
Yes, include them all.
Yes, describe how ~20% were dry holes (precise numbers are accessible for anyone wanting to wade through them. This 20% figure roughly syncs with the ~200 Developed/Permitted pre-2012 Pennsylvania horizontal well profiles that I saw.)
Yes, ABSOLUTELY include the <5% that were producing and then plugged. If possible, determine the most plausible reason for the plugging. I found exactly 3 wells – out of ~200 – that were producing minimal amounts after years of respectable output and were thence permanently shut in.
If you – or anyone – thinks presenting the proposition that about 1 out of 3 'typical' Marcellus wells 'goes dark' after 13/14 years online is an accurate assessment, then you are either wildly delusional or – in the specific case of the author of this report – possibly motivated by some other factors beyond objectivity, accuracy and honesty.
This is my final post on this topic, Dennis.
Like many others, I appreciate the efforts of Ovi, Mr. Patterson , and yourself in keeping this site a'runnin'.
More attention on the Gas World might be of benefit to all as your whrleys are lookin' like they need some he'p keeping the lights on.
Should we understand that they reinvented the concept of “renewable” natural gas resources in the subsoil? The Soviets assumed that hydrocarbons are generated by abiotic processes (= eternal resources of oil and gas). Moreover, this prompted them to look for evidence of the existence of natural hydrogen emissions (no hydrogen, no production of hydrocarbons from CO2) on their territory and that, in fact, they found, even if it has no direct relation to hydrocarbons. In fact, it would seem that the flow of hydrogen in the crust participates in the maturation of oil. Hence the observation of the absence of hydrogen flow in the immediate environment of oil deposits.
haha, blame oil and gas for supression of Hydrogen in nature?
The hydrogen isotope of oil and gas are not supporting this idea of crust hydrogen participation of oil and gas maturation.
The initial guess of the giant Urengoy gas field (1/3 of the global gas reserved in the 1980s) is the result of abiotic or biogenic, but later carbon isotopes of C123 solved the mysteries — they are thermogenic decompositon of organics 100s of millions years ago.
Permian Basin fracking falling faster than expected
This fracking company is losing money.
Fracking in the Permian Basin is declining faster than expected due to tariff uncertainty and OPEC+ production hikes, ProPetro (NYSE:PUMP) CEO Sam Sledge said Wednesday, according to Bloomberg.
There are now ~70 hydraulic fracturing crews working in the world’s largest shale patch, down from as many as 100 at the start of this year, Sledge reportedly said on the company’s earnings conference call.
“The completions market in the Permian Basin continues to face challenges,” the CEO said on the call. “Increased market uncertainty driven by tariffs and rising OPEC+ production has resulted in more idle capacity than anticipated.”
ProPetro (NYSE:PUMP) -13.1% in Wednesday’s trading after reporting a surprise Q2 GAAP loss and a 9% Y/Y decline in revenues to $326M.
https://seekingalpha.com/news/4474549-permian-basin-fracking-falling-faster-than-expected-propetro-ceo-says
Ovi,
The steep decrease in Permian Basin horizontal oil rigs since March (roughly a monthly decrease of 8 HORs per month) is likely to result in a big drop in completions over the Sept 2025 to Jan 2026 period (assuming a 6 month lag between start of drilling and first flow from the well). This would translate to a drop of 36 completions over 3 month period and if the horizontal rigs continue this rate of decline for an entire year (annual rate is about 94 rigs per year) the completion rate would drop by about 162 from about 460 per month recently to 298 completions per month in Sept 2026. Not sure it will get that bad, but if oil prices drop as much as forecast in the July STEO it seems a possibility. Scenario for Permian with these assumptions below, completion rate constant from Sept 2026 to Dec 2035.
US May Oil Production at New High, Barely
US production up by 24 kb/d. GOM biggest gainer offset by biggest loser ND.
EROI
in simple terms EROI tells us how many man hours of work do we get out of a fuel that take one man hour to acquire.
In the 1950s the greatest return was achieved from oil, one man drilling for oil would produce the oil equivalent of 50/80 men working full time. An incredible source of power, which was used to build roads, homes, power for tractors and so much more.
Coal is just as great a source of power, one miner could dig an amount of coal which would do the work of 80 men or more. It powered the Industrial Revolution, enabling the manufacture of millions of tonnes of steel for rail, bridges and buildings.
Gas was the best, with an EROI of up to 100 to one.
https://jpt.spe.org/plummeting-energy-return-on-investment-of-oil-and-the-impact-on-global-energy-landscape
However EROI for all these wonderful fuels has been falling globally for decades. What took one man to produce enough oil to replace 80 labourers now take 4 or 5. This increase in effort required explains why oil prices have increased from lows of $12 a barrel to $70 and more.
The declining EROI has been hidden by ever increasing oil production, but that is coming to an end.
Analysis of declining energy return suggests that we are already at peak energy return for oil. The days of more and more energy slaves to help us are over.
The same can be found for coal, with a few exceptions, coal is becoming harder and more costly to mine. EROI from coal is down from 80:1 to around 20 or 30:1 and will continue to fall. When coal production peaks we will have to replace not just the declining tonnage but the falling EROI also.
Gas is the same, unfortunately this fact is hidden by reckless overproduction at the moment. This happy situation of lots of gas, low prices and massive amounts of money pouring in from exports will soon reverse.
Lower gas production, increasing costs poorer energy return will hit hard and faster than most people realise.
If this was not bad enough, droughts are rendering millions of hectares of land unproductive without irrigation and this adds considerable additional energy needs to farms all over the world.
Ridiculous statements such as energy requirements per GDP are falling fail to understand the basic needs are water and food. Both of which are needing more and more energy and chemical inputs to deliver. All with a global population that has increased by the equivalent of 70 SAN Francisco last year and the same this year.
This is why along with large increases in wind and solar, coal, gas and oil have increased greatly in the last 10 years.
With EROI peak and a continued increase in population we are now in a new reality of an ever shrinking pie.
Peak water and peak EROI are already impacting food prices and this will only get worse.
Intuition tells me that you are correct, sir.
what about nuclear power plant EROI?
Sheng Wu,
Any insights on what the EROEI for a nuclear power plant is? Chat GPT says 50-70 for light water reactors, does this seem reasonable?
DC,
my chatbot says 75:1 for nuclear power plant
from my AI source.
The energy return on investment (EROI) for nuclear power varies significantly depending on the study and methodology used, but generally falls within a range of 20 to 80. Some studies have found lower EROIs, even below 1, while others, particularly those focusing on centrifuge enrichment, estimate it to be as high as 40 to 60, according to the World Nuclear Association. This wide range is due to variations in how energy inputs (like mining, construction, and fuel enrichment) and outputs (including waste heat) are accounted for
Who’s making the huge profits from the 20-80/1 EROEI being reported by these AIs??
If a machine costs 1 to build and operate but returns say 50 times that amount, then someone is making a huge return on this, so who?
If the answer is no-one is making a huge profit, then the initial assumptions and methodology of working out the EROEI has to be incorrect.
There are several reasons why that argument doesn’t hold:
1st, E-ROI is very different from $-ROI. When you say “If a machine costs 1 to build and operate but returns say 50 times that amount,” you’re talking about $-ROI. Even with energy production, labor costs are more important than energy costs. So E-ROI doesn’t tell us very much about $-ROI.
2nd, someone is making money: the consumers. Wind and solar investments and production and pricing are far more competitive than fossil fuels. They’re manufactured and the manufacturing business is incredibly competitive and ruthless, especially in China where solar and wind producers are losing money hand over fist, just as early auto manufacturers lost money until most producers were forced out of business. So oil producers make money because they’re operating in a monopolistic environment where OPEC can restrict the supply and keep prices higher than they would be otherwise. Renewable manufactures don’t have that advantage, so their industry isn’t nearly as profitable.
Here’s the basic principle: in a monopolistic market reduced costs mostly benefit producers. In a highly competitive market reduced costs flow to consumers. This is, or course, why Adam Smith said that whenever producers in any industry get together, the first topic is how to eliminate competition.
3rd, EROEI is a very misleading ratio.
If EROEI goes from 100:1 to 50:1, that sounds very important, right? But it’s a change from one unit of input for a return of 100, to an input of two units.
Let’s take an example simplified for the sake of illustration: you’re drilling a well, and it takes 1 gallon of diesel to produce 100 gallons of oil. Let’s say diesel costs $2.50, oil sells for $60/barrel (or $1.50 per gallon), and it takes $30 of labor to produce a barrel of oil. That means that your cost is $31 (labor plus .42 gallons of diesel for your 42 gallons of oil). Now….EROEI goes to 50:1. What’s your new cost? It’s $32. Not a big change.
And…at 100:1 you start with one gallon and end with 99 gallons more. At 50:1 you start the day with 2 gallons, and at the end of the day you’re left with 98 gallons more. A 1% loss – not much. Certainly not a 2 to 1 change. The same logic applies to smaller changes: going from an EROEI of 50 to 15 sounds like a very big deal: it appears to be a 70% reduction! But it’s not: you go from 98% net energy to 93% net energy, which is a 5% reduction.
EROEI is not very useful. Cost is useful. Net energy is somewhat useful. But EROEI is mightily misleading.
Iver
Are you familiar with the two more recent pieces of work on EROI below? They are helpful in their use of consistent approach to analysis of boundaries to compare EROI. The work by Aramendia et. al. focuses on useful stage energy rather than the old ‘well head’ type of approach. Similarly, Murphy et al attempt to implement ‘methodological consistency’ to compare EROI at point-of-use.
https://www.mdpi.com/2071-1050/14/12/7098
https://www.nature.com/articles/s41560-024-01518-6
Comments on the 914:
Oil:
1. Overall, USA up slightly to new record at 13,488 thousand bopd. This is up 20 from last month. (Itself revised down 4 thousand bopd, if memory serves, did not check.)
2. Not sure what prices were like back then and shale is rather responsive. We are/were probably near a sort of equilibrium price. They just went up a few bucks, from tarriff/sanction jitters, but the long term outlook is more mid 60s.
3. FGOM up a fair amount, but it is very classic megaproject oil. Driven by long ago project timelines as well as hurricane up/downs. Definitely hanging in there a lot better than the naysayers (e.g. Kaplan) thought a decade ago. Still remember him laughing at EIA. Not just having a different outlook, but saying he couldn’t conceive how they differed from him. (Maybe he should figure out…might help any future work of his. Then again, peakers don’t actually rethink their methods/biases. Just shift the goalposts and pat themselves on the back for “adjusting to facts”, when they didn’t really adjust enough, didn’t consider the flaws of their approach itself. In his case, the detail-filled bottoms up field stacked area charts. Where I truly commend his knowledge, but criticize the lack of self reflection, when the EIA top down assessment did better than his bottoms up work.
4. ND down a fair amount. Prolly weather. Donno. Should be getting warmer, but maybe mud season? I anticipate a rough flatlining, with summer up and winter down. ND already kicked my ass last time and validated Ovi. [Hangs head in shame and bends over for wet noodle whipping.] I don’t think it will fall off a cliff (not a doomer). But it will sort of flatline for a long time. Ah well…we’ll always have those memories of the 2012 man camps! And Rune Red Queen. And Piccolo. (TOD writers.)
5. TX and NM almost flat.
6. Little MT passing LA. Mwahahahaha!
7. Oh…and look at OH! Another record. I love that App production!
————
Gas
1. Up slightly (0.1 BCFD), but almost flatline. If we look at lower 48, exclude the AK confounding, it is up 0.2. Still almost flat. Not bad for heading into summer though.
2. LA continues to increase. Very interesting. And amuses me with the David Hughes and Art Berman and Tad Patzek types who said 10-15 years, Haynesville was post peak and that shale gas was a mirage. Kaboom! Facts…crushing them.
3. Rest of the states not much interesting.
When do you think US oil production can get to 15,000 thousand bopd?
Never, at current prices.
At $100/bbl, 18 months.
P.s. https://www.youtube.com/watch?v=wRxHYHPzs7s
Something that is underappreciated about the GOM is the “staying power” of alot of the big, old legacy fields like Mars-Ursa (still over 140 kopd), Thunderhorse and Thunderhorse North (over 140 ), Tahiti-Caesar Tonga (around 110), Mad Dog (around 120), Jack-StMalo-Julia (around 120). If you look at GOM drilling activity, alot of the activity is in these fields- helping to maintain production.
The new projects like Anchor, Whale, Ballymore and Shenandoah also help arrest decline and lead to some increases.
Chart of production from those fields going back to 2020.
Thanks Bob,
I assume this is more than you expected in your mid-case scenario, am I correct?
Looking back on your update in 2022, perhaps this aligns better with your high case scenario.
Dennis,
The fields/field complexes that I highlighted above are maintaining production a little better than I thought they would 3 years ago. I thought Mad Dog would be higher now (because of Mad Dog 2, which has, in my opinion, underperformed a bit), but all the other fields have more than offset that.
In 2022 my estimated midcase EUR for the GOM was 36 billion (range from 31 to 42). Now, it’s 37 billion (range from 32 to 42). As time goes on, this range should narrow down, right!
In 2022 my projection for 2025 production was 1.7-1.8 mmbopd, which is pretty much in line with what we’ve seen so far in 2025.
Thanks Bob.
Hope all is well.
Amazing that majority of these deep water GOM fields have medium density oil (API 27~32deg), and GOR should also be lower ~300scf/bbl and yet they could have upside EUR.
NGL production continues to climb.
https://www.eia.gov/dnav/pet/hist/LeafHandler.ashx?n=PET&s=M_EPL2_FPF_NUS_MBBLD&f=M
1. New record at 7.4+ MM bopd.
2. There is some seasonality, but if you look at yty, it’s still up a little over 0.4 MM b(stuff)pd. This is normal…has been climbing 0.5 MM bopd/year for many many years now. Stronger growth than C&C, or dry gas, or wet gas!
3. Note that this is ALREADY a part of the 914 wet gas. However, of course, if you eschew looking at the 914 wet gas reports and look at dry marketed, than you need to look at NGL in addition. It’s actually more valuable than dry gas (and less than C&C). I guess you can also look at marketed, wet. I’ve never bothered…for one thing, you can’t look at state to state trends then.
That’s Great News.
– Ethane occupies the largest share of NGL field production. It is used almost exclusively to produce ethylene, which is then turned into plastics. https://www.eia.gov/todayinenergy/detail.php?id=5930
I couldn’t imagine a world without plastic and plastic bags, just imagine the expense of having to go back to biodegradable paper wrappings? We wouldn’t have the trees left to make them anyway. A polluted environment is a small price to pay.
I find most of the peak oil movement is driven by environmentalism bias. Look at how the Post Carbon has pivoted from being mostly about peak oil to mostly about reducing consumption.
It’s fine to be pro environment. But you should not let it affect a rational estimate of reserves. IOW, just because you hate it, doesn’t mean we are running out. (Look at coal for example!)
In theory, the peak oil fad was about people doing amateur reserves analysis, and just coming up with low numbers. But it really wasn’t some unbiased, scientific assessment. Instead it was driven by “wishcasting”.
That’s why I respect Monbiot who said “I was wrong…there’s enough to fry us all!”
Could you explain the rationale behind your estimate of reserves?
Humility? ;-0
I don’t set myself up as an oracle and am skeptical of those who do. I do value having people make estimates. Gives me something to critique and consume. But even then, I take it a lot better when the people doing so, have appropriate caveats about uncertainty and their level of expertise. And not just after making a bad call, but when making new ones. Unfortunately, there is a lot of demand for feeding the lowest common denominator readers…and that market wants red meat, not caveats and not Bayesian (even casually Bayesian) formulations.
Note: this is not just a peak oil issue. But applies in politics and political blogs/Twitter. It is a very well known thing called “wishcasting” that opinion writers of either left or right wing will generally make predictions that are biased in the direction of what they want to happen. (For the few that don’t, they are reviled and called doomers!)
You will see the same thing on Ukraine war blogs/chatter, with both sides having the less reflective writers and content consumers biasing their reporting and predictions in the direction of what they want to occur and the more reflective and objective writers being called doomers.
You see the same thing on sports blogs/Twitter. With fan writers and readers routinely overestimating the probable success of their teams. (In this case, the betting markets give a valuable external comparable.)
“It’s fine to be pro environment. But you should not let it affect a rational estimate of reserves. IOW, just because you hate it, doesn’t mean we are running out. (Look at coal for example!)”
Well anon, I’m not really pro environment, I was just pointing out where those hydrocarbons go and the consequences. NGL’s don’t go into transport fuel, so in that sense you can’t count them when you consider our peak oil dilemma. They are accounting smoke and mirrors, nothing more. Just because you hate the idea we are running out of transport fuels won’t stop them running out.
They are a co-product. Look at the classical economic study of chlorine production (with caustic being the co-product). Gas (and rich gas) is a co-product that (generally, assuming you have pipeline outlets) supports oil drilling.
I do agree that (mostly) NGLs are a petrochemical (“plastics”) feedstock. And of course natty is mostly going into heating and electrical production. I.e. both mostly not transport uses.
“Just because you hate the idea we are running out of transport fuels won’t stop them running out.”
Certainly…me “hating the idea we are running out” won’t change what will happen. Uh…greed! 🙂
Similarly, greenies loving the idea of oil scarcity won’t make it happen. That’s why I brought up the example of coal. You probably super hate the coal! But at least you realize that doesn’t stop there from being a lot of it. Remember Jimmy Carter saying the US was the Saudi Arabia of coal!?
It’s important to try to disaggregate what you want to happen from what you think will happen.
And to be sensitive to those (from whatever direction) who allow their biases to affect their forecasts. That goes double on commented blogs or forums or Twitter where there is a social dynamic and feedback from the various echo chambers of left/right bias.
many plastic bags now are bio-degradable
Actually you can look at state output of marketed natural gas and this is the number that reserves are based on.
see https://www.eia.gov/dnav/ng/ng_prod_sum_a_EPG0_VGM_mmcf_m.htm
and for reserves see table 3 at
https://www.eia.gov/naturalgas/crudeoilreserves/
Nice. Thanks.
D C,
Thanks for the links from EIA.
These are proved reserve numbers, and therefore much lower than TRR or URR numbers, i.e. Utica probably could give 100TCF forecast TRR by AOP paper, or USGS undiscovered nearly 100TCF P50 in Utica, but here only OH has about 30TCF proved reserves and almost all in Utica.
Amazing that the WV PA proved reserves is already ~150TCF (2022~2023), and most are Marcellus, and therefore,
1. with the already ~50TCF produced by 2023
2. the undiscovered P50, e.g. the 2019 USGS P50, and the already produced,
The TRR could easily close to 300TCF for Marcellus?
Sheng Wu,
For the 2019 USGS Asssessment we would use proved reserves and cumulative production as of Dec 31, 2018 and then add that to mean undiscovered TRR to arrive at a TRR estimate.
https://www.msn.com/en-us/money/markets/chevron-entry-to-guyana-oilfields-solves-companys-top-challenge/ar-AA1IRVDL
After Trump boots Chevron out of Venezuela
HOUSTON (Reuters) -Chevron’s imminent entry into Guyana’s rich offshore oilfields solves one of the biggest problems dogging the U.S. major: where its growth will come from beyond the next few years
US Natural gas has become wetter over the 2010 to 2024 period, perhaps due to increasing shale gas output. From Jan 1997 to Dec 2006 about 35 barrels of NGL were produced per million cubic feet of natural gas produced, in the most recent 12 months NGL output in b/MMcf of dry natural gas had increased to 68, nearly double the earlier period.
Nice chart. Agreed, you can see the associated gas effect, with a lot of rich gas, from 2010 forward, as the US went through an oil production boom. (Along with other effects like gas decaying faster than oil, so replacement drilling at 13ish MMbopd from 2019 to now, has still resulted in growing rich output gas, along with, perhaps LTO having more ass gas than medium/heavy crude, maybe also some rich fields on their own like the south Marcellus and Eagle Ford.)
Of course this means that marketed wet gas has become MORE valuable, not less. As generally NGLs are intermediate in value between dry gas and C&C. So, it’s actually more of a feature than a bug that the extracted gas is “full of NGLs”. (Not saying you don’t realize this…more for the hoi polloi.)
P.s. The other thing going on for NGL growth is not only has the “wetness” been increasing (NGL/dry), but dry itself has grown as well. So, the NGL growth has sort of compounded from these two effects. [And not saying you don’t realize this. Just my own realization, looking at the chart and wondering why it was less dramatic than the NGL absolute growth.] https://www.eia.gov/dnav/ng/hist/n9070us2a.htm
Nony,
Agreed, I created the chart because when I look at NGL growth it is even faster in percentage terms than the natural gas growth (which has been phenomenal since the tight oil and shale gas boom which started around 2007 or so.)
Nony and D C,
probably the faster NGL than dry gas is a combination several factors,
1. the shale oil production getting gassier, and this brought up more NGL, particularly the C4+
2. the prolific wet gas/condensate producers in WV+PA (Marcellus) and OH (Utica).
3. depressed dry gas price
Mike Wirth, Chevron Chairman and CEO states Chevron has reached plateau in the permian of a million barrels per day and can maintain it though the end of next decade with less than past prior investment and increased cash flow.
https://www.youtube.com/watch?v=bye__9Y5LXQ
Chevron Hess deal finally closed. While I had thought the synergies with Exxon were much higher, in both Guyana and the Bakken, it may be that XOM prefers to have an offshore partner and manage nationalization risk.
Not sure how CVX will approach the Bakken assets. It is not a premeir asset but is quite sizeable and is medium quality within the basin. E.g. divest, manage normally, or even aquire more. Any chatter here?
Nony,
Bruce Oksol just floated the idea of either Chord or Harold trying to buy Hess’ legacy assets (463,000 net acres).
Makes sense, especially if/when EOR starts to take hold.
1. So you are in the divest camp. CVX will keep the offshore assets and ditch the Bakken. Could be and makes sense. If so, they will just sell it to whoever pays the most. Little hard to predict that, but the two you mentioned would be possible buyers…definitely people that Goldman would send a prospectus to! 😉
2. It’s 2025. I been hearing about this shale EOR for 10-15 years now. When is it actually going to become something more meaningful that EOG PPT hype? 😉
Trump to fire BLS commissioner after bad jobs report
Is this a sign of what is to come as CPI gets worse and Oil production starts to drop?
https://thehill.com/homenews/administration/5432523-trump-fires-bls-commissioner/
Nothing new here. The right side of the political spectrum in the US is increasingly uncomfortable with math and science that does not conform to their ideological preferences.
https://www.nature.com/articles/s41562-025-02147-z
https://www.pewresearch.org/science/2024/11/14/public-trust-in-scientists-and-views-on-their-role-in-policymaking/#:~:text=Democrats%20continue%20to%20express%20more,making%20policy%20on%20scientific%20issues.
Yes, when oil production starts to drop it will (again) be blamed on environmentalists and regulators not letting industry drill.
T Hill,
When oil production or natural gas production drop, the Energy Secretary will be fired. Obviously nothing can be Trump’s fault
hope GOA oil and ABEH gas could help Chris Wright keep his job.
Oh, yeah. I voted Republican. I must not know how to do any math or science or engineering. I do stupid things like adding 10 plus 15 to get 25.
Oh well…I guess all the NPR-listening midwits can dazzle me with their science. Oh wait…that should be upper case “Science”. Need to venerate it, like a religion. A tribal religion. For the “Fresh Air” NPR listeners and Woordle-playing NYT readers.
[Not saying everything should be for me, just expressing a thought.]
I (and perhaps others) would have value for a “for dummies” explanation of GOM production. Not even the whole peak oil thing…but the explanation of areas and fields and operator and all that. With a reasonably long span of time and areal extent. Honest, it’s a blizzard of Wardogpighammer names, which I lack a feel for versus how I have a feel for different shale basins. Yes, I realize the FGOM experts know this stuff, but I bet most of the readers are, like me, in need of a dummies “who’ who in the zoo” primer first.
——–
And please…not the field by field stacked area charts! It’s a miserable format for actually conveying information. Dennis’s single line charts are much more beautiful and convey insight better. I do some investor/CEO MBA-ish style communications…and really stacked area charts are reviled. Maybe not quite as bad as 3-D columns, but…uck.
Stacked area charts are sort of show-offy in detail (many series, lots of time granularity), but the reader can usually only really read the top/total, unless there are three or even just two series. It’s also, often unclear (and unthoughtful) on how the series are ranked (e.g. largest on bottom). So you are really not conveying an illustration of a message. You’re blasting all kinds of detail, which the reader can’t actually parse (like what the middle series is doing over time). Like who really cares that we had a hurricane in JUL in 2008 and one in OCT in 2010? (Made up example.) Or even worse that the Manbearpig field recovered from the (made up) JUL08 ‘cane in AUG08, but the Umptifratz field didn’t recover until DEC08. It’s data overload, not relevant in retrospect, and not even readable given the stacking format.
You’d be better off with more separate charts/discussion rather than the all in one 20-color area chart with monthly data. Like honest…many individual charts (along with thoughtful discussion) rather than the omnibus area chart.
Line charts are generally more useful. If stacked charts must be done, the series should be kept to a small number (for example by grouping into categories) and the time granularity should be reduced to years (in which case, show stacked columns). Also consider to just show a line chart with several separate lines (as a separate and second chart, after the total over time).
Maybe my GOM summary from 2022 would help.
https://peakoilbarrel.com/2022/05/
The stacked field production chart above was to illustrate the point I made that the production from these fields/field complexes has remained pretty flat since 2020. The chart illustrates that pretty well – sorry if the field details are confusing, but, I suspect, if I hadn’t shown the field details, someone might have asked “What are the field details?”
At a quick look, the charts seem WAY more readable than Kaplan’s 20-color stacked chart things. Will take some time to read it.
Really…I think the primer is more needed for now than an “update” (emphasis on recent events) or a prediction. I’d also like some sort of super simple “getting arms around the basic” like TX/LA/FGOM categorization. Like operator 100% chart. Like 100% categorization by depth. (Current view would be fine here. Perhaps a time series makes it too complicated.)
Even for the “name blizzard” of fields some branching tree hierarchical organization/table would be helpful (probably with higher level plan view area as the controlling variable, not depth or strata or operator. After all the “where” on the map, sort of drives infrastructure.
Nony,
Search on Bob Meltz Peak Oil Barrel and SouthLAGeo Peak Oil Barrel, he has done at least 3 posts, maybe 4 and all have been excellent in my opinion.
Will do. And I guess, I could look at other resources (outside of this site) as well.
Nony,
Yes, just pointing you the sources here, there is also much info at BOEM, if you look at the comments for Bob’s posts there is some discussion about this and links to BOEM reports. No doubt there is more out there.
Regarding the EIA projections of APP gas growth, I think they are unreasonably high, but not for Dennis’s reasons.
The reason why growth has been limited for the last several years is that demand is constrained because of the difficulties piping gas out of the basin, along with the lack of growth of local demand. This is clear as day if you look at how low local prices are for gas in the App! It’s not flatlined because of lack of resource. It’s flatlined because the pipes are full and the Donks won’t let more get built. Look at the many large pipeline projects that the greenies were able to kill. Constitution, Atlantic Coast, etc. etc.
I think EIA is underestimating the future difficulties in getting those pipes permitted. Their process sort of assumes that if there is not a hard law against something that the infrastructure will get sorted out in time, driven by economics. But we already have 10 years of experience with the Northeast showing this is incorrect.
I do think their LNG growth/location projection is reasonable. (After all, there will be no more Atlantic LNG projects…and even if you COULD get one built in a blue/purple Midatlantic state, you couldn’t get the new pipes needed to supply it! But I think this Gulf Coast demand will be met more by production from TX/LA, perhaps with a slightly higher projected increase in Henry Hub. There’s a lot of local resource in the EF/H that comes on as the price goes up…it’s a resource pyramid.
We’ve had the discussion before about the App and I disagree with Dennis’s pessimism. Think the crazy high resource estimates are the correct ones. Patzek and USGS have a long history of underestimating shale. And analysis of App resource based on history of drilling density (essentially the implicit methodology of USGS, with a hidden economic variable) is very much confounded by the very low regional prices. So…App basin will grow slower than EIA predicts. But last longer than Dennis predicts.
IOW, sort of the opposite of the Roy phenomenon. A dimmer light, lasting a long time!
https://www.reddit.com/r/bladerunner/comments/g7qojz/the_light_that_burns_twice_as_bright_burns_half/
P.s. Neither do I think that local demand will grow that significantly either. Bitcoin is a Ponzi scheme and an environmental affront that is more wasteful than flaring!
Nony,
I agree demand may be the main problem currently, but I also think that as demand expands the gas production increases will be limited as the resource is more limited than Boswell’s paper projects (it uses unreasonably high EUR estimates). Welllife is assumed to be 50 years, not happening for a horizontal well with high cost downhill repairs knocking out any well over 15 years old.
The USGS prediction for the Bakken/Three Forks in 2013 was quite good and the Eagle Ford and 3 Permian assessments were also pretty good or perhaps too high. The EIA AEO 2025 has Appalachian natural gas output at about 700 TCF (assumes output goes to zero linearly to zero by 2070). My scenario is about half that based on my best guess for tight oil plays vs USGS estimates where ERR tend to be about 62% of TRR on average, You are wrong that the USGS usually underestimates, this only happens when they have very little production information.
Marcellus/Utica midstream companies can build pipelines to places other than the Northeast, to mid Atlantic coast, Midwest, etc, lots of Republican territory where the natural gas can go, The could Build a pipeline to the Gulf coast, though I tend to agree it may be hard to compete with Haynesville/Bossier.
Bottom line, since 2013 USGS assessments have been pretty good or perhaps a bit on the optimistic side (if one makes the incorrect assumption that 100% of TRR is a likely outcome.) So I am sticking to my guns here, the EIA is being too optimistic both on the supply and the demand side.
You were using USGS estimates as late as 2018 (even if done pre 2013), that ended up being dramatically wrong. The whole Permian fiasco of your science presentation having been just (a month before) doubled by a USGS revision, in 2018. Unless you have some process to prove when to trust a USGS estimate and when not to, I am skeptical of your idea that they are now OK. Certainly, it is fair to say that you relied on USGS at times when it did end up proving unreliable (despite being warned of the possibility of upward revisions). Maybe you’ve learned your lesson now, but a vague “they are good now” doesn’t give me a warm fuzzy, given your inability in the past to tell when they could be trusted and when not.
In particular, I think the issue is basically related to “maturity” (loosely defined). So, the Bakken was closer to maturity than the Permian was (hence the revision of the Permian, with the Bakken having a similar forecast). As the App has been pipeline constrained, I don’t think the USGS methodology, relying heavily on past density of drilling, is likely to be effective.
Even for the Permian, I would maintain some wide bars of uncertainty. For one, that area has very significant geologic complexity, with different strata and the like. For another, I don’t think (correct me if I’m wrong) that we’ve had the sort of “two in a row” estimates like we had for the Bakken, yet. So, how do you know we’ve really converged yet?
And while the App, I guess, has sort of had that “two in a row” estimate, I remain skeptical given how much their methodology relies on past drilling density/fairway considerations, given how much the basin is export capacity constrained. This is especially important for the Deep Utica which has much lower drilling history, still very early in its story, to define it’s ultimate fate. This is especially so as it is a formation that has a high cost and high return (so potentially very high extra capacity to come on, given price increases).
The approach that USGS uses is essentially to say “this is the expected EUR of a well” along with “this is the expected drilling density”. This approach has a lot of uncertainty when you are dealing with new provinces. And the Deep Utica (despite all the hype and article) has very low numbers of wells, for a resource play.
IOW, even using your stated qualifications for when to trut the USGS, the Deep Utica is likely a strong example of exactly the sort of basin where the USGS estimate is “early” and may get revised up. Not saying it will of course. Who knows…maybe it is spot on, maybe it is high. But I would be hesitant of saying their methodology is gold standard, when it is so early. It’s exactly the sort of situation where you ought to have EXTRA uncertainty.
Nony,
In November of 2018 the USGS had not done any assessment of the Delaware Basin so I made a guess to fill in the missing data, I guessed very badly (about 2 times too low). For the areas that have been assessed since 2013 the estimates have proved reasonable as long as discounted by about 65% to account for economics (100% of TRR is unlikely to be produced).
And yes there is uncertainty, especially for the Utica where there is limited drilling in most of the play.
Often this indicates that those undrilled areas are not profitable to develop, this might change in the future.
I agree that USGS mean estimates could be too low or too high, but I make no assumption about which, I assume the odds are 50/50 on this.
Dennis,
Your skepticism just prompted me to do a whirlwind check on several of the oldest Marcellus producers … a dozen of the earliest Range wells in Washington county and Cabot (now Coterra) wells up in Susquehanna County.
Fascinating.
I’ll follow-up tomorrow with more data, but almost all these old boys are still throwing off +/- half million cubic feet per day. Bokoo economical when one considers that the plunger lift/compressor options – rather than, say ESPs or pumpjacks – are normally implemented to keep the gas a’flowin’.
LOEs are way lower for gas compared to oil.
Good stuff.
“high cost downhill repairs knocking out any well over 15 years old.”
I’m not even sure what you are talking about here, other than this has been a hot button for peakers to assume shale wells would get plugged very fast. Heck, I remember when people used to say 10 years!
You might make a case for 25. But 15? Heck, we have a LOT of shale drilling that was done in 2010 and it is 2025 now. Are 50% of 2010 Bakken wells plugged now? 50% of 2010 Haynesville, Barnette, or even Marcellus itself?
Heck the C.W. Slay is nearing 45 years old (vertical Barnett well that proved out slickwater): https://www.woodmac.com/news/opinion/what-a-40-year-old-shale-well-can-tell-us-about-the-future-of-lower-48/
And what the heck is the “high cost” of maintaining a dry gas well!? You don’t have artificial lift, so there’s no periodic rod changes. I’m not saying it’s zero maintenance. but just throwing that out there, Dennis, as if you are an operation manager? You don’t know. (I don’t either!) But you’re just throwing chaff on the net. You haven’t researched it. (And no, “asking Mike and Shallow” is NOT deep industry research…talk to more different people and people who don’t self select to hang out on a peak oil blog!)
Nony,
You are correct, I am not an expert, but I listen to those who are such as Mike Shellman, a man with 50 years or more of experience in the oil field running his own business profitably, MCA Petroleum, he is now retired.
https://pboilandgasmagazine.com/reading-between-the-lines/
Lots of great information at his blog https://www.oilystuff.com/
Here are some statistics pulled from Chat GPTfor this question:
what percentage of shale gas horizontal wells use artificial lift?
By Basin (Estimates):
Basin—————————-Artificial Lift Usage (%)—————-Notes
Marcellus (dry gas areas)-~40–60% eventually——Many wells flow naturally for years
Utica/Point Pleasant——–~50–70%———————-Higher liquid content leads to more lift
Haynesville———————-~30–50%——————–High pressures delay need for lift
Eagle Ford (gas window)—-~60–80%——————–Liquids drive early lift requirements
Permian (gas zones)———-~70–90%——————–High water cut leads to early lift use
Downhole repairs probably occur after 10 years on average.
Of 300 horizontal Bakken/Three Forks wells that started producing before 2006 165 of those wells were still producing in December 2023. For the 2723 Barnett wells that started flowing in 2008, 1633 of those wells were still producing in December 2021 (13 years later).
Vertical wells are much simpler to deal with than horizontal wells, often even in gas wells, liquids become a problem in the horizontal section of the well over time. The oldest horizontal Marcellus wells are from 2010 (only 11 to 12 years old as of December 2021). In December 2021 only 490 of 665 (or 74% of) Marcellus wells completed in 2010 were still producing. Could be that wells remain active for 20 years, 50 years is doubtful IMHO.
See
https://novilabs.com/blog/us-update-through-december-2021/
You’re probably right on the artificial lift, or at least “compression”. I don’t actually know how gas wells operate.
I think you are playing a little fast with the “still operating”. Only 300 out of 6000 wells were plugged. A well cannot legally stay “inactive” for more than X amount of months. so the sizeable amount of “inactive” well are periodically being cycled. I.e. still producing.
Regardless, if you look at the average (and Enno INCLUDES plugged and inactive within the average), it was still 500 MCF/d at 10 years. Very. very far from end of life. He posits 10% drop per year after that. And EOL at 100. Just doing the math, the answer then is an average EOL at 25 years. Not 15. No way at 15!
Nony,
If a well on artificial lift needs a 500k repair and produces 500 MCF/d, the repair will not pencil out as being profitable. I don’t think every well will be done in 15 years, but for my model I assume about a 20 year well life on average, some will survive longer than 20 years and some wells will be done before 20 years. Note that at 500 MCF/d at $2/MCF, that’s about $1000 per day. Many tight oil wells become unprofitable at less than 15 bo/d, which at $70/b would be $1050/d, perhaps OPEX is lower for natural gas wells than for oil wells.
A Search engine AI gave this when I asked to compare OPEX for tight oil and shale gas wells:
Average OPEX for Tight Oil and Shale Gas Wells
Overview of OPEX
Operating expenses (OPEX) are crucial for understanding the cost structure of oil and gas production. They include costs related to the day-to-day functioning of wells, such as labor, maintenance, and materials.
Comparison of OPEX
Well Type–Average OPEX ($/barrel)–Key Characteristics
Tight Oil Well–~$10-Low fixed costs; short-cycle capital expenditure; high initial decline rates.
Shale Gas Well-~$15–Higher operational costs due to more complex extraction processes.
Conclusion
Tight oil wells generally have lower OPEX compared to shale gas wells, making them more economically favorable in many scenarios.
Note also that 500 MCF/6=83 boe, but at the lower price of NG and higher OPEX, at 83 times $15=$1245 for OPEX, and the net revenue after severance taxes and royalties is only likely to be $2.5/MCF at $3.33/MCF gross, so the shale gas well at 500 MCF/d would net about $5/d, not a recipe for big profits, first down hole repair would be the end of the line.
Dennis,
While I hesitate to challenge our mighty chatbots, that response seems a bit odd.
Should you view any of the online vids of the plunger lift system – which regularly include enhancements like soap sticks – it should be readily apparent that the simple, above ground systems used to extend natgas production are vastly simpler, cheaper than that with which the earl boys need to contend. Heck, virtually all the big AB operators claim LOE of about ten cents per 1,000 cubic feet … a fraction what their oil peers pay, even in oil/gas equivalent framing.
Now, when one adds compressors to push gas downstream/’pull’ gas up out of the ground, the capital outlay can be pricey. But compressors would normally be used for several wells/multiple pads per compressor.
Long life, relatively low cost extraction has been a hallmark of the gassers for over a century now.
Edit: I just checked in with Chat GPT and it pretty much verified everything I just posted , so … ???
Dennis.
I counted 118 of 540 wells in Parshall Field either shut in or recorded zero barrels of oil production for May, 2025.
Parshall was a very prolific field, those wells are largely 12-19 years old I think.
1. You can only keep a well idle for 12 months (in general, rules vary). Afterwards it has to be plugged. So they cycle the weaker wells. Big deal. So…they’re not end of life. They are just idle that month, temporarily. They’ll bring em on in the summer after mud season, after snow season. And get a nice jump from the pressure buildup for the first month….and then back to lower levels…and (maybe) idle again in the next winter. That’s not end of life. That’s a producing well. And if I look at yearly production, I don’t even care if that comes from a well that was online 6 months or 12 or 1 or 0. I just look at what it produced.
2 Note that Enno’s method of looking at average production INCLUDES idle and even plugged wells. His average for 2010 wells is not the average for producing wells, but for all of them. And his average 2010 Marcellus well (and the average includes both those above and below the average, includes plugged and temp idle wells) was doing 500 MCF/d in 2020. He posits (shows a rationale for it) a 10% yearly drop after the ten year mark. (It is more extreme before, but may be a little harsh to assume will not moderate further, but whatever). And that rate of drop means the average well hits his EOL threshold at year 25. It’s just MATH. 500*(0.9^15)=100. And 15+10=25.
The SI or zero production wells could also be waiting on a workover rig.
I assume most Bakken wells will be produced for decades. But they won’t make much $$ at current oil and natural gas prices.
Yeah, we need a stripper well operator with money to burn to deal with the Bakken legacy. Know anyone like that? Who likes antelope hunting? 😉
Actually this is already going on. It’s not as sexy as growth, but it does give some low decline “baseload”. And jobs for the crews. Kind of less boom and bust than the 2012 man camp era.
But those wells are NOT 15 year end of life assets. You can see this clearly. It’s been long enough. Heck, Elm Coulee is 20 years old now! We’d know if wells were plugged.
Shallow Sand,
What would be your guess for the average cost of a pump replacement for a horizontal well with a 10k lateral? Do you think such a repair would make economic sense at current oil , NGL, and natural gas prices for a well with average production of 15 bopd or less? My guess would be no, but I know far less than you.
Of course if a hypothetical individual well requires a repair that is more costly than the future value of production, it will be plugged. This can happen even right after you drilled the well!
But we are interested in the population. And the number of plugged wells, is tiny at 10 or even at 15 years (for plays old enough to check). The one exception might be the Eagle Ford. That thing goes down faster than Jerry Jones. But if the Bakken is hanging in past 15 years, I have to believe the Marcellus (dry gas, simpler) will do fine as well.
The average 2010 Marcellus well was doing 500 MCF/d in 2020, and would not hit Enno’s 100 EOL thumb rule for another 15 years. (Even using a little conservative assumptions…(a) future generations are better than 500 at the 10 year mark, (b) the 10% figure is not completely well established with only a couple years of convergence at 10%, might drop to lower decline, after all it definitely dropped from higher than 10% to 10%, and (c) some people think the 100 thumb rule is too harsh and would use 50, within a model. But anyhow, even using his methods…you still get 25 years average life, NOT 15. And note his average well INCLUDES the poor performers, includes the already plugged wells!
15 year end of life for the average Marcellus well is CRAZY PILLS! It’s 2025. We can freaking check! This isn’t 2011 with Art Berman and David Hughes shooting negative bullets from the hip. Do you SERIOUSLY think 50% of 2010-POPed Marcellus wells are now plugged?
Dennis,
That observation “… only 490 of 665 Marcellus wells completed in 2010 are still producing” might be key to understanding just what the heck is actually going on here.
I just completed viewing over 200 well profiles mostly in Washington and Susquehanna counties with the emphasis on Plugged and Abandoned wells along with pre 2012 TIL (Turned In Line) wells.
Of the 60 P&A Washington county wells, 13 had NO production at all.
Of the remaining 47 wells that had SOME production, every single one was a virtual dry hole.
That is to say they had cums in the tens/hundreds of thousands of cubic feet.
Total dogs. (Semi disclaimer … I only checked the production history of about half those 47 wells).
The ‘story’ was mostly – not completely – the same in Susquehannah with 101 P&A wells … 69 showed zero production 32 had some production history.
Although most of the Susquehannah wells were also dogs, some had cums of 6.3, 5.3, and 4.8 Bcf.
One of these was last flowing 683,000 cubic feet per day before being shut in (it was simultaneously plugged with another well on the same pad that was 2010 vintage with a cum of six thousand cubic feet. No typo.)
The only common characteristic ‘event’ that I could identify with the plugging of most of these seemingly successful wells is that they had sudden, dramatic drop-offs in daily output … as in going from ~1 MMcfd down to 30,000.
As for the still-producing ‘old wells’ (pre 2012) they mostly keep chugging along at about 300 to 500 thou cfpd as we have said. Production profiles flatter’n Olive Oyle’s chest. Some of the active, high cum wells are producing near zilch for many months (years, even). Dunno why.
One old 3 well cohort – same pad – was offline for most of 2024. They were each flowing 2 to 5 hundred thousand per day. Coming back online in 2025, they are each now producing about 2 MMcfd. I suspect effective workovers will cause this type of profile to become common extending out the next several decades for most of these App Basin wells.
So … circling back to your earlier comment. A great many of the 2010 wells which you cited were certainly NOT in the sweet spots of NEPA/SWPA as the Land Grab was in full swing and ‘wildcatting’ was taking place all over the Commonwealth. This would naturally lead to a far higher incidence of dry holes than what I uncovered in Washington and Susquehanna. Should anyone pore over those 665 wells’ production histories (certainty not me), it should become apparent that many were non producers right from the gate. To even consider them in the statistical pool of the bonafide producers would be a despoilation of honest analysis, skewing any possibility of obtaining a realistic perspective of just what has been unfolding here.
Bottom line, Dennis, is that these Marcellus wells are far more prodigious and will be far more long lasting than you presently assume.
Coffeeguyzz a real analysis looks at all of the wells that have been drilled, that’s the way statistical analysis works, anything else is not an honest analysis.
Rig Report for the Week Ending August 1
The rig count drop that started in early April when 450 rigs were operating continues and drops to another recent low.
– US Hz oil rigs dropped by 13 to 362, down 88 since April 2024 when it reached 450 or down 20%.
– New Mexico rigs added 2 to 83 while Texas dropped 14 rigs to 185. Texas Permian dropped 13 to 151. The drop in Texas was a large number of small drops/rises of 1 and 2. See attached list.
– In Texas Midland added 6 to 24 while Martin dropped 4 to 19. Ward county dropped to 3, down 3 from 6.
– In New Mexico Eddy dropped 3 to 36 while Lea added 4 to 46.
– Eagle Ford dropped 1 to 29.
– NG Hz rigs added 1 to 108.
Where have all the shale rigs gone?
https://www.youtube.com/watch?v=bI3QVsW30j0
Texas Rig Count
Frac Spread Report for the Week Ending August 1
The frac spread count dropped by 1 to 167. It is also down 76 spreads from one year ago and down by 44 spreads since March 28 or 20%.
15 years end of life for Marcellus shale wells?!
I am not a reservoir engineer. Or anything, actually…just a forum reader/commenter. But consider this source (NoviLabs/Shaleprofile/Enno):
https://novilabs.com/blog/pennsylvania-update-through-march-2023/
[Look at the sixth chart down, titled Terminal decline rate.]
As you can see, the 2010-2012 wells are at about 500 MCF/d at 10 years of life. He posits a 10% decline after that, based on his analysis. And end of life at 100 MCF/d.
I just did an Excel spreadsheet and measured how long that takes (just dragging 90% each year down a column). And it sure is NOT 15 years life. It is 25 years of life.
If you consider 50 MCF/d as end of life (I donno, but have seen people use this as a thumbrule), it’s 32 years of life.
And note, the years after 2012 look BETTER (higher) than 2012. Curves are higher at the 10 year point. Implies that they will take even longer to hit end of life (whether using the 100 or 50 thumb rule).
Also, Enno’s “10%” is based on pretty limited data. See the next chart down from chart six (chart seven). He sees things converging to 10%, but really only has data out to the 12 year mark. Look at years 9 to 12 on that chart. None of the generations is much above 10 and some have significant wiggles below 10. It’s also not inconceivable that more data would show some remaining hyperbolic nature…not just a strict 10% expenential from year 10 on. This would also convey a longer end of life.
But even with the higher thumb rule (100, not 50) AND a strict 10% drop from year 10 on AND ignoring the improved performance of later wells (at year ten), we STILL get 25 year of life.
So…I would go for 25 year as your most pessimistic figure. And honestly…my Bayesian bet would be higher, since that is worst case.
Nony/Dennis,
I’ve spent the last couple of hours scanning the complete production histories of ~100 Marcellus (and some Geneseo) wells that came online between 2009 and 2012.
Absolutely fascinating stuff that I will extrapolate upon in a future post. (I want to scan another 100/200 more to get a more comprehensive picture of what is/has been going on. Marcellusgas.org contains a wealth of readily accessible info on these matters).
In a nutshell, Nony nailed it by referring to Enno’s charts showing ~500,000 cubic feet per day average output for these old wells.
Several wells producing <50,000/day are still online as adjacent (same pad) wells are producing 70,000/100,000 enabling – apparently – profitable ongoing operations as gross revenue is in the $6,000 to $10,000 range (or more) per pad per month.
In quintessential free market fashion, smaller entities (Greylock Production, Penn Production Group, et al) are buying up these older/poor producers and maximizing production efficiencies.
My buddy chatbot sez only about 50 to 100 Marcellus horizontals have been plugged to date. Seems to coincide with my brief research.
BUT – importantly, to me, anyway – the only producing horizontals that have been P&A'd that I have seen were complete failures from the outset … essentially dry holes. This seems logical as the early drillers were largely still wildcatting in regards to optimal landing zones, staying in zone throughout lateral length, etc.
There are at least two decade-old wells on the same pad with – get this – cums of ~200,000 cubic feet and ~500,000 and still on active status.
Diversified – biggest AB plugger by far (40% of total plugged wells in the AB) claims a cost of under $25,000 per well to P&A a horizontal Marcellus well.
What I have seen on a granular production analysis – if my assumptions are correct – is that the well interventions to boost productivity are fairly brief and seem to frequently greatly increase output.
Yeah, Dennis, I would not claim a very long well lifespan is possible based upon my minimal research, BUT, if my interpretation of Patzek's estimate of ~13 year lifespan of SWPA wells is accurate, then I can say that his projection is easily proven to be a preposterous assumption.
Did Patzek claim a 13 year well life in SWPA, Dennis? (I am not going to wade through/pore over that paper again).
More info to follow in near future …
“about 500 MCF/d at 10 years of life. He posits a 10% decline after that, based on his analysis. And end of life at 100 MCF/d.
I just did an Excel spreadsheet and measured how long that takes (just dragging 90% each year down a column). And it sure is NOT 15 years life. It is 25 years of life. “
On my calculator, it’s 15 years.
That’s 15 PLUS the original 10. Capisce?
At year 10, you’re DOWN to 500 MCF/d. You don’t get down to 100 with (0.9)^5 (which is about 60%). You get down to 100 by multiplying (0.9)^15 (which is about 20%).
10+15=25.
“about 500 MCF/d at 10 years of life. He posits a 10% decline after that, based on his analysis. And end of life at 100 MCF/d.
I just did an Excel spreadsheet and measured how long that takes (just dragging 90% each year down a column). And it sure is NOT 15 years life. It is 25 years of life.
Well declines to 500 MCF/d. “He posits a 10% decline after that”
“End of life at 100 MCF/d.
500 mcf/d, declining at 10% per year, reaches 100 mcf/d in 15 years.
Your 25 year figure isn’t measuring the same thing.
See figure 6 and 7 at:
https://novilabs.com/blog/pennsylvania-update-through-march-2023/
For the red (2010 generation) wells, they took 10 years to GET TO 500 MCF/d. This is actually already their history. This happened at steeper decline rates, hyperbolic decline, and came from a starting point of ~3000 MCF (end of year 1).
The projection to reach 100 (from 500, at 10% per year compounded decline) is 15 years ADDITIONAL. 0.9^15 = 20%
10 (history) plus 15 (during the 10% compounded decline) is 25.
10 plus 15 = 25.
You don’t get to ignore the 10 years that it takes to get to the start of the exponential decline regime.
10 plus 15 = 25.
Nony,
Enno chose 100 MCF/d as an end point because it is about 15 boe/d, OPEX for shale gas is about $20/boe or about $3.33/MCF, royalties and severance taxes are about 25% of gross revenue. So net revenue after royalties and taxes would be 75% of the price, lets call it $4/MCF (this would require $5/MCF at city gate) so net would be $3/MCF, not even enough to cover OPEX, you would lose 33 cents for every MCF produced.
For my model I use a hyperbolic well profile fit to Novi labs data for Pennsylvannia Marcellus wells completed in 2020 (this will be better than the basin wide average as Ohio and WV wells are not as good as the PA wells) up to month 138 when decline rate reaches 10% per year and after that I assume terminal decline at 10% per year. I assume the end of life is at 20 years when output is 332 MCF/d. Note that this is optimistic as the well would need a HH price of $5.33/MCF to to barely break even. Also note that OPEX per barrel tends to rise as output falls as there are fixed costs for storage, gathering lines and other overhead that the lower output well needs to bear.
I use both the Patzek and USGS analyses in my efforts most of which have focused on tight oil, the Patzek analyses are fairly new.
For a long time (2015 to 2020) I expected oil prices would rise to $100/b in 2015$ or more and my expectations for tight oil output were relatively high, based on what I currently see I don’t think we will see high oil prices (more than $75/b in 2025$) in the near future. I think it more likely that a lack of demand for oil will keep oil prices under $75/bo (annual average price) over the long term (up to 2040). The USGS methodology is laid out in several papers covering continuous oil and natural gas and the results have been pretty reasonable in my view since their Bakken Assessment in 2013. The methodology was laid out in 2011 at link below
https://pubs.usgs.gov/of/2011/1167/
Also Note that one of the oldest shale gas plays is the Barnett in Texas, in 2015 the USGS estimate for TRR was about 93 TCF (includes cumulative production, and proved reserves at the end of 2014 with mean undiscovered TRR). At the end of 2023 cumulative production plus proved reserves was about 30 TCF for Barnett with peak in 2012 at cumulative output of 12 TCF and average annual decline rate of 7.4% for the past 10 years. If that annual decline rate should continue up to 2100 Barnett cumulative production would only be 25.4 TCF. So the USGS may have overestimated quite a bit, my typical ERR estimate for many tight oil plays (Eagle Ford, Bakken, Permian) where there is a USGS assessment is around 65% or the mean USGS TRR estimate. So for the Barnett I would have guessed 93 times 0.65=60.5 TCF which looks to be about 2 times too high. So in this instance it looks like the USGS tends to overestimate the resource. Note also that the USGS F95 estimate in 2015 was a TRR of 80 TCF suggesting an ERR of 52 TCF, which is still significantly more than proved reserves plus cumulative production at the end of 2023 (30 TCF). It seems very unlikely that the Barnett play will even reach 40 TCF (assumes proved plus probable plus reserve growth is 2.6 times proved reserves (5.9 TCF) at the end of 2023).
Bottom line, if the USGS estimates for tight oil and shale gas since 2013 are incorrect, it looks like they may be on the high side as many oil professionals and geologists and geophysicists have suggested.
Dennis,
A coupla tree tings (h/t to Sopranos) …
Pennsylvania has no severance tax on Marcellus wells.
Royalty rates are routinely 12.5% with long running contention surrounding the value being placed upon wellhead price or the post transportation/processing price that the operator receives.
The ‘shale’ companies generally categorize opex as inclusive of drilling/completion activities.
The specific activities of maintaining ongoing production is considered LOE … Lease Operating Expense.
Virtually all the big AB operators list their LOE as about 10 cents per 1,000 cubic feet produced.
This is a rigorously applied financial parameter that is published every quarter.
As you are generally unfamiliar with the Gas World, this could be an opportunity to familiarize yourself – even superficially – with the main mechanisms employed to extend natgas production from mature wells.
Very different from oil. No ESPs, no pumpjacks, virtually no downhole equipment whatsoever.
The near-primitive plunger lift system is practically ubiquitous and undoubtedly provides the bulk of the ‘assisted lift’ systems to which you have referred. Easily accessible on the surface, minimal moving parts, highly effective – especially when employing soap sticks – and relatively inexpensive.
When lowering well pressure necessitates the need for on-site compression to ‘push’ the gas along the gathering lines, this compression creates a more negative pressure differential at the wellhead which assists in the formation gas to be ‘drawn up’ into the wellhead.
While water loading is always the big obstacle, condensate-rich gas produces more oil-like circumstances vis a vis recovery, but the high viscosity (generally) somewhat minimizes the overall cost/difficulty in hydrocarbon recovery.
This added expense is customarily offset by the higher prices obtained from NGLs/condensate/oil and plays a large, ongoing role in where/when operators choose to target their wet or dry(er) drilling operations.
1. I haven’t seen where Enno gave that explanation for his 100 choice, especially the detailed financial justification. I’m not even saying it is right/wrong. I just want to know if he really gave this analysis or if it is you talking in his place. Can you link to where he gave this rundown?
2. “OPEX for shale gas is about $20/boe or about $3.33/MCF”
WHAT!? Whiskey Tango Football?
You know an MCF is ~ an MMBTU. You are saying opex (not including capex or royalties), but just per-MMBTU (MCF)* variable OPEX is higher than the average Henry Hub price for the last several years!
EDIT1: *Are you including sunk cost again? Are you including non-variable Opex (like yearly inspections and the like?) And yes, non-variable (per well, per year) costs are certainly something the well bears and affect the EOL decision. But I certainly wouldn’t cite them as part of “per BOE” or “per MCF” costs…because it becomes a tautology. E.g. the per BOE cost goes to infinity as the production rate goes down. This is what you are trying to solve for, the production rate at which yearly costs are higher than yearly revenues.
EDIT2: Actually to be charitable to you, perhaps you are saying that 100 MCF/d, the cost per MCF becomes 3.30, after you’ve solved the algebra equation. If so, like to see the math, factbase behind that. And also…if really true, that would imply the EOL ought to be higher than 100 (150?) But again, I can’t just take it as on high from Dennis.
I’m also perplexed by why Enno (more likely you) would bring BOE into an estimate of dry gas well operating costs, What makes you think that operating costs are a function of energy content? For one thing natural gas is a gas! It would never occur to me to look at BOE for a dry gas well opex!
Are you ChatGPTing? Extending oil well cost estimates to gas wells? Which seems strange, dubious. And I’m far from an expert myself…just saying to think about what you read (or get from Mike) and toss it around for reasonableness.
“Bottom line, if the USGS estimates for tight oil and shale gas since 2013 are incorrect, it looks like they may be on the high side as many oil professionals and geologists and geophysicists have suggested.”
The “many oil professionals” is the same tiny self selected group of Mike and Shallow that is all you’ve had for years. It’s not like you’re networking in Houston.
And the oil professionals and geologists also tend to be people like Patzek and Hughes and Berman…who have a pretty butt-long history of being peakers and of getting their asses kicked by shale.
It’s not like you are talking to Ted Cross or Rusty Braziel. At least be Dunning Kruger enough to know what you don’t know. You are a guy on the Internet. You are not plugged into the industry.
Nony,
Your assumption that shale gas wells do not use artificial lift is not a good one, at least half the wells do. Vertical wells are very simple to lift, horizontal wells are not. Also you very quickly run up against OPEC higher than revenue once wellhead price falls below $2/MCF and low flow wells tend to have higher OPEX per unit of production due to fixed overhead costs. Historically their have only been brief periods of high wellhead gas prices in the Marcellus see
https://www.marcellusgas.org/pricing/
Dennis,
I am SO glad that you are accessing that Marcellus gas site.
With your brainiac math wizardry and the TONS of info on that site, we may all benefit should you indulge in some future analyzing with honest, ACCURATE information.
Kudos.
One tip … I regularly choose the ‘Record Setting Wells’ option on the left, choose ‘Top Wells – Production By Day’ option on the ensuing screen, (county specific), then the more recently producing wells pop up. This gives a very contemporanious snapshot of what’s going on. For instance, Seneca currently has 4 Tioga county Utica wells (Taft pad) flowing 29 MMcfd for 5 months ON RESTRICTED CHOKE!!! Implications are genormous.
Anywhoo, you might want to exercise some caution as you delve into the world of natgas financials.
Those rock bottom historical ATW prices are NOT what the operators receive overall (although they benefit from low ATW pricing as their 12.5% royalties are based on that).
Keeping it brief …the more accurate metric is the so called ‘basis differential’ the operator receives. Every quarter, the suits tout (or try to) how effective they have been in trying to keep their overall sales price at – or near – Henry Hub pricing which is simply the number against which all other pricings are compared. Chicago, New York, Boston natgas buyers pay more or less than HH depending on seasonal factors/availability. The operators that can access those markets through long term, firm pipeline contracts can generally benefit from these arrangements.
Long story short, every quarter the ‘shale’ suits state what they received in pricing in terms of how much below (in Antero’s case, I believe it has been above) the average HH price (aka the basis).
Although I seldom now follow, I believe 30 to 50 cents below HH is what AB operators have been getting overall for their output.
Very variable and this is an over simplified description.
1. The history of early (low drilling history) USGS estimates is that they were to be low/conservative. So “50/50” for an early (low data, low operator proving out of the area and of optimal completion strategy for a given play) estimate is not a good prior.
2. I would respect your evaluation of “USGS is pretty good” more if you had some history of knowing when they were bad. E.g. before the upwards revisions, did you express concern that they would be revised up? When the Bakken was “4” (later doubled), did you call it out at that time? Express concern? IOW, if you didn’t call them out when they were bad, how can I trust your evaluation now that you say they are good?
3. Do you even read and think about their different estimates? IOW, do you evaluate what is the primary input into your own estimates (which are basically warmed over USGS with a haircut and some timelines) to express an opinion on THAT PARTICULAR USGS estimate you are using?
The USGS estimates are not all the same. If you parse them you can see things like
*(a) how old is their dataset (there is always a significant lag, but it varies, and needs to be compared to evolution within the play as this ALSO varies–look at the relatively recent “propageddon” of the Haynesville for example)
*(b) how granular is their areal analysis (both cornies AND peakers have criticized their very large area divisions….but even so, study to study may differ).
*How well do they describe their own methodology? It varies how much they share.
*How much do they discuss and compare to estimates by other researchers. (Usually very little, not thoughtful. In contrast an article by Patzek or Boswell or UT group will have MUCH more thoughtful discussion of the literature and contrasting estimates.)
*How well do they look at “associated strata” that have some level of communication with main strata (shown by the need to winerack), but also have additional resource? E.g. the Three Forks with the Middle Bakken. The Point Pleasant with the Utica. Etc.
Reading this dialogue I get the impression that certain among us aren’t factoring in the difference in physics between associated gas in a shale oil basin and dry gas in a shale gas basin. In the Permian, for example, there’s a massive amount of natural gas contained (along with oil) within the pores of the shale matrix. When those pores are fractured, gas that is dissolved in an immiscible solution of water and oil drives the liquids into the well bore, and as the pressure falls, eventually a bubble of gas will come out of solution and this dreaded bubble point defines the beginning of the end for the shale oil well–it gets gassy and then even the gas falters. Associated gas is mostly methane, the lightest of them all, but always contains a variable mix of heavier gases such as ethane and propane, which form condensates (NGL’s) on their way up to the casinghead. Even though we refer to it as light tight oil, shale oil contains a modicum of long-chain hydrocarbons, as well as aromatic rings, in variable proportions. One reason oil production falters quickly is that these viscous, more complicated hydrocarbons plug up the mouth of fissures in the shale. The other reason, of course, is the pressure drop.
Much of the Marcellus shale is dry gas: nearly pure, non-viscous methane. The fissures that were formed by fracking don’t get plugged, bc there are no heavy, long chain hydrocarbons in the pores of the shale matrix. This shale is deeper and more thermally mature, so even if it qualifies as wet gas, the wet is mostly just the heavier gases, with a smidgen of oil. This dry gas doesn’t obey solution-gas bubble point physics, but single-stage physics. It comes out of the pores of the fractured matrix under great pressure, then less, but those pores don’t clog from heavy molecules, and as long as there is a pressure differential the methane is going to keep rising. This is a vastly different process than associated gas.
The gas contained in the Marcellus Shale Basin is estimated to be four times the amount of associated gas in the Permian. But the big difference is that in most instances it’s a single-phase system comprised of super-light hydrocarbons that don’t clog up the drain. Decline rate curves will draw themselves accordingly, and any attempt to model them on associated gas depletion is meaningless.
Gerry,
Shale production is quite different from conventional, and shale oil is even more complicated than shale gas, but I agree that bubble point is still the golden rule that govern both shale and conventional oil.
So far, the only physics driven model with close to real production in Marcellus I see is from Engelder’s second prediction based on his non-conventional physics model and limited production data,i.e. 493TCF from Marcellus, which actually is 10x as large as his 1st 50TCF prediction.
The Marcellus was a mystery to Engelder and just about everyone else. We in the southwest tend to think of deeper zones under greater pressure and temperature being the only environments capable of cracking hydrocarbons into their lightest forms, the end result being pure methane–dry gas with no oil and very few heavier gases. That’s not always the case with the Marcellus, where some of the best dry gas zones are actually fairly shallow. This is complicated geology. For that degree of thermal maturity to have taken place implies that these shallower dry gas zones were at one time much deeper and erosion has been extensive, thereby “moving them up” in terms of geologic burial. While they are going 20,000 feet down in the Texas portion of the Bossier/Haynesville, at extreme pressure and temperature, comparable or better yields of dry gas are being acquired under less angry circumstances in the Marcellus. This is a very dramatic shale gas basin with quite a few paradoxes. One of them is finding such abundant dry gas at shallower depths (<9,000 feet). Erosion won't explain it all, bc in some instances there is wet gas in shale benches deeper down. Very strange.
How deep is the Hugoton in Kansas and how much gas has been produced?
The Hugoton gas field, primarily located in southwestern Kansas, produces gas from Permian-age carbonate and shale formations at depths ranging from 2,740 to 1,520 meters (9,000 to 5,000 feet). Since its discovery, it has produced over 29 trillion cubic feet of gas. Thanks AI
MAILDOG,
Your AI probably is close, the Hugoton field in Pan-Handle is probably even shallower. It is primarily a dry gas field with little liquid. But isotope reading shows it has quite some liquid when generated from the Anadarko basin’s >20Kft deep Woodford formations, at GOR 2~3:1 BOE, but so far the total Anadarko basin GOR is quite high, i.e. ~5:1 combining nearby fields, so there should be some more oil to be found.
Maildog: “How deep is the Hugoton in Kansas and how much gas has been produced?”
Your point on the shallow Hugoton is a good one. No source rock for the formation of NG has ever been found under any part of the Hugoton Field except in the far southern tip which communicates with the deep (20,000 feet), hotter-than-Hades, over-pressured Anadarko Basin. There (in Western Oklahoma and Wheeler County Texas) lies the proper source rock (Pennsylvanian) and thermogenic conditions for the manufacture of NG. Until the Marcellus came along as the next great thing I had never heard of prodigious quantities of NG coming from a shallow field without it being connected to a very deep kitchen with ovens so hot they could crack hydrocarbons down to their lightest, simplest form: pure methane gas. As an aside, it is important to note that almost the only place in America where NG contains economic amounts of helium is in the Hugoton embayment. Helium forms from radioactive decay very deep (20,000′) in the ground, so this is corroborative evidence that the NG so abundant in the Hugoton originated from the deep earth of the Anadarko Basin and migrated updip, northward through porous carbonate until it was roped in by a stratigraphic trap.
Gerry,
Obviously Marcellus remains a mystery still.
I might have a model for your very strange observation above, i.e. ” One of them is finding such abundant dry gas at shallower depths (<9,000 feet). Erosion won't explain it all, bc in some instances there is wet gas in shale benches deeper down".
— there could be PVT phase separation that separation the originally wet gas/condensate into dry gas pocket and liquid rich pocket?
This PVT phase separation model works for the Utica in OH, but this model seems to fail in the adjacent WV region Marcellus, where the TVD depth for Marcellus is even shallower at <7kft or less, and the GOR/CGR is just impossible to stay stable even with 2time normal static water pressure gradient, and yet the Marcellus lateral is able to produce so significant amount of liquid and gas that they might darwf some condensate wells in Eddy county, NM at TVD close to 9Kft or in Dewitt County EF at TVD over 13Kft.
I logged wells in both shallow part of WV and NEPA and deeper PA Marcellus/Utica, and the isotope-maturity seems to confirm the GOR-maturity change, but just the PVT part failed in WV Marcellus.
Here is a 2018 slide deck from USGS.
https://pubs.usgs.gov/of/2018/1135/ofr20181135.pdf
See slide 16. They have the Haynesville/Bossier as twice as big as the Marcellus/Utica.
Maybe that changes with more recent work, but still…huh? Did anyone (Patzek included) see the H as twice as big as the mighty Marcellus, in 2018 ? My very naive prior would be to guess the opposite.
Note this isn’t even to say if the H is too big or the M is too small. Just to say WTF in terms of internal consistency.
I mean heck, the App has worse pricing and yet is producing about twice as much as the H. Why? Especially given USGS seems to think there’s twice a much resource in the H as the M. Makes zero sense!
You can’t just take USGS as gospel. And then mechanically feed it into the Coyne hopper, where it gets a haircut and a timeline. You have to look at your inputs critically. Not just mechanically make line charts.
Heck, I’d probably feel better about you using Patzek as a source (despite his peaker tendencies). At least it would be recent! And he does finer area (and generation) division of the Drilling Info data. And I say this without even knowing if Patzek gives a bigger number.
No, that’s from 2016
The file was published in 2018. The title slide say 2016 (really referring to the title of one particular report from 2016). Some data within is clearly from 2017. And we have no way of knowing when some slides (it is a PPT) were themselves created. But that agency published it in 2018.
Regardless of 16, 17, or 18: you see a picture of the USGS having a bizarre comparison of the App versus the H, at the time of that report. (Well past the magic 2013 threshold.) This is why you really have to look at the reports one by one. They differ in quality and in recency and possibly even how conservative they are.
Like anything, really, you should read the reports each individually. Not just assume that having the USGS icon on it makes it words from God. It’s just one more person or committee or the like doing an estimate.
And again, I actually value Patzek or Boswell or UT BEG more, because their reports are much more detailed and describe the methodology better. And that’s regardless of if it is a too small App estimate or a too big H estimate!
Nony,
The USGS report has title “2016”, actually released 2018. But, it has latest data till 2017 from the references.
It is quite updated than the tilte says. Since in 2016, the poor production curve data in Haynesville is already out, and Haynesville had a several down-turn with sharp declines of well profile and total production numbers since 2012/2013, and improvements in 2015 and 2016 are not obvious yet.
Maybe the authors are encouraged by the progress made in 2015~2017, and again put an optimistic number here.
The Marcellus dwarfs the Haynesville, though the latter is in close proximity to LNG trains with ready pipeline access–thus the elite pricing. The prodigious production by the Marcellus wells in the dry gas window, and the pricing, are the reasons they’re building a massive data center complex, complete with on-site electricity manufacture, in the heart of the Marcellus. There’s excess, inexpensive natural gas in the Permian too, but that will eventually get handled by pipeline systems. And besides, the durability of dry gas in the Marcellus is apt to be much longer than the associated gas in the Permian. In a way it’s a good thing for America that the Marcellus is so isolated away from LNG trains: much more is going to be consumed right on production site, by the AI folks. Good or bad, this is some kind of weird reiteration of the Industrial Revolution, on steroids as far as electricity demands.
1. So, I just relooked up the USGS Utica estimate. Turns out that in 2019, they revised up their 2012 estimate. From 38 (2012) to 117 (2019).
https://pubs.usgs.gov/fs/2019/3044/fs20193044.pdf
Now, let’s think about this. On the one hand, this fits well with Dennis’s “pretty good after 2013” criteria. Well…actually we don’t know that the 2019 is “good”. But we do know, based on the 2019, that the 2012 was bad. At least based on a more recent study with more data/experience.
But here’s the kicker. Until that 2019 study came out, the 2012 was the current study. I.e. in 2018, that 2012 study WAS THE CURRENT ESTIMATE. So anyone using Dennis’s method up until 2019 (imagine me with a side by side booth for the Utica at the 2018 AGU meeting), would have used a dramatically wrong estimate. Anyone writing (or more importantly reading) a Wikipedia article, which treated the USGS as gold standard, would have a massively underestimated view of the Utica play.
So…it certainly is fair to say that USGS has a tendency to underestimate. Will they underestimate forever? No. But has it been a consistent thing during the shale revolution? Yes…and called out as such by the industry…they just lag very far behind. You could have 5-10 year old study as the “current” study and it’s based on wells from a few years earlier before they got their DI data dump and with enough time, at least a year, maybe two to do DCA. So you’re probably looking at a 3-4 year old picture, even at USGS publishing time.
You can see how USGS themselves were using that 2012 study (on that PPT slide I linked) to compare plays to plays. I actually know this danger from USGS and am very sensitive to comparing two plays when one has a more recent or less recent study (especially for plays in evolution, early in life, etc.) But right now the current study of the Utica is the 2019 study. If we get a new study in 2030 and it is very different, we’ll have had 11 years of using the wrong one.
2. And I’m not saying future studies will differ, we might see the same result…this has happened. However, unlike the Bakken or Marcellus, where we’ve sort of had these “two in a row, similar” studies, we have NOT yet had that for the Utica. So we really can’t say it’s converged yet. And even then, the drilling of the Deep Utica is so very sparse that we really don’t know yet. I wouldn’t even argue/ask for a new USGS study of the Utica. We don’t have enough drilling yet!
3. Even with the more recent studies, it is strange that USGS has “the App” as equivalent in size to the H. And has the M (leaving out the U) as less than half the size of the H. Just seems bizarre then that the M is producing twice as much as the H, despite a later start, worse prices and (per USGS) less resource! I’m just a dumb Republican who doesn’t listen to NPR. But…I don’t see how anyone (cornie or peaker) would intuitively think of the H as twice the size of the M. Just seems bizarre. I suspect there’s some difference in the methodology that explains the difference. There are “knobs” to turn (success rate, areal extent, drilling density) that can drive reasonably different estimates. So Mary could be too optimistic of the H and Joe too pessimistic of the M. But…it just intuitively feels wrong to say TRR for the H is bigger than the M. It should be opposite!
4. P.s. Look how miserable the areal differentiation is on the 2019 Utica study. They have two massive areas. A gas area and a condensate area. And that’s it! We are talking a gas area the size of the state of PA! I find myself having to bring up Art Berman (we are on same side here) and the very clear point that shale plays are highly INhomogeneous, despite being resource plays. You have sweet spots, fairways, fringes, goat pasture, etc. And I don’t even know if the method of just smearing the sweet spots into the fringe is overestimating TRR or underestimating it. But…it clearly shows we have very low knowledge of the play. Heck, even if it really IS the one play that is so homogeneous, they should have divided it more and then run their analysis and then talked about how homogenous it was. but as is? Blech…it’s like Australia in 1800. Lot of unknowns…
Nony,
I agree not a ton of data for Utica so the estimate might be too high or too low, note that by your reasoning of less gas production in Haynesville so it must be smaller than Marcellus, the Utica might be smaller as well.
There is an old quip by Paul Samuelson that he adjusts his thinking based on the facts at hand, the USGS does the same, in 2012 the USGS did not have much data and used analogs to estimate the Utica due to lack of production data. In 2019 they had some data (though far less than Marcellus) and estimated using the data available.
Also notice the very large F95 to F5 interval for undiscovered resources for Utica in 2019 with a range of 21 to 281 TCF with the mean at 117 TCF.
For mean TRR for Utica the USGS estimate is 149 TCF, Patzek has about 157 for Utica in core areas in 2025 paper. So if the Patzek estimate is correct, the USGS estimate may be a bit low. Certainly there is much uncertainty.
I agree that Patzek and USGS seem to validate each other. But there’s several other estimates that are higher. (WV BEG and Boswell). Also implicitly the EIA and PGC have higher estimates also (they combine Marcellus and Utica, but are still much larger than USGS or Patzek’s M U.
So if you just look at P and U, they validate each other. If you look at other studies, the global uncertainty is much higher.
This isn’t even to say one or the other is right. But we are talking about quality work. Not right wingers on Twitter. Not bloggers on POB or TOD.
Heck…I’ll even give Patzek credit. He may end up being wrong and the higher resource estimates correct. But Patzek did quality, detailed, work.
USGS less credict…they just download the DI data and run through a very simple algorithm…and don’t have much discussion of their methods/choices. Like even if by chance they are right, their reports are skimpy and not thoughtful. Just as written reports.
——
I also think the USGS reports can vary a lot from one to the other. And then the writeups are so skimpy and the choices on their algorithms so arbitrary that it can be hard to evaluate them. Even leaving out the Utica entirely, it is bizarre that they see the Haynesville/Bossier as a larger resource than the Marcellus. I suspect this comes down to different people doing the work. Not even a cornie/peaker bias thing, but just there are a lot of arbitrary “knobs” in the USGS process, such that the estimates can move a lot. And if you look their “input files”, those knobs have arbitrary round numbers, with no discussion of the basis for them. Along with MASSIVELY too large assessment areas. (A fault that everyone from cornies to peakers sees.)
In particular the success ratio and the downspacing assumptions. Note…even if they are GOOD assumptions, they don’t discuss how/why they make them. People writing real, thorough reports (Patzek, Boswell) do a much better job of describing the details…such that you can even assess where their weaknesses might lie. But USGS? Feels like civil servants…and then the 20 people listed as authors. and almost no thoughtful Q&A (a top line press release is not thoughtful discussion of the methodology. I’m just very “over” USGS.
Nony,
The USGS Utica assessment was released in October, 2018.
The production data was obtained from the January, 2018 report from IHS Markit.
That IHS Markit data came from state sources which are normally ~10 weeks after actual production.
Therfore, all the well data is from 2017 and prior … almost 8 years ago.
This is somewhat related to the 4 Tioga county Utica wells – from Seneca – currently flowing 29 MMcfd for 5 months on restricted choke. This county was barely a blip on the windshield 8 years ago.
As far as the USGS Utica map showing breathtaking expanse … it’s actually bigger’n that.
In 2008, Questerre brought in 2 successful Utica wells just south of Montreal, so far north it isn’t even on that USGS map.
Yeah, I know. Damned Cannucks getting all lib’rul and banning fracking though. 🙁
I do love me some drinking on Cherbourg Street and skiing at Mont Tremblant though. Oh…and they actually sell “higher fat” yogurt in Montreal. I kid you not. I bought some, 10%+. It was incredible! I was young and strong and lean then though. And Mont Tremblant was cold as a witch’s…
I don’t mind how huge the Utica is. I just mind how they don’t divide it into more different pieces. I know the data is pretty thin. But still…I wouldn’t (essentially) have one AU that was OH and one AU that was (essentially) PA+WV. Like…I’m on Art Berman’s side on this!
Nony,
You are free to do your own analysis, just because someone does a bogus study with one or two wells per county (aka cherry picking as that is not a valid statistical sample) does not make it a better study. And 50 year EUR and 6% decline based on old vertical well results, that’s just nonsense.
Ray Boswell is not an idiot. He won an award for being an outstanding earth scientist. He has a 59 h-index. He might be wrong, but he also might not be. He’s probably done a lot more work and has a lot more savvy than you did when you stood in front of your AGU poster, with your Permian estimate.
a. With respect to the 6% versus 10%, realize that Enno’s 10% is based on very little data itself. He says the harmonic decline shifts to exponential at 10 years, at 10%. But he only had a few series (three I think) where they were far enough out to be at the 10 year mark. and basically has 4 data points (two at 10 years, one at 11). And even within that, it wasn’t like they were all right on the 10%. Some scatter (as expected, for few data points). It’s a regression, but it’s a pretty small data, high degree of freedom. This isn’t to say 10% will be wrong. Just that it’s not like some robust analysis based on massive amounts of data. We are early and have little idea how those wells will change from year 10 to 20. Heck maybe they get worse! But the Enno 10% has high uncertainty.
b. I don’t get your cherry picking criticism. What you are even talking about? If there are few wells in a county, that’s all you have. Yes it drives uncertainty up, but that’s what you have. That’s not “cherry picking” (excluding data and ESPECIALLY doing so in a biased manner). That’s just a higher uncertainty situation. And for all you know such situations could lead to wrong low numbers, not just wrong high ones. (There is also some self averaging given there are many such counties.)
c. Instead of finding 100% faults (because it’s a big number study you hate it), you ought to be able to read the paper and learn some things get some ideas even if you don’t like his EURs. E.g. The TRR/section (rather than per well) is a powerful way of thinking about analyzing the production of the land. Another powerful insight is just his early charts showing how much the different previous studies in the literature vary. These aren’t really even “pro cornie” things, they are analytical insights.
all forecast/models have to use latest data to minimize obvious errors.
The problems with Saputra/P AAPG (SPA) paper on Marcellus (submitted May 2021, and preliminary ahead of print published, meaning no details published?, Nov 2022, and print published Jan 2024) are:
1. The data they use is prior 2020, and not enough to show the major improvements after 2019,
2. They grouped the wrong years together, i.e. 2017-2020 together, and the poorest 2017 with the largest dataset brought down the best 2020 with the least dataset.
3. Just discovered by COFFEEGUYZZ/NONY here in this post that their lifetime cut-off for Marcellus is so absurd, and it is not just the 13.5year for 2009 wells, they actually gave MUCH MUCH MUCH shorter for the newer wells, which actually have way better base production to start and similar decline rate as older wells, i.e. they should last longer. This is the largest error they introduced for now, limiting all EUR under 7BCF/well average for wells prior 2020, thus the 12,406 wells by 2020 only produce 84TCF EUR by end of life in 2034, which actually should be 10BCF/well and total ~120TCF and well beyond 2050 given >25 years end of life;
4. The undrilled remaining inventory core 3684 wells (by SPA paper) should have ~15BCF/well, delivering 55TCF; but somehow the SPA paper added 65TCF by 2040 which implies ~18BCF/well EUR in 13 years of time. This controversy makes me dig further, and found they categorize “3684 core” as “infills”, and this is certainly not the case for the the real infills, e.g. in the NEPA core, there is the the upper Marcellus that has barely been drilled (399 according SPA), which is only 10~20% lower EUR. The true lower Marcellus infills should deliver 25% lower EUR. The total numbers should top 5000 in NEPA, which should give another 60~80TCF, not counting the SWPA. They give only 30TCF EUR for the 7896 wells in the noncore again in 13 years end of life, or under 4BCF/well EUR, which has huge underestimate as longer lateral and larger frac make them much more produtive.
Sheng Wu,
There were not major improvements after 2019 in the Marcellus, the data you are looking at does not normalize for lateral length and shows dropping tails for wells completed after 2021. They used data from 2021 from Enverus the paper was submitted in May 2021 with revisions through July 2022, My guess is they had at least some data from 2020 wells on the chart that follows the 2020 well is the best (2018-2022 wells in chart). Also one of their cohorts is 2017-2020. Note also in the chart below how the 2021 and 2022 wells do not perform as well as the 2020 well which was probably higher due to high grading during the low activity period in 2020. In the Permian basin what we see is decreasing productivity when we normalize for lateral length. I don’t have the data to confirm this in the Marcellus.
Also consider chart linked below with 4 largest natural gas operators in PA (mostly Marcellus wells)
https://novilabs.com/wp-content/uploads/2023/05/3.-Well-productivity.png
Sheng Wu,
No the newer wells have higher decline rates, that’s why we see the 2023 wells cross below the average 2020 well after 10 months.
https://thundersaidenergy.com/downloads/marcellus-shale-well-by-well-production-database/
I am not sure if the 2023 Marcellus wells drop-off is a result of faster decline or just well-shut in in 2024 real low gas price environment.
My wild guess is that in 2023 the operators drilled the better acreage and gave larger better frac to get more gases to catch late 2022 Russian-war price hike, so the IP to IP10 are obviously setting a new high, but instead they met the low price in 2024, and had to shut-in.
Nony,
You need a big enough sample to break the data down to smaller pieces, not enough well data to break things up.
OK. 😉
This reminds me of the MBA, engineer, and mathematician who travelled to Glascow by train and saw a black sheep.
“Aha!” said the MBA, “I can see that sheep in Scotland are black.”
The engineer replied, “Well, you can see that ONE of the Scottish sheep is black.”
The mathematician looked at the two and said, “Well, actually all we know is that there is at least one sheep in Scotland, and at least one of its sides is black!”
—–
So…I actually think a more apt description of USGS shale assessments would be that pre-2014 they were “bad”. Not that they were “good” after 2013. They might be. But we still don’t know.
Nony,
There is always uncertainty, I am most familiar with the tight oil assessments of the Bakken, Eagle Ford, and Permian Basin, those estimates look fairly reasonable at about 11 Gb for North Dakota Bakken/Three Forks for mean TRR and about 15 Gb for the Eagle Ford (this looks a little high to me) and 75 Gb for the Permian. I expect the URR of North Dakota Bakken Three Forks will be about 8.5 Gb, Eagle Ford about 9 Gb and Permian about 45 Gb, if my assumption that oil prices will remain at $80/b or less in 2025 $ is correct. Higher prices or significant techincal progress that lowers costs will increase the URR to something closer to the TRR and the reverse would reduce URR (lower prices in this case). I could be wrong, but am skeptical that even $100/bo would increase URR by more than 20% above my best guess. Maybe oil prices end up being very high, I think this unlikely. On average for these three plays the ratio of ERR to TRR is about 62% for my best guess scenarios for ERR.
Yes there are some really high estimates out there, I think they are likely to be wrong.
The USGS has more data if you dig deeper into their data sets. Note also for the Bossier only 52 TCF of shale gas mean undiscovered TRR, the rest is conventional. For Haynesville the mean undiscovered TRR for shale gas is 175 TCF with 45 TCF in a peripheral area with half the EUR of the main area, so the more likely number is around 130 TCF. For Haynesville/Bossier we need to add 12.5 TCF of cumulative production and 12.8 TCF of proved reserves at the end of 2015 to the 182 of undiscovered TRR for a total of 207 TCF of Haynesville/Bossier shale gas. This compares with about 438 TCF for Marcellus and Utica/Point Pleasant shale gas mean TRR or more than 2 times Haynesville/Bossier shale gas (continuous resource) estimate.
should probably add beack 45 TCF in Haynesville/Bossier peripheral area for 252 TCF TRR mean estimate by USGS for continuous gas (aka shale gas). Using the 62% of TRR that I get for ERR in 3 tight largest oil plays this would suggest ERR of 156 TCF for Haynesville/Bossier and 272 for Marcellus/Utica.
The Patzek estimate for Haynesville/Bossier is 90 TCF, only about 36% of USGS TRR estimate for Haynesville/Bossier continuous gas. So there are cases when Patzek and USGS shale gas estimates do not agree.
Older paper from BEG (2015) for Haynesville
https://www.beg.utexas.edu/files/content/beg/research/shale/Haynesville%20Shale%20Gas%20Play.pdf
also see chart from that paper (page 6) with scenarios at different gas prices.
D C,
This 2015 BEG paper (based on other 2015 BEG/Patzek Haynesville work cited in the reference) gave remaining TRR at 177TCF?
For the production decline curve after initial 2~3 years, Patzek team (from BEG to KingSA) have been using a close draining model with exponential decline, or conventional “sandstone with no external water flooding” variant after study in Barnett, others like Engelder (Penn State, Marcellus) and Valko&Lee (A&M, study in Barnett) adopted open draining (OD) model featuring long hyperbolic decline.
This “closed draining sandstone without water flooding” (CDS) might explain has this short end of life template/section in each of the work using Patzek CDS model.
This CDS model might work for Haynesville (2015 Male&Patzek claim after 1 year it is all exponential CDS decline) and Permian shale oil, but not working for Marcellus and probably not even Bakken tight oil.
The OD model with hyperbolic decline also could have long or short hyperbolic, and Engelder seems to take the Long hyperbolic OD (LOD) instead of Short (SOD) for Marcellus.
This CDS or SOD model does not mean much to the EUR of shale oil and gas, where the EUR still dominated by initial 3~5 years production with fast declines, the difference might be 10~15% in EUR only. But with LOD’s long lifetime and slower decline, the EUR will be easily 50% or over100% higher than CDS.
Sheng Wu,
Pretty sure you have it wrong, read the Barnett and Bakken papers for a full understanding, the models have evolved over time. The 2015 model is different from the
models in 2019.
Barnett paper at link below
https://pubs.acs.org/doi/pdf/10.1021/acs.energyfuels.9b01385?download=true
Bakken paper at link below
https://www.researchgate.net/publication/336038796_Generalized_Extreme_Value_Statistics_Physical_Scaling_and_Forecasts_of_Oil_Production_in_the_Bakken_Shale/fulltext/5d8f00b7458515202b6f417c/Generalized-Extreme-Value-Statistics-Physical-Scaling-and-Forecasts-of-Oil-Production-in-the-Bakken-Shale.pdf
The results of the Patzek analyses look reasonable to me, the very high estimates are not reasonable and for shale gas the USGS Barnett and Haynesville/Bossier estimates are for too high, makes one wonder if the Marcellus/Utica estimates by the USGS are also too high. Are you of the opinion that the claims by Harold Hamm that the Bakken would produce at least 30 Gb are believable? It certainly is looking like the Patzek estimates for Barnett (oldest shale gas play) and Bakken/Three Forks in ND (oldest tight oil play) are pretty darn good. You may need to look at all the Patzek papers to get a better understanding (Barnett, Bakken, Haynesville, Permian, Marcellus, Utica, and Eagle Ford).
D C,
I am not sure the exact term (TRR, ERR but certainly not OGIP which I remember he quoted ~120GBO) that Harold Hamm quoted “30GBO”. If we use the optimistic 20% recovery for 120GBO, then that’s 24GBO recoverable that Hamm quoted in 2010/2011 according to Chatbot (20GBO+ 4GB NGL, not 30GBO that you gave here).
Based on AI search, in 2018, Continental (Jack Stark, not Harold Hamm himself) give 30~40GBO recoverable with up to 20% recovery of the 240GBO in place probably after adding the ThreeForks discovery after 2011, and quoted from “https://meridianenergygroupinc.com/continental-resources-doubles-estimate-for-bakken-oil-recovery/”.
With the current completion and production practices, and based on production till now (5GBO already produced), I would agree that ERR is over 8GBO easily and TRR should be over 12GBO according to your 62% ratio for ERR/TRR.
I checked into the 2011 Continental 20+4 GBO estimate detailed numbers (with core and non-core), and they used 500KBO per well EUR, which obviously almost twice the realistic EUR, and therefore I would discount the TRR from 24GBO to 12GB (with 2 GBO NGL). So, here we have 10 or 12 GBO TRR, which are quite close.
Patzek group 2019 paper on Bakken gave numbers close to above 8ERR and 12TRR, with several close to paper forecast facts when we observ with data today.
1. the existing wells probably can not deliver the 5GB that the 2019 paper predicted, only above 4.5 which is consistent with his low end prediction using close no “exterior” input.
2. Assuming after 2019 paper, Bakken operators still drilling in the core till 2028 and maintain 1MMBOPD, and that will probably yield more than 2.5GBO.
Besides possible long awaited EOR techniques, I still believe the Upper and Lower Bakken shale with high TOC could be developed and producing a lot more.
Actual Haynesville production Jan 2008 to June 2025, EIA data in BCF/d
The Patzek paper on the Barnett Shale predicts about 30 TCF for URR, far different from the USGS mean TRR estimate. See
https://pubs.acs.org/doi/pdf/10.1021/acs.energyfuels.9b01385?download=true
and
https://pubs.usgs.gov/fs/2015/3078/fs20153078.pdf
USGS has 53 TCF of undiscovered continuous gas resources in Barnett for mean estimate, when we add proved reserves at the end of 2014 (24 TCF) plus cumulative production to end of 2014 (16 TCF) the mean TRR for the 2015 USGS estimate is 93 TCF for Barnett Shale, let’s assume 62% of this is ERR that would bring the URR guess to 58 TCF nearly 2 times higher than the Patzek estimate in 2019.
So the USGS estimates are not very good, they are much too high, if the Patzek analysis is correct.
D C,
We all agree Utica has just too few wells drilled to justify, and therefore I would discount them with below 60% confidence, or quite wild guess.
If only using the AB production gas data as they are for Marcellus, and discount the liquid drilling OH Utica, then your 272 M+U AB ERR is actually close to 450 TCF only app TRR that I believe 500TCF is reasonable, Boswell’s 700 TCF is scarrily high.
I have “dug deeper” into USGS. I actually think you are the one who hasn’t. That’s my point. You should do so. It’s the primary driver of your own estimates. Need to dig into them.
I don’t just use expert appeal. I don’t mechanically take their output and stick it into your process.
Note that even within USGS, they differ in quality (e.g. how many geographic zones they divide a play into). This is something that you find out by “digging deeper” and by being a critical thinker. Yet, I never read thoughtful discussion of the particular USGS reports used within your estimates.
Also, look at the USGS “input” reports. Lot of arbitrary round numbers for the parameters (in particular downspacing and . And…then they don’t give any written description of why they used a particular number. They don’t say “we did a regression” and came up with this downspacing. Or looked at drilled up areas (how, where?). Or interviewed…or whatever.
1. “Yes there are some really high estimates out there, I think they are likely to be wrong.”
Ok, to have a hunch of which estimate you trust more. But you ought to also consider that you’re not an oracle either. If different thoughtful professionals come up with widely different estimates, that ought to tell you that there’s a lot of global uncertainty.
2. Don’t be so sure you are so shrewd, either, to evaluate competing estimates. Remember the Permian 2018 AGU presentation you did. That should make you think not only about inputs changing, but about your own ability to evaluate inputs. However that Permian estimate was 2X off…it was 2X off and you had to revise your prior, up, a month after you had made it. That was a huge change. And I don’t remember you even expressing doubt, concern, etc. In other words discussing where you might go wrong.
3. If you know the tight oil better that should be another reason why you are a little self-skeptical of your ability to evaluate competing estimates in Appallachia. E.g. you seem very grudging to admit that its static production is because of outbound pipe limits. (Look at the wellhead prices! That ain’t a resource running out…that’s trapped gas fighting each other for sales.)
4, I’d feel a lot better if you had some ability to find good and bad things about each methodology. It would show you reading the papers critically. It seems like you just want to find faults in the high ones and the opposite in the low ones. That is more of an advocate way of thinking versus an analyst way of thinking. A careful reading of each methodology will show things that are good or bad between them (e.g. amount of areal discrimination, timing of the data, round numbers for “input” or ones based on regressions. Just…like if you had carefully read the input on going forward drilling costs from Mike, you’d have realized he had sunk costs included in them. (So any discussion of future drilling based on it would be flawed.)
The additional 2.5 mb/d by September means global oil production will surpass 2018.
https://www.reuters.com/business/energy/opec-makes-another-large-oil-output-hike-market-share-push-2025-08-03/
Enjoy the cheap prices while they last.
Well, what OPEC announces and what they produce seem to be more and more two pairs of shoes.
An update to May US production has been posted.
https://peakoilbarrel.com/us-may-oil-production-hits-new-high-again/
A new open thread Non-Petroleum has been posted.
https://peakoilbarrel.com/open-thread-non-petroleum-august-4-2025/
Dennis,
Although you have a long standing position of disdain for the upstream boys’ investor presentations, the amount of objective, current data that frequently emerges from these events makes them an invaluable source to understand just what the heck is going on in these matters. (This, even recognizing the ‘chest thumping’ tone that is an integral part of these proceedings).
From the NFG transcript from the other day …
1. They claim 20 years’ locations left at $2.25 NYMEX pricing. Objective analysis by Enervus pegs almost 20 years’worth at $2.50 NYMEX. So much for ‘running out of drillable locations. Sheesh.
2. Their new Tioga county Utica wells are expected to run on restricted choke at 25/30 MMcfd for 9 to 12 months. Their new, so-called Gen 3 completion protocol uses 2,200 lbs proppant per foot. Gen 4 version contemplates 3,000 to 3,000 lbs per foot along with changing the distance between infill wells.
3. Their LOE of 68 cents/Mcf includes gathering and transportation (pipes) which runs about 59 cents per Mcf. Therefore, the actual lifting costs which we have been discussing are about a dime per Mcf, virtually identical to all the other large AB operators.
4. They currently project EURs of 2.5 Bcf per 1,000 feet of lateral. No comment necessary in regards to Patzek’s, USGS’, and other assessments using drastically lower figures.
5. Re financials and shakiness of using At The Wellhead pricing … 2/3 of Seneca’s production is hedged via NYMEX contracts with the floor of their collars at $3.50. No eye glazing explanations coming from me on this topic (I am no expert), but – suffice to say – that these companies put enormous effort into maximizing their financial returns. Sweeping, generalized statements can prove to be both inadequate and inaccurate when one delves into this aspect of the bidness.
Age of Gas is here.
Appalachia Rising!
Coffeeguyzz,
The Hedges are at most for 18 months out and they come at a cost, these are not free. Often not all costs are presented in an investor presentation, that is the reason for the fine print at the end that say in a nutshell, don’t believe any of this it is a sales pitch. On EURs, the average Pennsylvannia Marcellus well in 2020, based on a fit to Novilabs data will have an EUR of about 15 BCF, we can cherry pick wells (as is standard practice in investor presentations) and find some that are twice as productive and the CEO will claim with a straight face that this is their average well, but only fools believe what they hear in an investor presentation. OPEX in dry areas of the Marcellus are about $1.50/MCF, but for many producers this has been the wellhead price for most of the past 5 years (except 2022). Royalties are often 20% of gross revenue so at $2.50/MCF that’s 50 cents added to OPEX so that leaves a net of 50 cents per MCF. Let’s assume 15 BCF per well on average at 50 cents per MCF so about $7.5 million in net revenue over the life of the well (20 years) for a well with a capital cost of $8 million. Not a recipe for profit. Have you seen https://www.marcellusgas.org/pricing/index.php ?
My guess is you would choose the highest price on the list and claim that’s the price we should expect in the future.
Coffee:
1. Hit the enter button twice, to make paragraphs.
2. Hedges are just derivatives that you can separate from the production. If they guess right and make out on a hedge, than that just means that financial instrument is paying out. It might offset a bad well. But it hasn’t changed how the well does on its own. Also, if you hedge the downside, you are abandoning the upside. So…it’s not some magic thing that makes the plays better. Maybe for an entity with a high risk profile, they might do it. But the better companies fly naked (no hedges) and just take their chances on the future price. Also…there is a slight transaction cost.
Nony,
1. Thanks for the tip on paragraph spacing.
2. The info I posted re NFG’s hedging was to (futily, obviously) puncture Dennis’ wildly inaccurate interpretation of the ATW pricing revealed on that Marcellusgas site. While those ATW numbers are certainly accurate, they are NOT what the operators receive. As you know, contracted sales to customers outside the Basin pay on the differential basis relative to where the sales take place (ordinarily, not always) such as New York, Florida, Boston, etc. The hedging is just another pathway to – hopefully, for them – provide a revenue stream higher than those posted ATW pricings. No reflection at all on the field operations/productivity.
3. Above, Sheng Wu commented that some Marcellus yearly production profiles may be lowered due to low pricing. He may actually be more correct than he realizes. While going over individual production histories of ~250 Pennsylvania wells these past few days (pretty enlightening exercise), I was struck by just how many wells surged production in the October-December months. Often several MMcfd higher bumps. That means that these wells were obviously being somewhat restricted prior.
And THAT means that the entire premise of analyzing well productivity via production history profiles will always be somewhat dubious as the operators are controlling – at least to some degree – what the wells are able to produce.
4. The fact that Dennis has jumped into the Gas World has earned my respect. The info put out should benefit the wider audience, even with the varying (opposing?) views thusly presented.
That said, I am dismayed that he could ignore some of the outlandish things in Patzek’s paper, with the ridiculous (and easily disproven) claim of 13/14 year well life for the Marcellus wells being the most absurd. An extreme example of Patzek jumping the shark.
Oh well …
Coffeeguyzz,
Keep in mind that even dry gas wells often have liquids included either water or condensate and in a horizontal well later in life this can be problematic and stop the gas reaching the well head (or reduce the flow rate considerably). The Patzek estimate is a area average life based on a careful analysis of all the well data available at the time of the study. I personally use 20 years for average well life for these plays (Marcellus and Utica).
To put into perspective of relative size of the largest gas fields in the world.
The North Field-South Pars Joint field by Iran and Qatar producing 26.5BCFPD (Iran) and 13.5BCFPD (Qatar).
Russian’s Urengory-Yamburg (UY) could be count as one and its peak was close to 25BCFPD for couple of years in 1990s, and has maintained abover 20BCFPD till now.
There is also huge condensate giant formation below the UY (~1km) and further wet gas formation below, like Utica/Black River.
Just learnt the UY is actually a result of low maturity coal formations just below it.
Pre-shale revolution 2010, the world gas reserve , and now US shale gas reserve alone is ~ 1,000 TCF to 2,000TCF (upper)
the majority of Russia gas (red square) in Yamal region (blue-red square), and therefore the LNG route from Yamal to the world is vital to Russia and global LNG market.