By Ovi
The focus of this post is an overview of World oil production along with a more detailed review of the top 11 Non-OPEC oil producing countries. OPEC production is covered in a separate post.
Below are a number of Crude plus Condensate (C + C) production charts, usually shortened to “oil”, for the oil producing countries. The charts are created from data provided by the EIA’s International Energy Statistics and are updated to September 2025. This is the latest and most detailed/complete World oil production information available. Information from other sources such as OPEC, IEA, STEO and country specific sites such as Brazil, Norway, Mexico, Argentina and China is reported to provide a one or two month outlook.
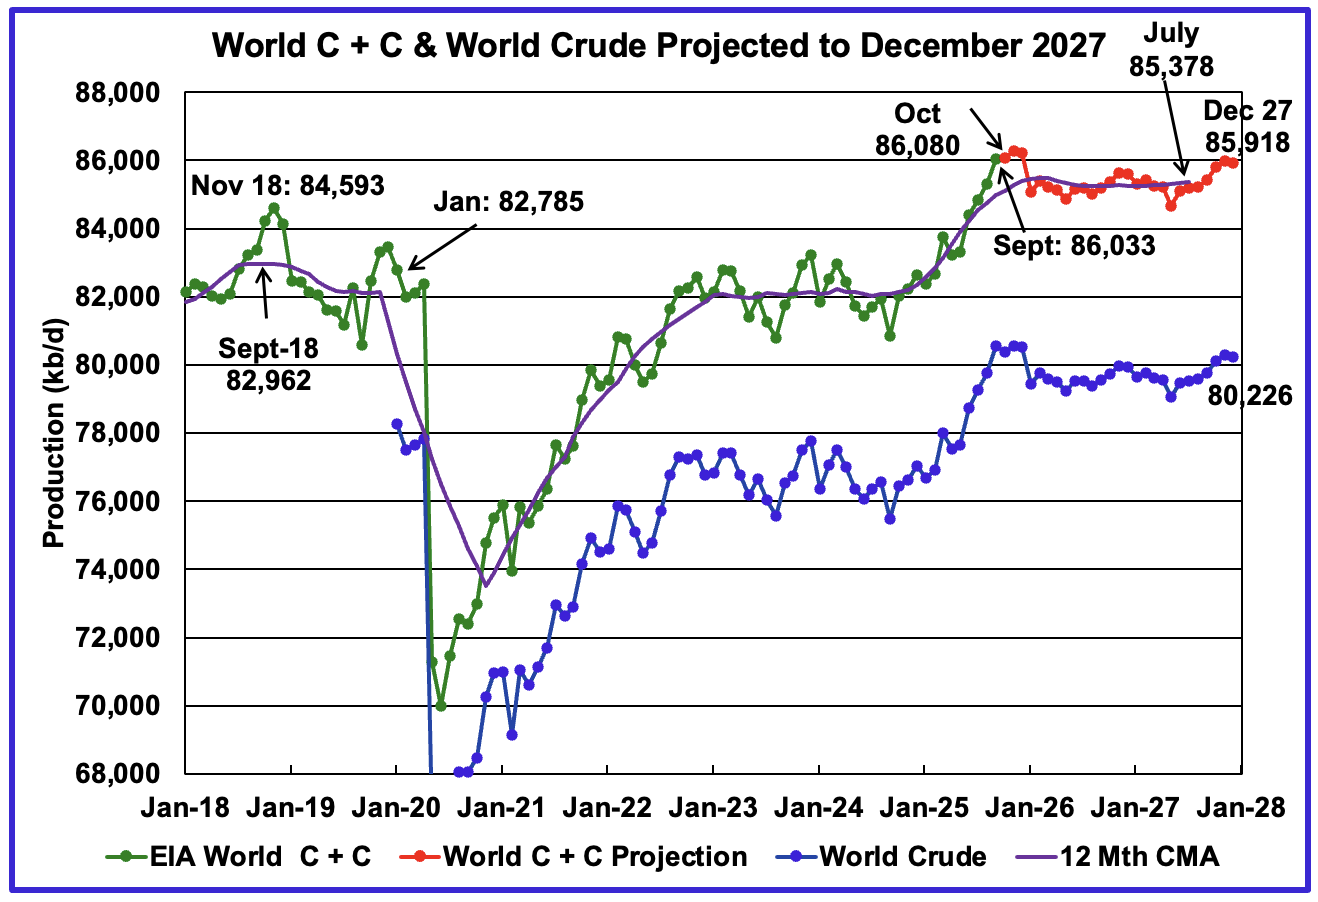
The World’s September oil production increased by 737 kb/d to 86,033 kb/d, a new World Peak Oil All Time High. The large September C + C increase is due to the 792 kb/d increase in crude production shown in the crude graph. That increase then drops in January 2026. The large January drop is just as surprising as the September increase.
The January 2026 STEO was released today and it projects oil production out to December 2027.
This chart has been updated to project World C + C production out to December 2027. It uses the January 2026 STEO report along with the International Energy Statistics to make the projection. Production in October 2025 is projected to increase by 47 kb/d to 86,080 kb/d, if correct, another new World Peak Oil next month.
The 12 month Centred Moving Average shown at July 2027 is 85,378 kb/d vs the September 2018 12 month CMA of 82,962 kb/d.
For December 2027, production is projected to be 85,918 b/d.

September’s World oil output W/O the US increased by 692 kb/d to 72,189 kb/d. October’s production is expected to increase by 20 kb/d to 72,209 kb/d.
The projection is forecasting that December 2027 World W/O US oil production will be 72,759 kb/d, an increase of 570 kb/d from September 2025.
A Different Perspective on World Oil Production
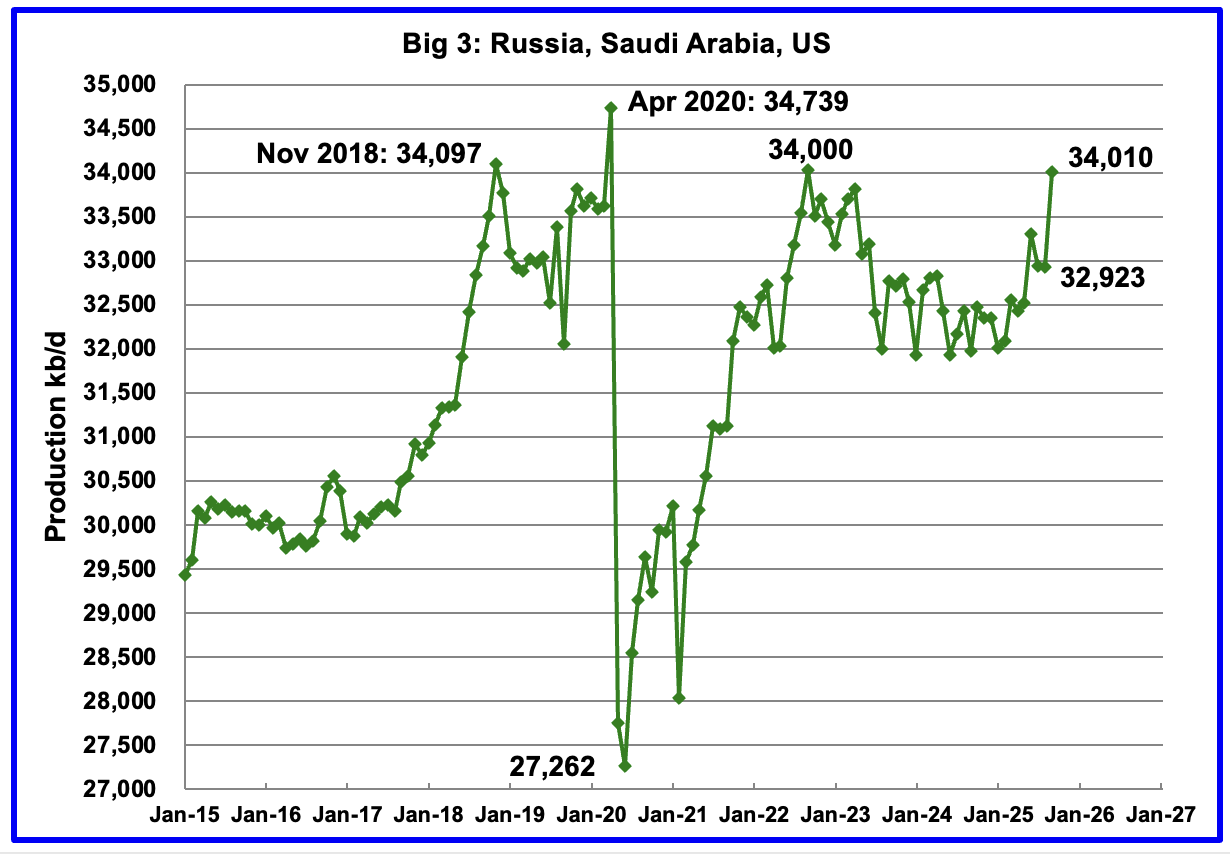
September’s Big 3 oil production increased by 1,087 kb/d to 34,010 kb/d. Saudi Arabia contributed 900 kb/d to the increase while Russia added 143 kb/d.
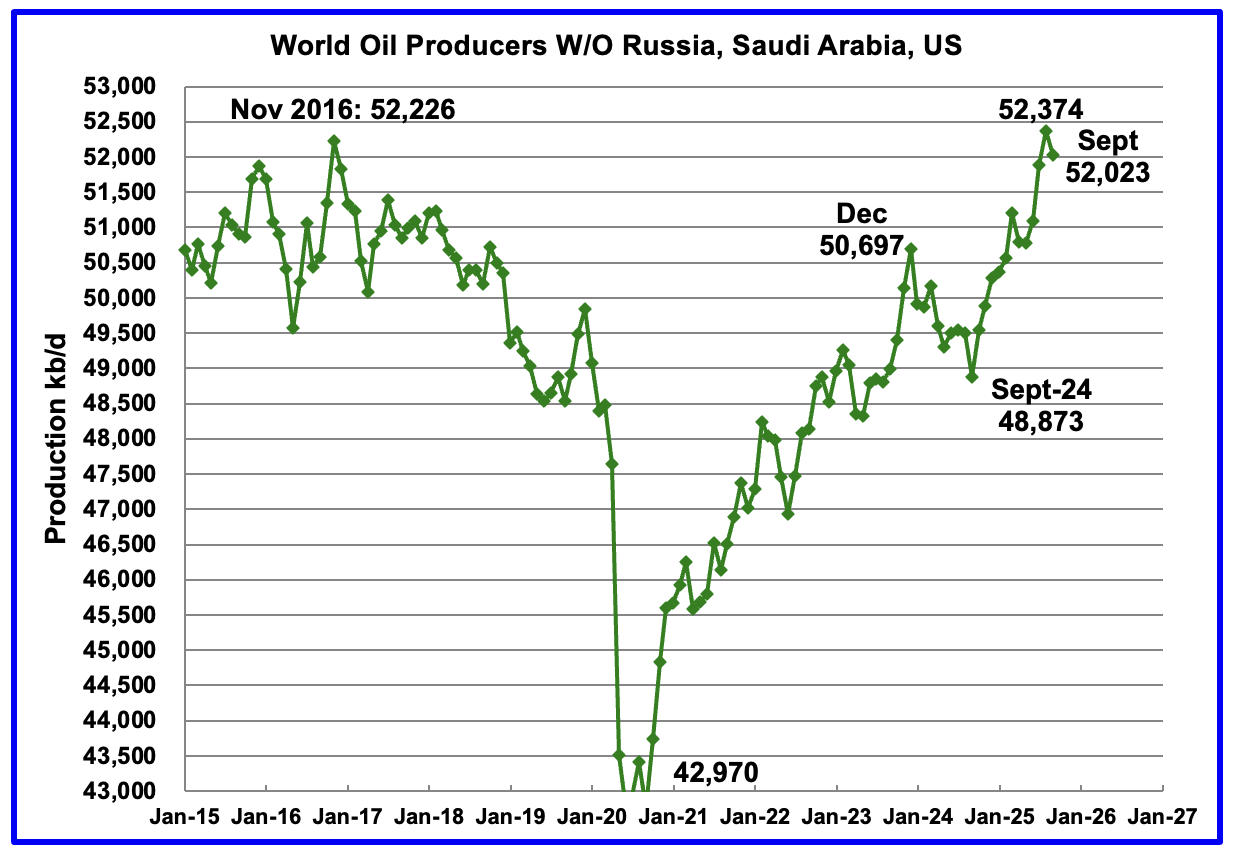
Production in the remaining countries has been slowly increasing since the September 2020 low of 42,970 kb/d. However production dropped in September 2025 by 351 kb/d to 52,023 kb/d.
Countries Expected to Grow Oil Production
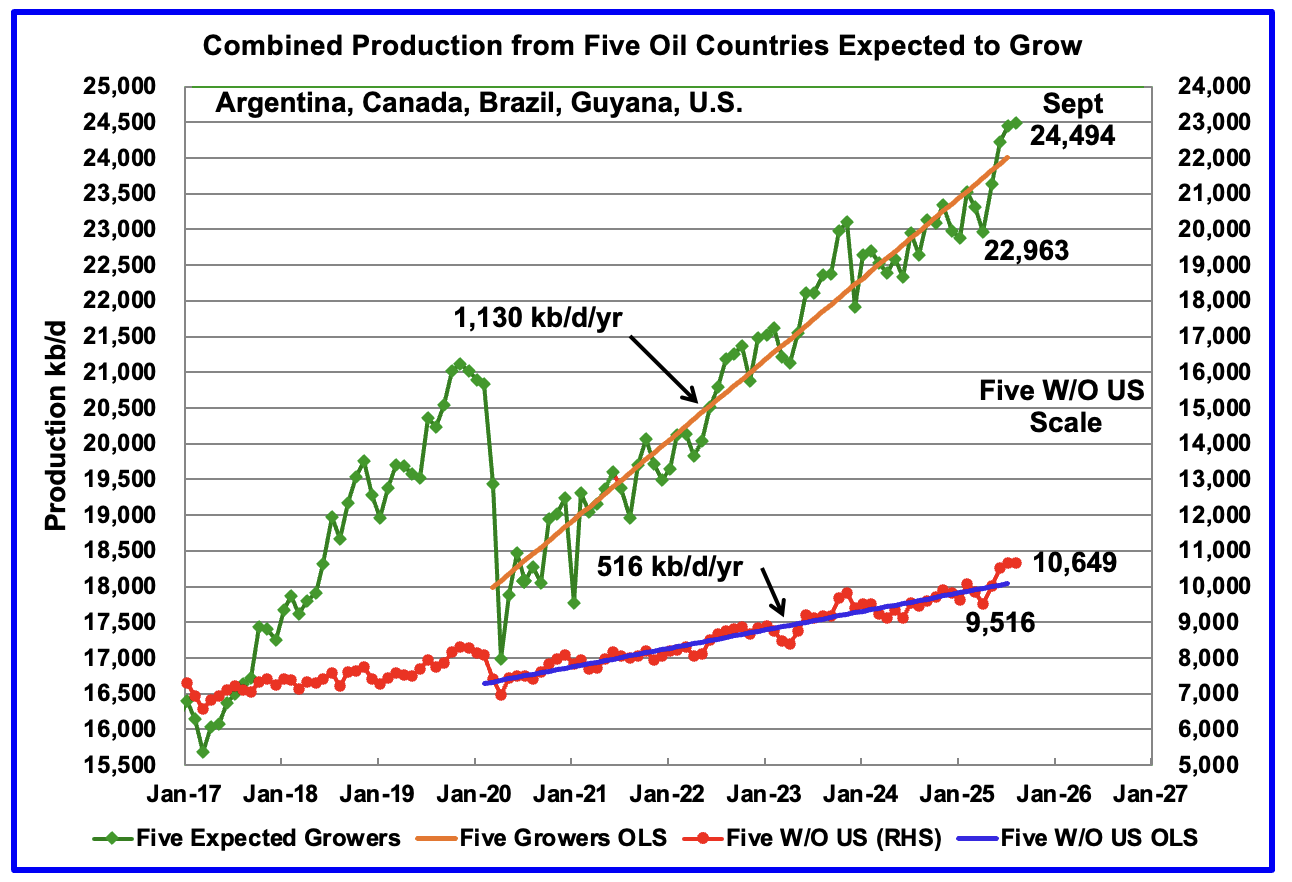
This chart was first posted a number of months back and shows the combined oil production from five Non-OPEC countries, Argentina, Brazil, Canada, Guyana and the U.S., whose oil production is expected to grow. These five countries are often cited by OPEC and the IEA for being capable of meeting the increasing World oil demand for next year. For these five countries, production from April 2020 to July 2025 rose at an average rate of 1,130 kb/d/year as shown by the orange OLS line.
To show the impact of US growth over the past 5 years, U.S. production was removed from the five countries and that graph is shown in red. The production growth slope for the remaining four countries has been reduced by 614 kb/d/yr to 516 kb/d/yr.
September production has been added to the five growers chart, up by 41 kb/d to 24,494 kb/d. September’s small production increase was a mix of small gains and declines. For the Five growers W/O U.S., September production declined by 4 kb/d to 10,649 kb/d.
October production is expected to grow again due to the large October Brazilian production increase.
Note: The OLS lines are updated to July. 2025
World Oil Countries Ranked by Production
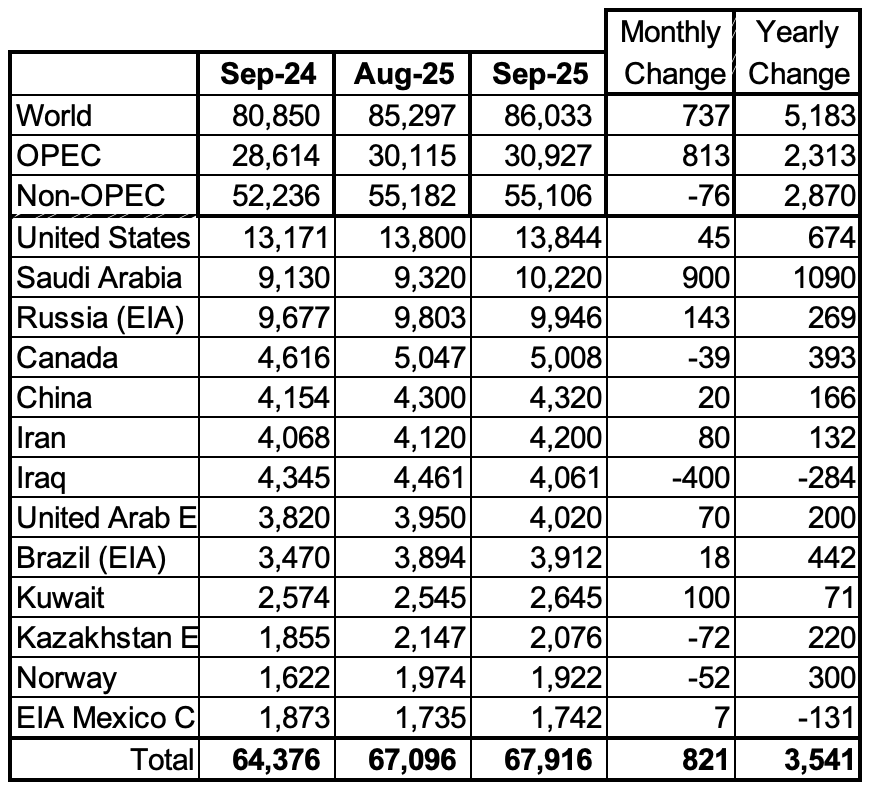
Above are listed the World’s 13th largest oil producing countries. In August 2025 these 13 countries produced 78.6% of the World’s oil. On a MoM basis, production increased by 821 kb/d in these 13 countries while on a YOY basis production rose by 3,541 kb/d. Note the YoY increases from Saudi Arabia, U.S. and Brazil
September Non-OPEC Oil Production Charts
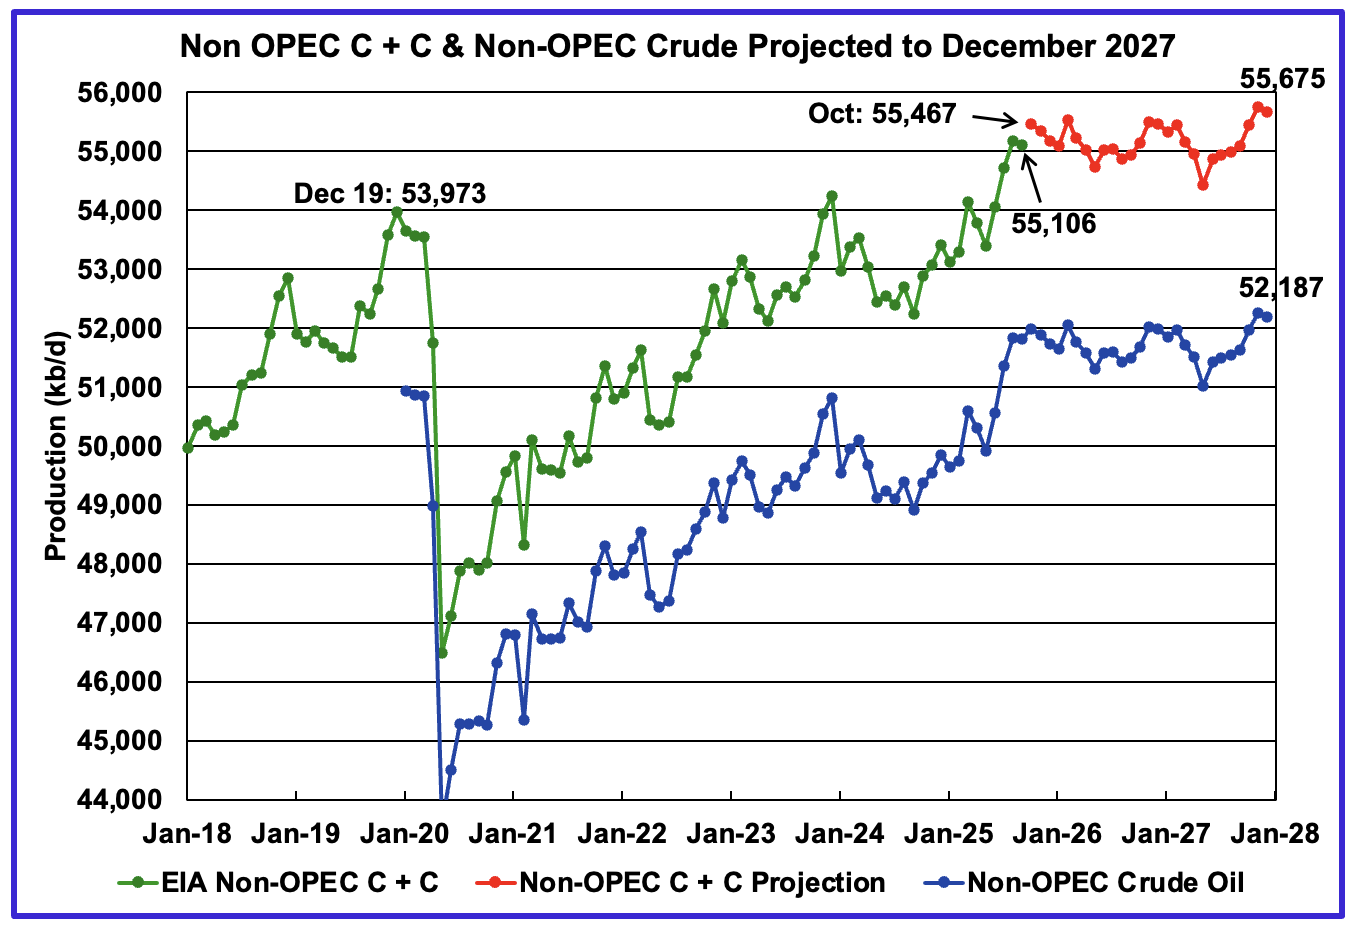
September’s Non-OPEC oil production decreased by 76 kb/d to 55,106 kb/d. October is expected to add an additional 361 kb/d to 55,467 kb/d.
Using data from the January 2026 STEO, a projection for Non-OPEC oil output was made for the period October 2025 to December 2027. (Red graph). Output is expected to grow by 569 kb/d from September 2025 to reach 55,675 kb/d in December 2027.
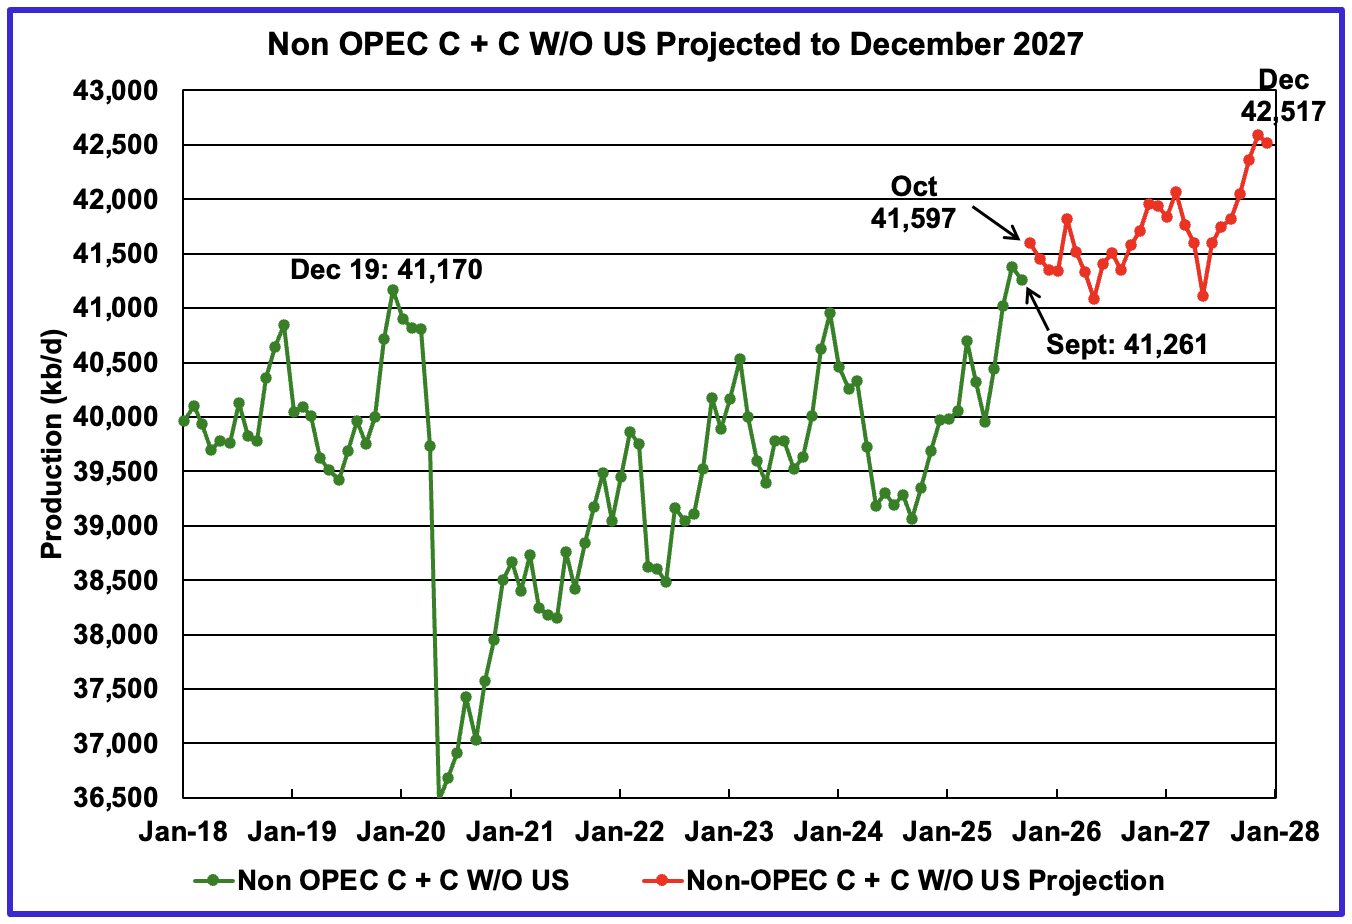
September’s Non-OPEC W/O US oil production decreased by 121 kb/d to 41,261 kb/d. October’s production is projected to add 336 kb/d to 41,597 kb/d.
From September 2025 to December 2027, production in Non-OPEC countries W/O the U.S. is expected to increase by 1,256 to 42,517 kb/d.
Non-OPEC Oil Countries Ranked by Production
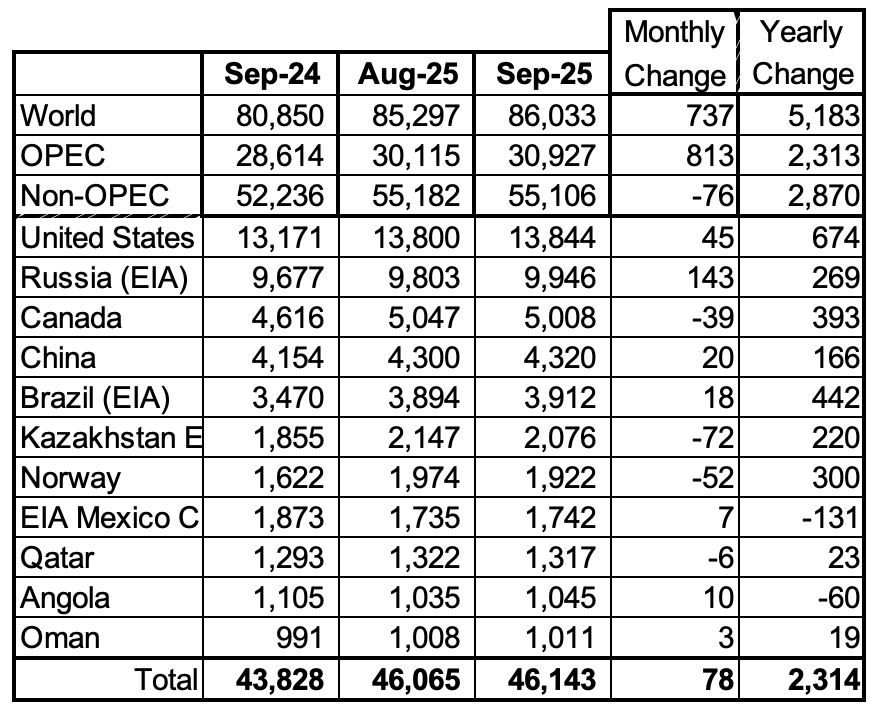
Listed above are the World’s 11 largest Non-OPEC producers. The original criteria for inclusion in the table was that all of the countries produced more than 1,000 kb/d. Both Oman and Angola were below 1,000 kb/d for a few months but have rebounded to above 1,000 kb/d.
September’s MoM production increased by 78 kb/d to 46,143 kb/d for these eleven Non-OPEC countries while as a whole the Non-OPEC countries saw a yearly production increase of 2,870 kb/d to 55,106 kb/d. Major yearly gains came from Brazil, Canada and the U.S.
In September 2025, these 11 countries produced 83.7% of all Non-OPEC oil.
Non-OPEC Country’s Oil Production Charts
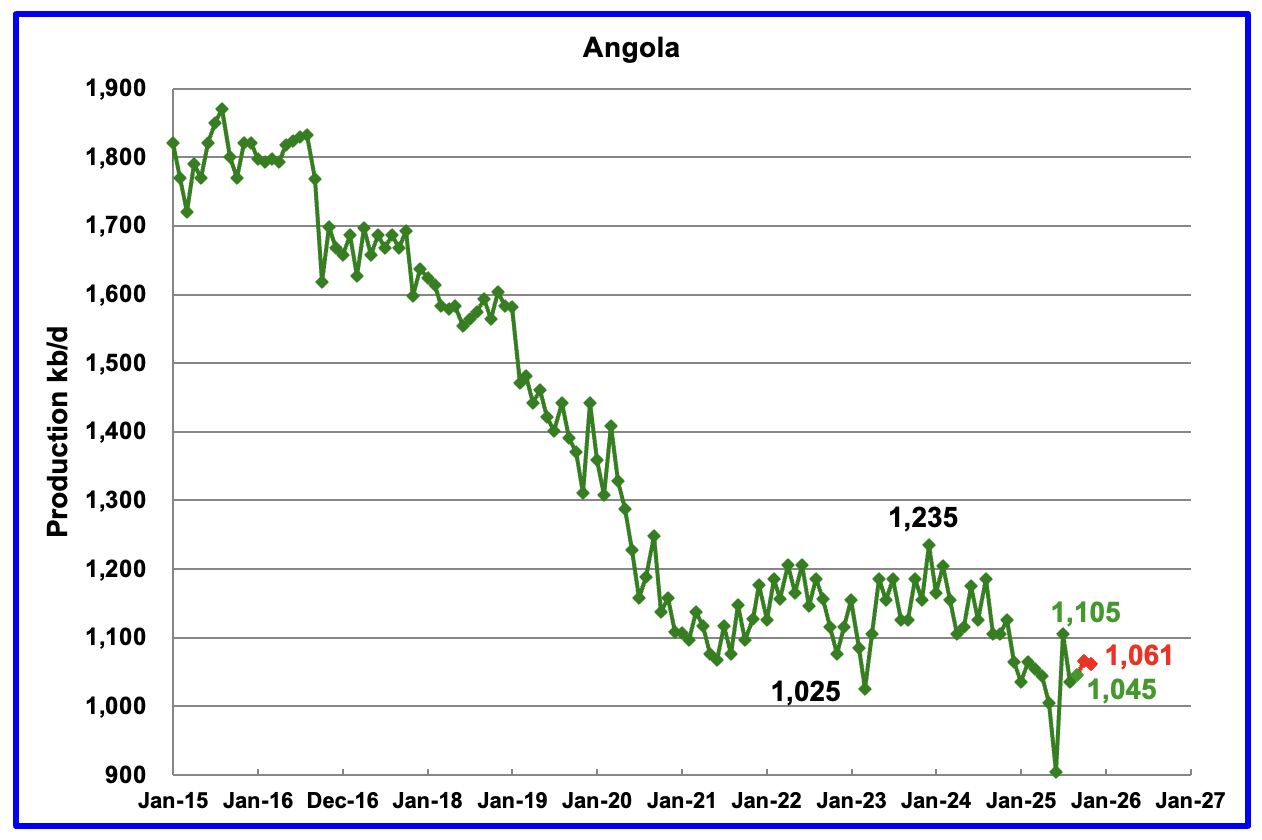
Angola’s September oil production rose by 10 kb/d to 1,045 kb/d.
According to the National Agency for Petroleum, November’s production was 1,061 kb/d, red markers.
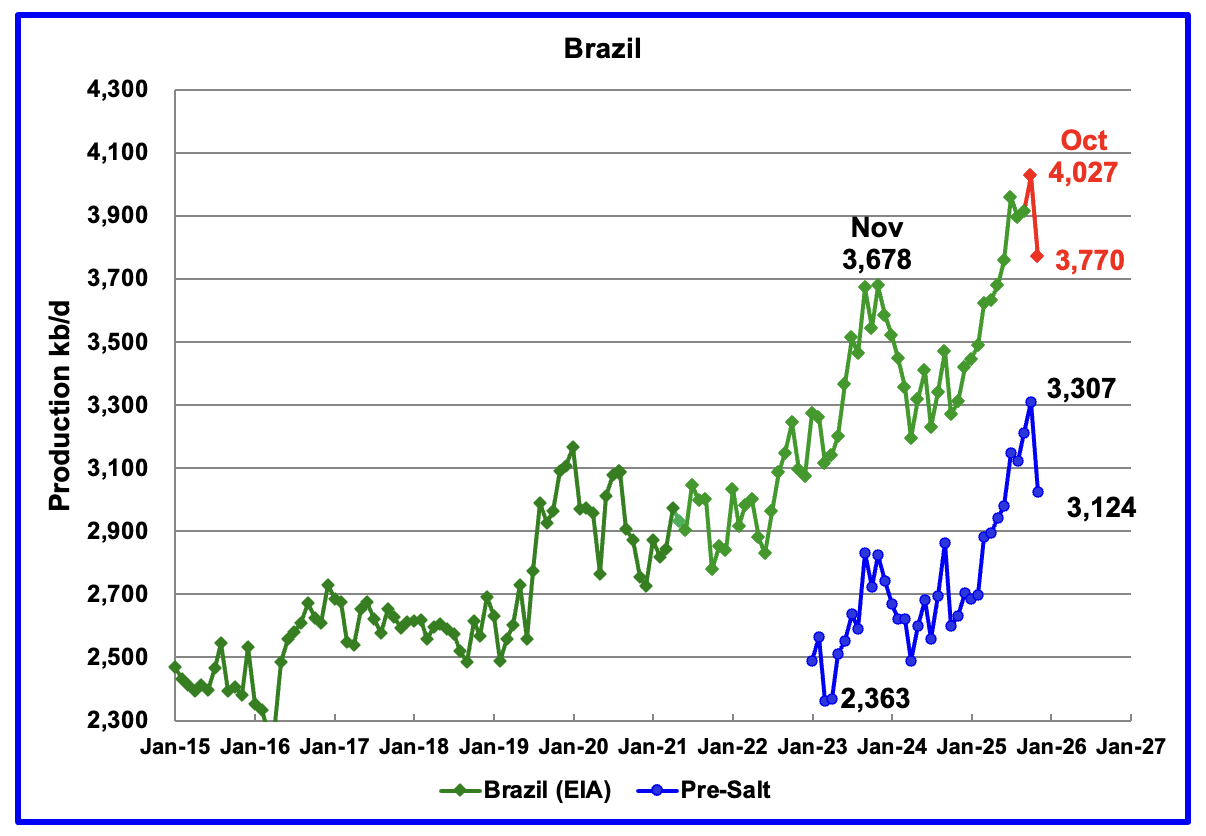
The EIA reported that Brazil’s September’s production rose by 18 kb/d to 3,912 kb/d.
Brazil’s National Petroleum Association (BNPA) reported that production rose in October to a new high of 4,027 kb/d and then dropped by 257 kb/d in November to 3,770 kb/d. The pre-salt blue graph tracks Brazil’s trend. Pre-salt production decreased by 283 kb/d in November to 3,124 kb/d.
According to this article, the Production drop was due to platform outages at offshore fields.
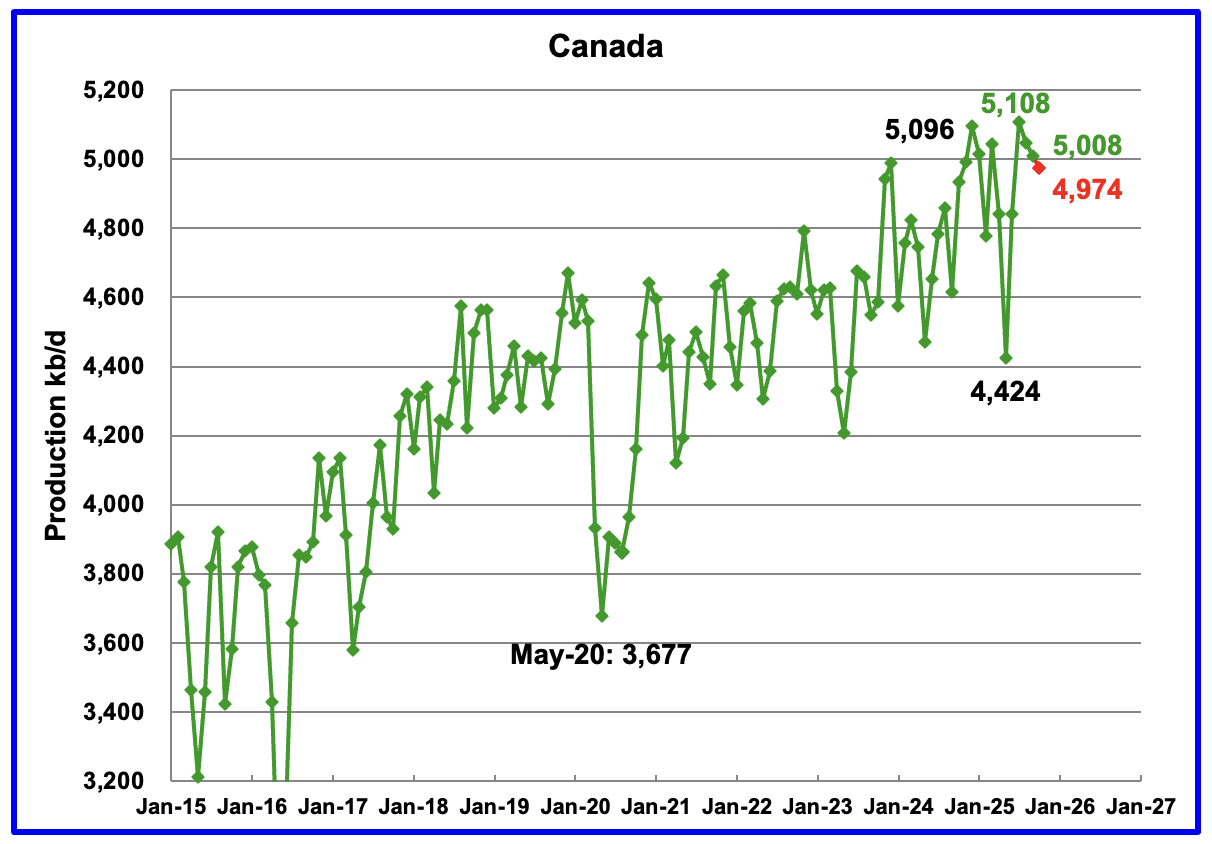
Canada’s oil production decreased by 39 kb/d in September to 5,008 kb/d.
A projection has been made for October production based on preliminary production provided by the Canada Energy Regulator (CER). October’s projected production dropped to 4,974 kb/d. The CER estimate contains some NGLs which have been removed from the projection. On average the EIA reduces the CER’s monthly production by 375 kb/d.
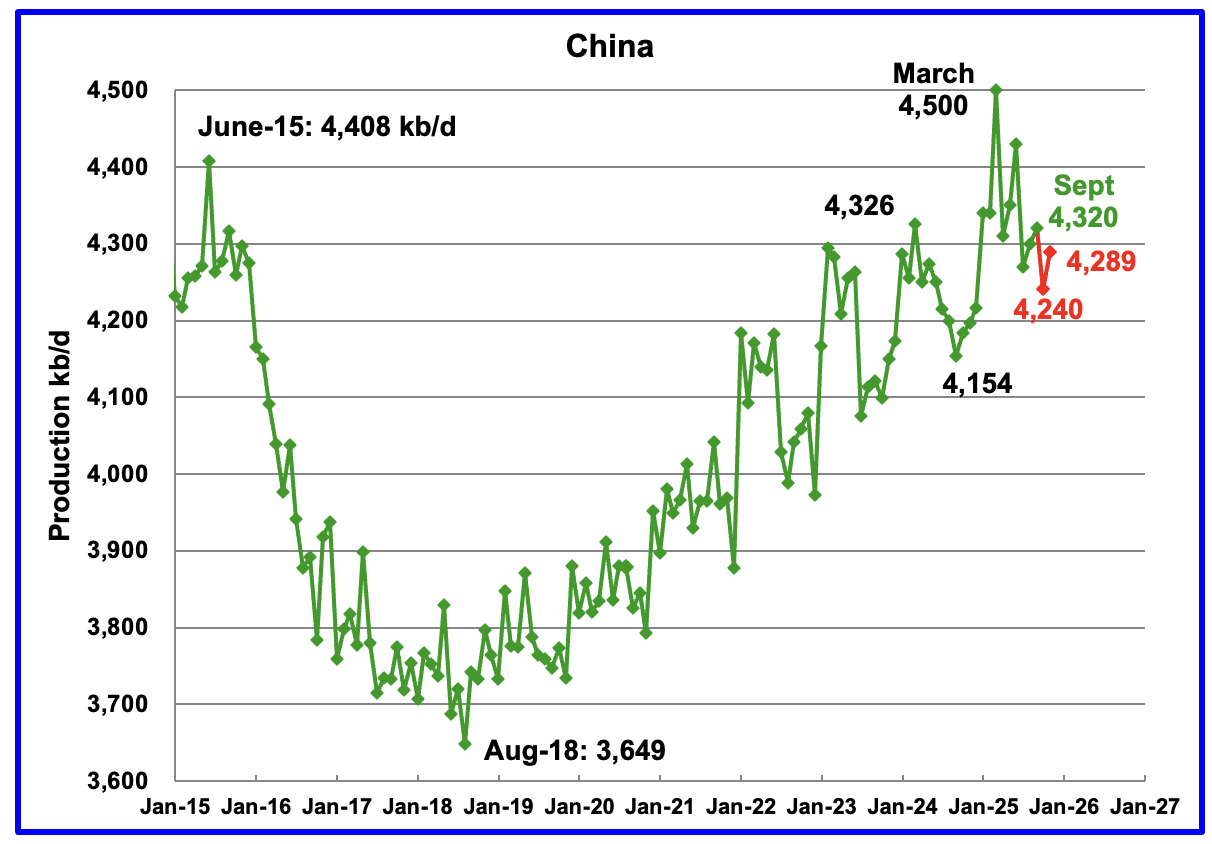
The EIA reported China’s September oil output rose by 20 kb/d to 4,320 kb/d.
The China National Bureau of Statistics reported October production dropped by 80 kb/d to 4,240 kb/d and then in November rose by 49 kb/d to 4,289 kb/d.
On a YoY basis, China’s August production increased by 166 kb/d from 4,154 kb/d.
According to the OPEC December MOMR: Offshore developments, particularly in Bohai Bay in northern China and the South China Sea, are projected to lead overall production growth following recent exploration investment.
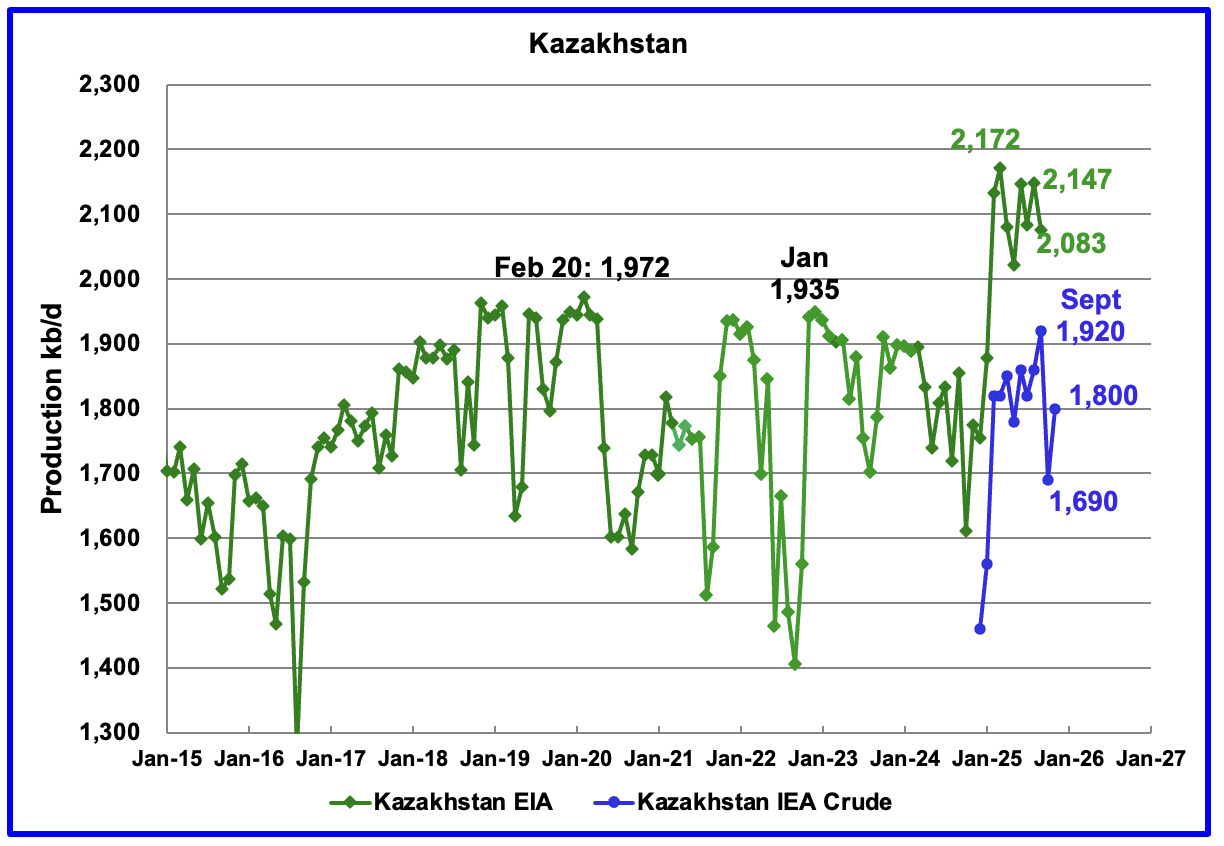
According to the EIA, Kazakhstan’s September oil output decreased by 72 kb/d to 2,076 kb/d.
Since Argus no longer reports OPEC + crude production, production data for Kazakhstan will now be taken from the monthly IEA reports. In September 2025 pre-salt crude production rose to 1,920 kb/d. In the IEA’s December report, they reported October’s production dropped by 230 kb/d to 1,690 kb/d and then rose to 1,800 kb/d in November.
The November oil production is 320 kb/d above the OPEC + target set for Kazakhstan.
According to this Article: Four Opec+ producers plan to triple compensation cuts by June. Kazakhstan will make the deepest cuts.
“Kazakhstan will account for the largest share of the increase, with its cutbacks totalling 669,000 bpd by June, from 131,000 bpd in December. Baghdad, which frequently overproduces its quota within Opec+, will maintain cuts at a 100,000 bpd level by midyear.”
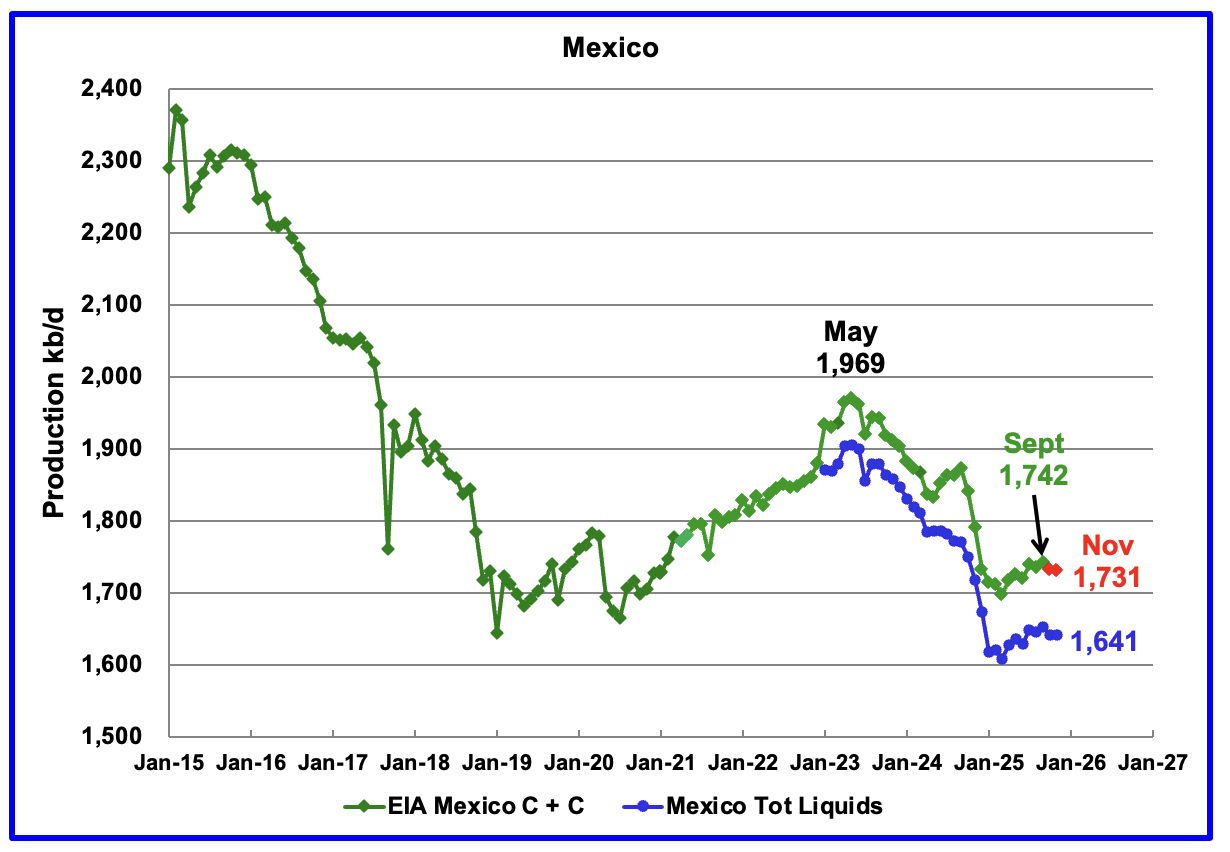
According to the EIA, Mexico’s September output rose by 7 kb/d to 1,742 kb/d.
In June 2024, Pemex issued a new and modified oil production report for Heavy, Light and Extra Light oil. It is shown in blue in the chart and it appears that Mexico is not reporting condensate production when compared to the EIA report.
In earlier EIA reports, they would add close to 55 kb/d of condensate to the Pemex’s “Total Liquids” report. More recently the EIA has been adding 90 kb/d of condensate to Mexican production. For October and November production, 90 kb/d have been added to the Pemex report. November’s production is estimated to be close to 1,731 kb/d and was unchanged from October. Note that Mexico’s production, as reported by Pemex for the last four months has stabilized around 1,650 kb/d.
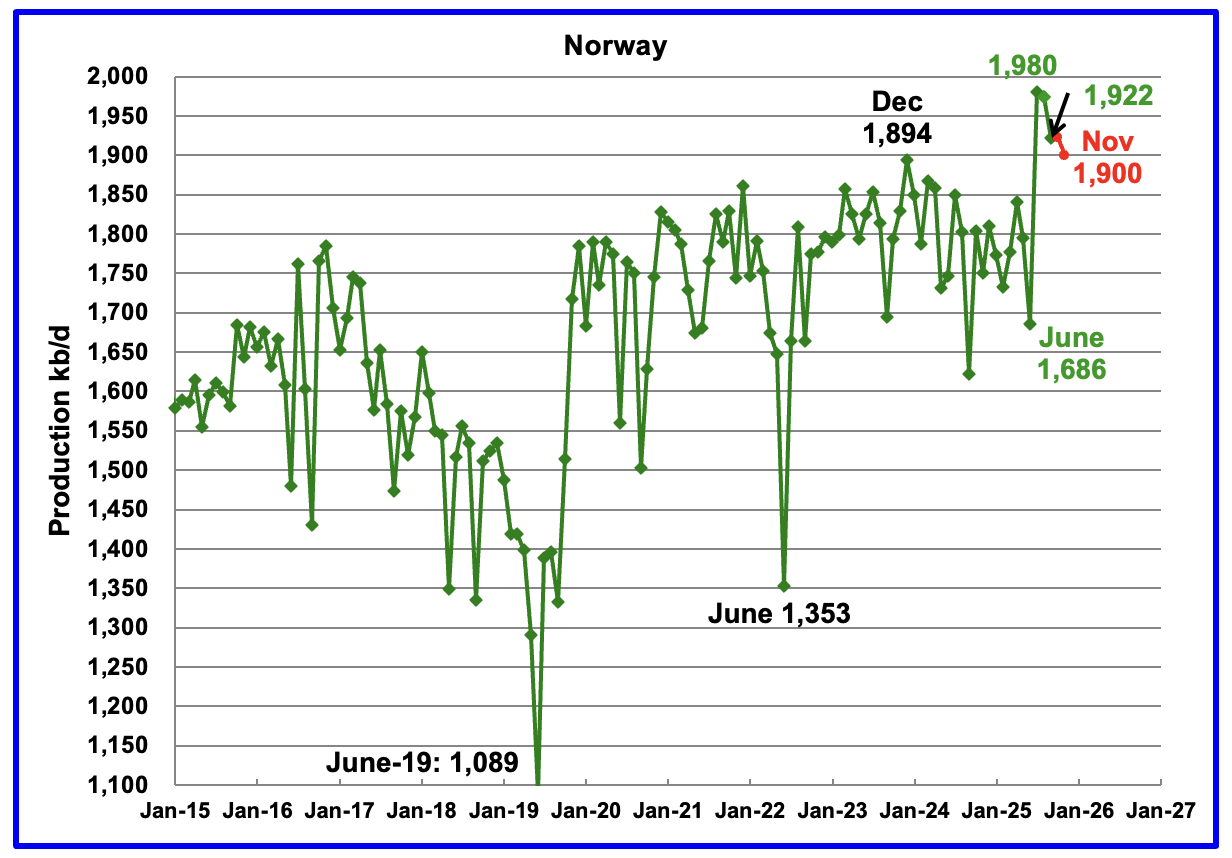
The EIA reported Norway’s September’s production dropped by 52 kb/d to 1,922 kb/d.
Separately, the Norway Petroleum Directorate (NPD) reported that October’s production was flat and November’s production dropped to 1,900 kb/d, red markers.
The Norway Petroleum Directorship also reported that November’s oil production was 4.3 % above forecast.
According to the OPEC December MOMR: “For the remainder of the year, output is expected to be underpinned by the Johan Castberg and Jotun FPSOs, complemented by strong contributions from Johan Sverdrup”
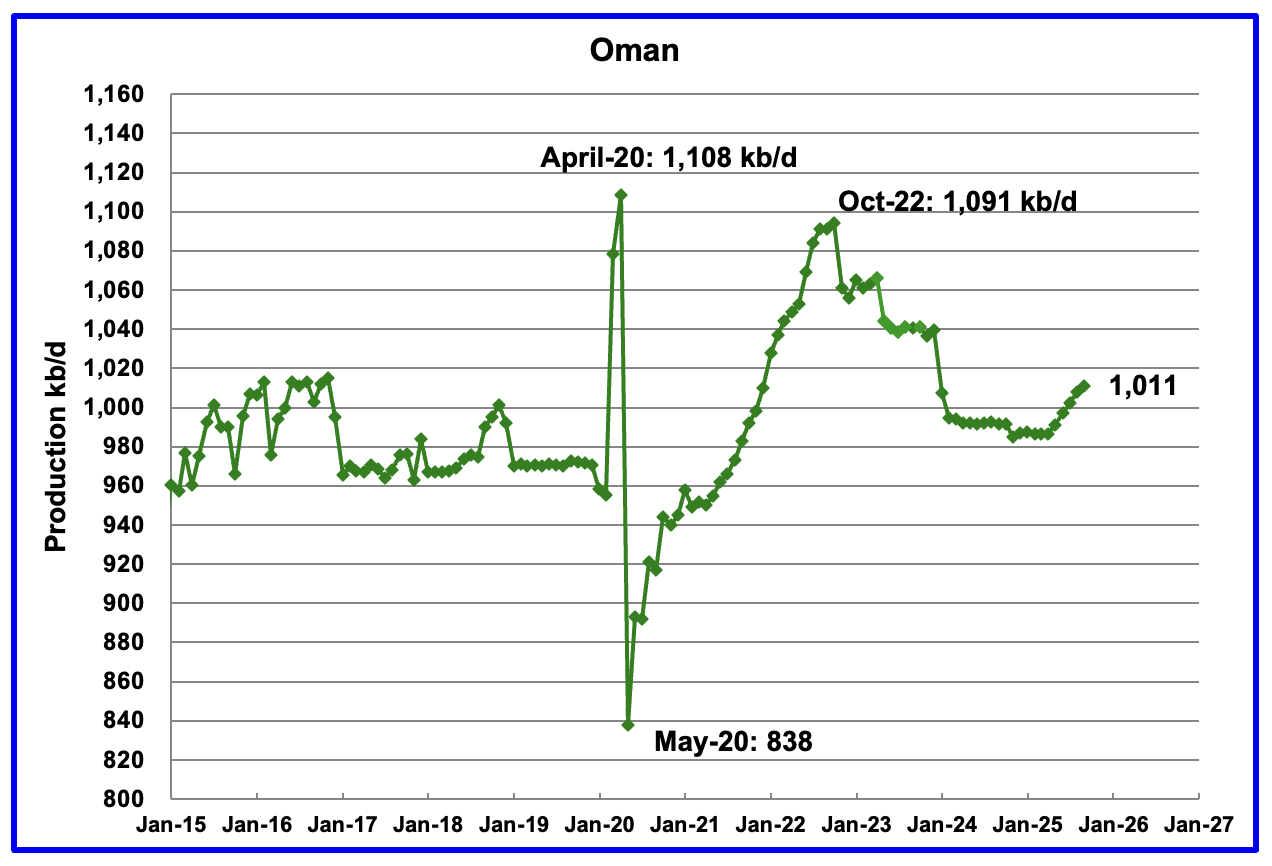
According to the EIA, September’s output rose by 3 kb/d to 1,011 kb/d and appears to have begun a budding growth phase. Previous production peaked in October 2022.
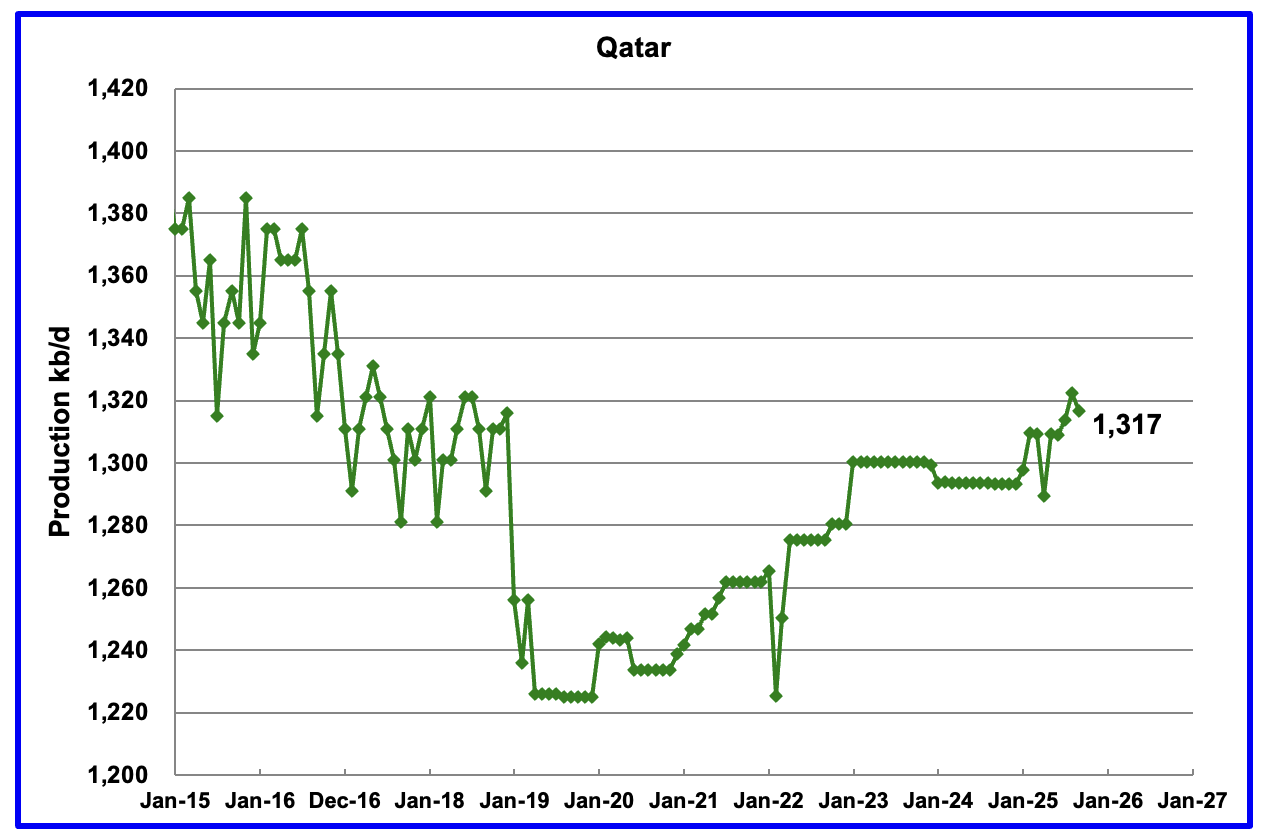
Qatar is now providing the EIA with monthly updated oil production back to January 2025. Qatar’s September’s output was reported to be 1,317 kb/d down 5 kb/d from August
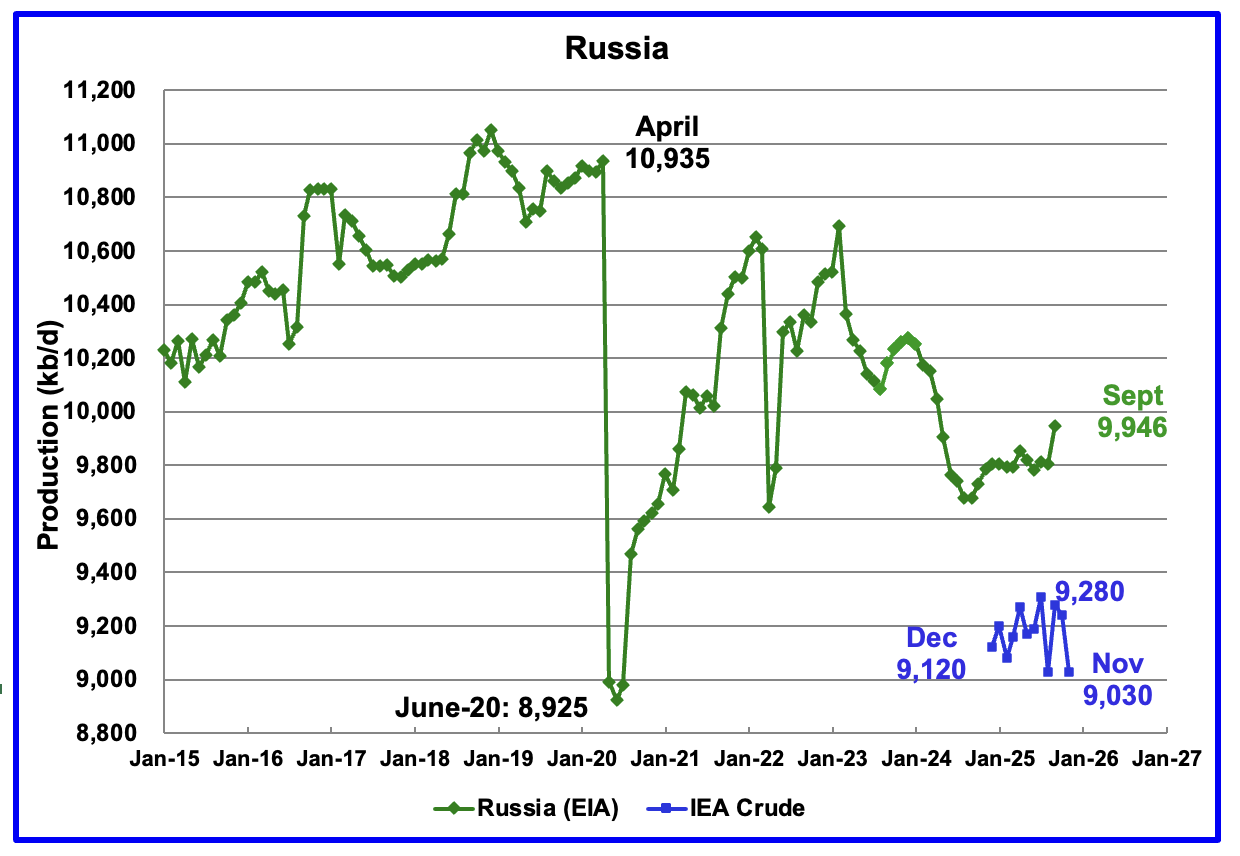
The EIA reported Russia’s September C + C production increased by 143 kb/d to 9,946 kb/d and was up by 269 kb/d from September 2024.
Up to August 2025 Argus Media used to report OPEC + crude production. That monthly report has now been discontinued. The above chart now also shows Russian production as reported by the IEA. It is difficult to assess the accuracy of the IEA report but over the last few months the IEA’s Russian production has been around 100 kb/d to 150 kb/d higher than Argus’ Media. The best that can be done at this time will be to compare the production trends between the EIA and the IEA. I think that Russian oil production continues to be a major state secret at this time because of the damage being caused by the heavy bombing to its related crude oil processing facilities.
According to the IEA’s December report, October crude production was 9,240 kb/d and then November production dropped by 210 kb/d to 9,030 kb/d. November production was 500 kb/d lower than the OPEC + target set for Russia and is the first month that may be showing the effects of Ukrainian bombing.
According to this Article: Russia’s Crude Output in December Made Deep Plunge due to Ukrainian drone attacks.
“Russia’s crude oil production plunged by the most in 18 months in December, pincered by western sanctions that are causing the nation’s barrels to pile up at sea and a surge of Ukrainian drone attacks on its energy infrastructure.
The nation pumped an average 9.326 million barrels a day of crude oil last month, according to people with knowledge of government data, who asked not to be identified discussing classified information. The figure — which doesn’t include output of condensate — is more than 100,000 barrels a day below November, and almost 250,000 barrels a day lower than Russia is allowed to pump under agreement with the Organization of the Petroleum Exporting Countries and allies.”
Note there is huge discrepancy between the bold statement regarding Russia’s November production and the production reported by the IEA. A likely explanation could be the IEA picked up the big drop in November a month before Bloomberg picked it up.
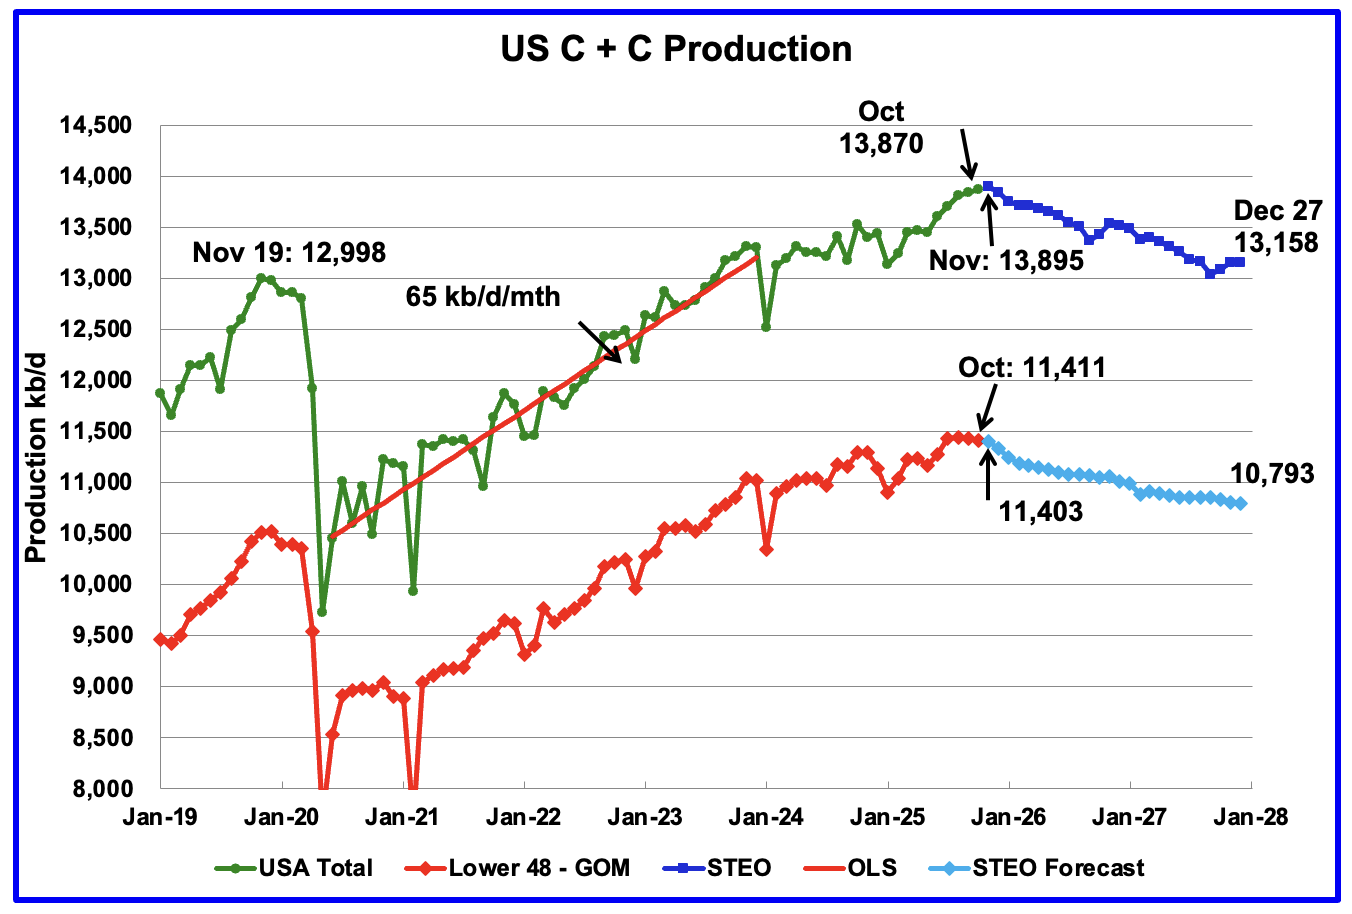
This US production chart up to October 2025 is the same as the one published last week in the US update. However the projected portions of the two production graphs have been updated and extended to December 2027 using the January 2026 STEO.
U.S. November projected production has been revised up by 34 kb/d to 13,895 kb/d from the last report.
Production in December 2027 is expected to be 13,158 kb/d. Production peaks in November 2025 and then begins its slow steady decline.
Note production in the Onshore L48 essentially peaked in August 2025 at 11,440 kb/d. Production decline steepens starting in December 2025.
163 responses to “Record September World Oil Production”
Ovi thanks
It is interesting to look back and see predictions from a year ago.
https://peakoilbarrel.com/september-non-opec-and-world-oil-production-drops/
They were 1.5mb/d on the low side.
Production is now mainly dependent on what happens politically. Can the Ukrainian forces destroy enough Russian processing and transportation infrastructure?
What will happen in Iran, how many more poor young people slaughtered by those old evil leaders?
What happens in Venezuela is not quite so important in the short term.
Iver
The first clue that the world was going to hit a new peak came in the October 2025 post. The EIA finally took the OPEC unwinding cuts seriously after OPEC announced on August 3 that they were going to accelerate their cuts to 547 kb/d starting in September 2025. The October post was the first post to forecast a new high.
In that post I noted: “Production in July is projected to increase by 553 kb/d to 84,737 kb/d, if correct, a new World Peak Oil. The 12 month CMA plotted at July 2026 is 85,314 kb/d.”
https://opec.org/pr-detail/572-03-august-2025.html
https://peakoilbarrel.com/june-world-and-non-opec-oil-production-rise/
A Op
Iran strikes delayed as Trump aides and Israel raise concerns
https://www.axios.com/2026/01/15/trump-iran-strikes-israel-concern
11 Jan 2026
Iran update January 2026
https://crudeoilpeak.info/iran-update-january-2026
Ovi, thanks.
Did SA really raise production 0.9 MM bopd in a month? I tried doublechecking, by going to EIA, but that link sends me to a very hard to use page (e.g. not showing data after 2024, hard to sort).
This old article says there was not such a radical change: https://archive.is/QPT44
SA according to OPEC January 2026 Monthly 10078 kbd
Nony
Sorry about that bad link. I will update it.
try this one.
https://www.eia.gov/international/data/world#/?pa=00000000000000000000000000000000002&f=M&c=ruvvvvvfvtvvvv1vvvvvvfvvvvvvfvvvsu20evvvvvvvvvvvfuvg&ct=0&tl_id=5-M&vs=INTL.57-1-AFG-TBPD.M&cy=201001&vo=0&v=T&start=201001&end=201905&showdm=y
Thanks. Checks correct.
FWIW, SA kind of varies a lot in that data series. Like JUN was 9.9 MM bopd.
Nony
This is what the January OPEC MOMR is showing for SA for October, November and December
Oct Nov Dec
10,000 10,051 10,078
Very little variation.
But…but. I was told by Ron Patterson that 2015, err 2016, err 2018 was the ultimate peak. And that OPEC couldn’t put more barrels back in production…they were pumping all out and lying about being able to do more.
https://www.youtube.com/watch?v=r4iGo0dqsZE
Nony
The critical level to watch for SA is 10,500 kb/d. They only kept that level for about 6 months. Also they are supposed to have 12,000 kb/d capacity, i.e. another 2000 kb/d of spare capacity.
Screenshot
Ovi,
Note that the chart is crude only, Saudi Arabia’s annual average C+C output was over 10,600 kb/d in 2022 and 2018.
According to EIA, SA had annual averages of (MM bopd):
2018: 10.6
2019: 10.0
2020: 9.4
2021: 9.3
2022: 10.7
2023: 9.7
2024: 9.2
I think there is an incredibly long history of SA moving production up/down for strategic pricing reasons. Peak oilers (e.g. the late Stuart Staniford in 2007) would overinterpret temporary downturns as SA starting to falter.
As you can see, several of those years* had SA voluntarily down at least 1.0 MM bopd. As such the “world peak” was always in some danger when SA (and perhaps close allies) brought barrels back. But Ron was personally invested in wanting to “call a peak” in 2019 and later. So he ignored this. And ignored sober cautions from Dennis. And ignored…the confounding aspect of Covid. In fact, we are hitting new records now…and Saudi barrels coming back are medium big part of that.
*Yes, not all, but in 2022 US production was still not back to pre Covid levels.
Dennis/Nony
Attached is SA C + C. Bounced around 9,200 kb/d since July 2023. June 2025 is when SA started to open their taps.
As I recall they got fed up by their cheating partners.
A SA
Thanks, Ove.
They are probably not too happy with US shale either.
https://x.com/MOAR_Drilling/status/1346532124581634053/photo/1
Darned cockroaches. You think you’ve eradicated them with a bust and then come flowing back out of the cracks once you raise price. What to do…what to do?
Nony,
See
https://blog.gorozen.com/blog/analyzing-the-degolyer-macnaughton-audit-of-saudi-crude-oil-reserves
The piece suggests about 160 Gb of reserves at the end of 2019, which suggests a URR of about 310 Gb. At the end of 2024 KSA had produced about 175 Gb of C+C, so they may be beyond their peak. It is possible that URR is 365 Gb when possible reserves to be produced after 2077 are included (about 55 Gb) which suggests a peak at 182 Gb. At 10 Mb/d output 50% of URR would be reached at the end of 2026.
In any case only 160 Gb of Saudi Reserves were audited.
If you ignore the part about the small fields and the part about production past 2077 (contract limit of the concession). The latter of which is a limit on the corporation, not the geology, not the nation.
Nony,
Only 160 Gb of reserves were audited. The small fields may or may not have the reserves claimed and the reserves that might be produced after 2077 may be 55 Gb or might be much less, the claim that 270 Gb of Saudi oil reserves were audited is incorrect.
One could claim the small remote fields have 3000 Gb of reserves, but just because an OPEC nation makes an assertion by no means makes it correct.
Ok. But it pretty much validates the overall number. Like a 914 survey and the overall.
You can’t wish away the unaudited small fields. And you definitely can’t wish away the post concession production from known and audited fields. The latter is just an Aramco versus Saudi Arabia issue.
Nony,
The claim was that 265 Gb of Saudi reserves were audited. the claim is false. That is all I said. Are the claimed small fields and reserves that might be extracted after 2070 “proved reserves”, no they are not. Perhaps their are some resources that might be extracted beyond the 160 Gb or so that have been audited, perhaps it is 10 Gb or 100 Gb, we would need an audit to know. So far it is just guesses, we could claim 1000 or one million Gb more if you would like.
We don’t know. If 162 Gb validates 273 Gb then you would be correct. Basically what has been validated is 110 Gb short of what the Saudi’s claim.
The Shale Project That Can’t Deliver What Saudi Arabia Promises
For example and starting from the very beginning, 1989 saw Saudi Arabia claim proven oil reserves of 170 billion barrels. But only a year later — without the discovery of any major new oil fields or major verified reappraisals of reserves at existing fields — the official estimate somehow grew by 51.2%, to 257 billion barrels. Shortly after that, and again without any major new discoveries, Saudi Arabia’s proven reserves increased to just over 266 billion barrels, and they rose once more in 2017 to 268.5 billion barrels. Over the period in which these increases were announced, the country was extracting an average of 8.162 million bpd. Therefore, from 1990 (the year in which Saudi Arabia’s claimed proven oil reserves jumped from 170 billion barrels to 257 billion barrels), to 2017 (the year when Saudi Arabia was claiming proven oil reserves of 268.5 billion barrels), the Kingdom had physically removed from the ground forever an average of just over 2.979 billion barrels of crude oil every year. The total amount of crude oil permanently removed from the beginning of 1990 to the beginning of 2017 was, therefore, 80.43 billion barrels. In short, from 1990 to 2017, Saudi Arabia’s official crude oil reserves number had gone up 98.5 billion barrels, despite there being no new oil finds and it physically removing 80.43 billion barrels forever.
Frugal
A number of comments I have seen is that SA’s number is the OOIP and does not bother to change it. It serves their purpose to keep the world guessing.
They had two premier reserves accounting firms (G&M and GCA) audit the reserves before the Aramco IPO. Peak oilers had been asking for this for years…but once it was done, they complained and didn’t like the result.
Besides that….just look at production. We are almost 20 years since Staniford’s alarmist article:
“A Nosedive Toward the Desert
Posted by Stuart Staniford on March 8, 2007 – 10:15am
…Or, Why the Decline in Saudi Oil Production is Not Voluntary”
And…production is humming along fine, returned to/above the levels when Staniford wrote that article (and other similar ones).
Interesting that the natgas development impact doesn’t seem to ‘stir the masses’.
It sure stirred moi.
Displacing almost 350,000 barrels of earl per day in ~5 years seems like a big deal.
Bumping that up to a ~half billion bbd displacement in the not-too-distant future is, likewise, equivalent to bringing that product online from ‘new’ sources.
Significant doin’s in my book.
More evidence that The Age of Gas has arrived.
PS. The Boys from Beetaloo are on a roll.
Operational advancements at light speed.
Possible – but a stretch – to completely supply east coast gas demand by 2030/31.
Velkerri B alone comparable to the Mighty Marcellus, with additional in-place hydrocarbon stacks to supply Oz for over a century.
Goodonya, Aussies, for charging ahead for the betterment of your peeps!
Coffee,
I wonder how that Cummins X15N is selling. The company stock has doubled in the past 2 years.
China also – 1 year ago
-“Weichai held a grand event in Chengdu to celebrate a major milestone—the production of its 800,000th (natural) gas engine. At the same event, Weichai also introduced its latest product, the WP16NG4.0, reinforcing its leadership in the natural gas commercial vehicle engine market…”
-“In 2024, sales of heavy-duty natural gas trucks in China reached 178,200 units, a 17% increase compared to 2023”
there is a caveat here about the reserve estimate, it is based on “Porosity * Volume * EUR”
the volume for conventional oil is rather simple with known formation thickness and well spacing, but EUR and Porosity are highly variable. The EUR depends on the production techniques applied, i.e. water and chemical flooding, fracking, and etc, if the oil price is low, extra techniques are not warranted, and therefore lower EUR.
The porosity could also be highly varying for conventional carbonate formations, whereas it is quite accurate for sandstone formations. The carbonate could have significant nano-porosity as in shale and tight rocks, and therefore the porosity could be well underestimated. The largest KSA field, Ghawar, is a carbonate oil field and some could have nano-porosity as high as the conventional porosity, and that’s why sometimes geologists are puzzled by the extra-high permeability and productivity with relatively low porosity (conventional). Most conventional reserve estimate discount nano-porosity, and therefore given a “reasonable” EUR of 25% is actually well under 15% with the nano-porosity discounted.
Hickory
Attached is an article on that engine.
As a bit of background around 1987 I Ied a team that put together a consortium to build the first natural gas transit bus in North America. The NG engine was developed at the Ontario Research foundation in cooperation with Cummins. Their transit diesel engine was converted to a lean burn spark ignited cycle. Orion bus industries made the bus. The natural gas compressor stations located at three transit properties were supplied by the gas suppliers.
We discussed with Cummins doing a truck engine but never did. The issue was where to put the cylinders to give the long haul 48 ft tractor trailers 500 mile range. Not sure how they have solved this problem. Same issue with long haul EV tractor trailers.
https://www.trucknews.com/equipment/test-drive-cummins-x15n-big-bore-natural-gas/1003192851/
Hickory,
I get minimal info on that X15N from Cummins’ quarterly conference calls. If the attending analysts ask sharp questions (always a crap shoot), then pertinent data can surface.
That said, ol’ chatbot sez that there is moderate, steady expansion into the marketplace with the Jamestown plant able to produce between 40 to over 100 engines per day should demand materialize.
Seems like fleets are gingerly embracing this pathway with significant uncertainty in the overall transportation world.
The upcoming California fuel ‘drama’ may play a role in all this should Cali diesel prices spike and/or scarcity manifest.
CNG is currently about half the price of diesel in the Golden State.
Should that spread widen, the economic incentives to seek alternatives will strengthen.
Benicia shuts down in a few weeks.
Interesting times.
Ovi,
Looking at these charts maybe a chart with 6 growers which includes China would be interesting. China has seen pretty steady growth since early 2019. Just something to consider, China’s C+C growth has been roughly similar to that of Canada from 2019 to 2025.
Australian Matt is really good at those sorts of graphs/articles:
https://crudeoilpeak.info/what-happened-to-crude-oil-production-after-the-first-peak-in-2005
However, even he is prone to extrapolating short term trends too readily, in the peak oil cause. Look at his comment about how China will slip to Group A (below its 2005 peak). In fact, it grew over the last few years, since his article, and is not “heading to Group A”.
Dennis
Interesting idea and I have noticed and commented on how Chinese production has grown. As noted in the post, I picked these five because the IEA and others have commented these are the countries with a lot of growth potential. Not sure why China was not included. Could be due to their main fields, Chanqqing and Daqing, are in decline. However clearly their exploration program has overcome that decline.
All time global high for Crude Oil, Coal, and Methane combustion.
Light a bonfire in celebration, Homo pyromancer.
For any one who is aware of the energy situation in the 1970’s, it is astounding to look now in 2026 and see that the world has all the oil it needs, at a price affordable enough to sustain over 8 billion people. And many of those people using very large quantities for entirely optional purposes.
Few in the 1970’s who were aware of the situation at that time would have believed such a thing was in the realm of possibility.
Will geothermal or fusion energy astound on the upside as well? I’d bet on the prospects of magma over plasma, if I was to spend a (un)stablecoin on such a wager. Its a much simpler goal to achieve, deploy and maintain.
Hickory
Oil, gas and coal do not sustain 8 billion people.
https://www.who.int/news-room/fact-sheets/detail/household-air-pollution-and-health
Americans have a really hard time understanding that they can use lots of everything because their currency is used as the global reserve currency. So you can print as much money as you like. Most other countries would have gone bust if they had the debt levels of the United States.
I could put up a graph of oil consumption per capita but it just means nothing to most Americans. You simply can’t imagine consuming less than 2 barrels of oil each per year.
Iver. I did not say the oil/gas/coal scenario was economically sustainable, healthy, or a good thing.
Simply pointing out that the energy provided has grown to a massive supply over the past 150 years, and the global population along with it. It would be extremely rare to find a human not dependent on combustion of these fuels for some major aspect of their survival- cement, metal tools, piped water, fertilizer (beyond manure from their family or animals they own), foodstuffs grown/transported/processed to the their market, cotton, and massive array of petrochemical products, for example.
Who is ready to go back to clay cookware, wool underwear, hauling water up from the creek, living only on local foods, heating derived only from wood you can get from close by?
Sure we can replace some of these products with more basic options, on a small scale. Deforestation only gets a voracious population to a relatively small population.
I was just trying to serve up a reminder of how far out on the limb of extreme energy dependency the worlds population has become.
Iver- on your point about energy use/capita
Yes indeed. In each country there are those who use much more than everyone else whether we are talking and USA or Nigeria, and yes many rich countries that use more than everyone else. Nonetheless there are billions of people who now can afford to use a lot. India is on the way to 500 million airline passengers/yr, for example.
In general, the more money a person or country has the more energy they consume. Global GDP is as high as it ever has been.
Iver,
Debt has little to do with energy consumption. Peak oil enthusiasts seem to feel that PO should have happened by now, and that somehow intangible debt markers substitute for physical energy. In fact, excessive government debt is primarily due to crony capitalism – in the US, republicans cut taxes when the economy is good, which is contrary to any sensible plan for the economy. It’s just the wealthy reducing their taxes: they’d rather get a treasury bill than an IRS bill.
This debt idea seems to come from the fact that oil importers can get into debt to exporters – the US used to be in that position, but it increased oil production. China could tell you that a better solution is to replace unreliable imported FF with reliable domestic renewables.
Hickory,
Again, when you refer to “energy” you are really referring to FF. FF is a very small part of overall energy resources. OTOH, renewable energy is highly scalable: 180,000 terawatts of solar insolation vs about 15 terawatts of human energy consumption.
Think of Germany: it prides itself on being a world leader in Science, Tech and Engineering. Do you really think that their plan to run their economy on renewable energy is going to be unrealistic?
Hickory
I never accused you of saying it is a good thing. Why don’t you just respond to what I wrote rather than replying to what I did not say. It makes for a more respectful conversation that can actually lead somewhere.
There is an incorrect narrative by some people that fossil fuels have lead to the population explosion. The global population increased to one billion in 1800 without using any gas and oil and practically no coal.
India population grew to 500 million without using any gas, a tiny amount of oil and very small amounts of coal.
What the fossil fuels have done is replaced billions of people working on the land with combine harvesters and tractors. These people moved into towns and got jobs in factories, offices, shops, schools, hospitals and everything else you can think of. Fossil fuels have allowed people to eat far too much and do no natural exercise. That why there are one billion obese people and three billion overweight.
Humans could have left most of the oil, coal and gas in the ground. Hydro electricity, wind power and tidal could have provided all our transportation and heating.
If all the vast wealth spent on wars and military, had been invested in quality housing, hydro power, electric trains and trams. Then people would have very low heating bills.
https://passipedia.org/basics/the_passive_house_-_historical_review
Anyone who thinks we can improve the world while spending $3 trillion on killing each other is delusional.
You need to understand we need cheap coal, oil and gas in order to spend the money it frees up on stupid and evil things.
https://newseu.cgtn.com/news/2025-05-06/The-French-city-occupied-by-one-WWII-side-and-flattened-by-the-other-1D3htgHwKWc/p.html
Multiply that destruction and death a million times over decades in Russia, China, Vietnam and there you see where we have wasted our chances of a clean pollution free world.
Oil consumption has hit record highs, so has coal and gas.
https://www.iea.org/data-and-statistics/charts/global-coal-consumption-2000-2026
Nick “FF is a very small part of overall energy resources”
certainly not applicable statement to ‘energy consumption’
global primary energy consumption for FF’s is well north of 80%
and its not changing fast
peak FF combustion will probably occur on July 27th 2033
but will still probably be over 80% of total energy supply at that time
Yeah, FF burning is at a peak – with a bit of luck it’s the last peak.
And yes, FF burning does account for most of human energy production, and that’s changing slowly. Far too slowly.
But! It’s important to be clear on two points:
First, the transition away from FF is slow primarily due to resistance to change from legacy industries. The oil industry, the coal industry…they’re both very powerful and they know they’re in existential danger. They’re fighting like mad – that’s a big part of the reason for the current presidency: the oil industry provided enormous funding for US Republicans. The US Republican Party is dedicated to fighting for FF and denying the risk of Climate Change.
Actually, renewables and EVs are doing surprisingly well: they’re both growing fast, and renewables are providing 80-90% of new generation. Given the resistance they face, this is like a dog walking on two legs: the surprising thing is not that it’s imperfect, it’s that it’s being done at all.
2nd, renewables are now more abundant, cheaper, faster, cleaner, more reliable, better than FF for most uses, and for energy overall. There is very little realistic danger that we’ll revert to biomass as a primary source of energy.
A final thought: there’s a real difference between human energy production and consumption. Humans consume a great more energy than the energy they produce. First, think about lighting: what percentage of light overall comes from sunlight? At least 50%, probably 90% around the world. We take sunlight for granted, but it’s real and it’s important.
Similarly, we think of space heating as what we do to control building temp variation caused by weather or day/night, but that’s a small variation around the edges. Really, solar heating keeps the Earth’s surface temperature about 500 F higher than it would be without the sun. Five hundred degrees! That makes the changes we achieve with HVAC seem pretty trivial: solar space heating provides at least 90% of the temperatures we enjoy.
But that’s just a fun thought, to help change your perspective on renewable energy. The important thing is to be clear that FF is NOT essential in the medium and long term.
Nick, a big part of the Peak Oil movement was confirmation bias. People who wanted FF to peak, therefore they predicted it would.
FWIW, I think you have a better chance with the peak demand, energy transition rap than the hardcore peak supply dudes do/did. (Caveat: the near term Ace-like stuff that TOD and Campbell and Deffeyes and Staniford were pushing. Yes…it will eventually peak.)
https://www.theguardian.com/commentisfree/2012/jul/02/peak-oil-we-we-wrong
“ confirmation bias. People who wanted FF to peak,”
I wouldn’t call it confirmation bias, because…it didn’t get much confirmation. It was just unrealistic pessimism. FWIW, my observation was that these were FF enthusiasts, who often rejected climate concerns. They were operating within a FF paradigm in which PO would necessarily be a disaster.
The pessimism may be related to the fact that 40% of Americans believe that there will be a religious apocalypse within their lifetime, and they believe that’s a good thing!. Given that 80% of Americans believe in guardian angels, it’s clear that religious concepts are very powerful, and so will be the concept of “end times”, even if people aren’t conscious of it.
OTOH, it’s pretty standard for people to identify trends in an industry which will create serious problems if nothing is done – one sees it pretty often in a wide range of industries and professions. Heck, many of them are correct and people respond and the problem gets fixed – think leaded gasoline and paint, Freon, mercury thermometers and Y2K.
“ a better chance with the peak demand, energy transition”
That would be good. It’s realistic, but it needs to accelerate and that means more popular understanding. The utilities understand it. The Chinese understand it, and they’re going to really hurt the US’ competitiveness unless the US wakes up.
Iver
For the record I have a point to make, since much of what you bring up is reasonable.
It has do with building infrastructure for the future. A lot of good suggestions can come up. When it comes to implementing it, you probably have to insert state instituted governance. That usually means more unpopular taxation. A strong state structure along with a lot of unpopularity regarding taxes and weak currency is where I come from. The only way we in northern Europe go into a severe recession is a curtailment of global trade. And that impacts everybody.
https://www.msn.com/en-us/news/world/ukraine-live-multiple-oil-tankers-struck-off-russian-coast/ar-AA1U69t1
Ukraine strikes multiple shadow fleet tankers in the Black Sea.
https://www.independent.co.uk/news/world/europe/ukraine-submarine-russia-black-sea-attack-b2885582.html
Ukraine is now employing underwater sea drones (one nailed a docked Russian submarine a couple weeks ago).
Assymetric warfar.e.
How do you stop an underwater sea drone that can pop up on your docked boat and blast a hole in it?
Especially a sitting duck oil tanker?
Has this changed the dynamics of modern sea warfare (and terrorism) as drones are cheap enough for radical groups to buy (I think)?
How do you hire a crew to get on a shadow fleet boat?
https://united24media.com/latest-news/germany-starts-blocking-russian-linked-shadow-fleet-tankers-in-baltic-and-north-seas-15053
Germany to block shadow fleet tankers
https://www.dailymail.co.uk/news/article-15455787/British-troops-follow-Trumps-lead-board-Russian-shadow-fleet-ships-carrying-sanctioned-oil-plans-considered-government.html
British Military considering boarding shadow fleet tankers
https://www.msn.com/en-us/politics/international-relations/france-seizes-suspected-russian-shadow-fleet-oil-tanker-in-the-mediterranean/ar-AA1UKTGU
France seizes shadow fleet tanker
https://www.tradewindsnews.com/tankers/us-blacklists-batch-of-shadow-fleet-vessels-as-trump-sends-armada-toward-iran/2-1-1933599?zephr_sso_ott=c0jgF9
US sends armada to Iran to take down shadow fleet vessels
This looks like a coordinated NATO effort.
https://market-ticker.org/akcs-www?post=254785
KD who founded an internet company (MCSNet) is highly qualified as a software development person.
Calls to short all AI LLM companies….they are 0’s.
Please see my AI post in the previous thread if this interests you as Michael Burry who shorted to US housing market in 2007 ( made a movie and book about ) has placed a BILLION dollar bet on shorting AI.
This affects everyone (in the US atleast but I suspect everyone) as US GDP and stock market growth is
AI
I’ve been reading MT for almost 15yrs I think. Jesus Christ could come down, cure cancer, make fusion power viable, solve world hunger and make peace all around the world and KD would find some reason to rant and condemn him to the gallows. That blowhard severely overestimates his intelligence on almost any subject.
Yet you have read him for 15 years..must be some value there?
Karl is really good at some stuff (finance, tech, legal) and mind baffling at others (peak oil denier, climate change denier ).
He loves science when it agrees with his personal biases.
And when science doesn’t he postulates conspiracy theories.
I listen to his strengths and avoid his weaknesses.
I have personally programmed AI and been baffled as to why people think we are close to “Agentic AI” conscious and intelligent programs/robots.
The algorithms (neural networks, linear regression, decision trees, clustering ).
very obviously cannot do this and have been around since the 1970s (or before).
It is Tulip Mania but this time with the science fiction myth (with current technology) that we are anywhere near sentient robots/machines.
All layers of the AI value chain are unprofitable
The more customers (that you lose money on) you add the more expensive it gets.
Yet 100’s of billions are being poured into a scientific fantasy by companies (Tesla, OpenAi, Nvidia, Google, Microsoft etc etc) that should know better and investors that are caught up in mass delusion.
If an Ai Chat bot ingests false information it has no way of knowing that it did. And will behave as if it were true. There is a ALOT of false information on the internet.
AI can only be profitable if it replaces humans as workers.
AI is super fun, super exciting and a guaranteed LOSE-LOSE
If you achieve agentic AI you will destroy the economy as a high percentage of the world loses their job.
thankfully, “Agentic AI” looks like a myth at the moment.
If you don’t achieve “Agentic AI” you will get a 10x dot com bubble burst due to 100 of billions being invested in a ~0 profit industry.
We are investing in destroying ourselves.
Are humans smarter thant YEAST?
https://www.youtube.com/watch?v=74llRj71REQ
Elon Musk says AI will perform surgery better than surgeons in 3 years;
And people shouldn’t plan for retirement because we won’t need money in 20 years.
Remember, Elon said he knows Trump is a pedophile, and now has rejoined Trump’s team and promoting Trump!!
Elon doesn’t have to do this (it’s very creepy) as the richest man on the planet he could play it safe and maintain that position
Can this guy be trusted?
It is an obvious no from me.
It’s Tulip Mania this time with
super entertaining science fiction fantasy that is not reality with current technology and has proven via undeniable evidence, to be unprofitable
Andre, my wife is a Big Boss in private equity that specializes in software companies. So I get to vicariously live through the dozens of software companies that they own and operate at any given time. They are all using AI – from engineers writing code to HR to administration, etc. Hell, my wife even uses chatgpt as her personal wardrobe advisor and interior decorator exclusively. I’m an engineer but frankly I’m too lazy to learn to use it optimally and I don’t need to for my economic well-being, I guess I’m getting old. Though I do spend my professional time these days building powerplants for all these data centers.
Is it a bubble? Probably. Is there going to be a consolidation? Probably, some companies won’t survive. But to say it’s a zero is stupid and just one of KDs typical blowhard rants. He’s proclaimed the death of basically every industry at some point over the years. Remember his call that health insurers were going to zero when Obamacare passed? Still waiting. He’s so absolutist in his arguments that any of his proposed ideas are worthless.
I treat him as an old man howling at the moon. Entertaining to read but that’s about it, though now you have to sign up to read most of his complete posts and I won’t be doing that.
“But to say it’s a zero is stupid”
Agreed.
OpenAI charges 200 a month for their service for an individual.
They have invested 1 trillion in data centers (how stupid can you be?) , and need 2000 a month to break even.
I use LLMs, but I wouldn’t pay 2000 a month to use one or 200 when there are free alternatives or my employer was paying for it.
https://www.nbcnews.com/business/business-news/openais-sam-altman-backtracks-cfos-government-backstop-talk-rcna242447
Sam Altman recently requested the government backstop their investment (never a good sign)
LLMs have a utility no doubt, but they aren’t profitable so far anyway.
I don’t know, the article you linked specifically says Altman was NOT requesting a government backstop.
People will pay money for AI access at some point, they’ll have no choice. It’ll be just like the Internet and smartphones where it’s almost impossible to function in society without access to it – that’ll be by design of course. The companies I work with already all have corporate chatgpt accounts and have integrated AI tools into their powerplant design process.
Just yesterday I was running design documents through an AI tool that churned through the entire EPC contract and compared contract requirements to the design specifications and spit out any discrepancies or missing tech requirements it found between the two. We are required to do this on every piece of equipment for the entire powerplant, even something simple like substation unit transformers. It actually worked pretty good and found some stuff I would have missed even with intimate knowledge of the EPC and tech specs.
Good point. It was the CFO that said it (even worse??) and backtracked it.
These numbers do not look good to me.
“OpenAI CEO Sam Altman says the company has no plans to seek a government backstop for its $1 trillion worth of data center investments”
Looming behind the reassurance is the question of how OpenAI plans to make good on the $1.4 trillion in commitments it has made to build out AI infrastructure. In September, Friar told CNBC that OpenAI expected to generate approximately $13 billion in revenue this year, raising concerns about its financial trajectory.
LLM’s are useful, but they have to replace the workers that are using them to be profitable.
They have demonstrated so far they need to be fact checked at a minimum.
Thanks LNGuy I appreciate your perspective.
Tell your fav AI that smoking cannabis makes you anxious and ask if Xanax is ok to use to reduce it.
Tell your fav AI that you’ve stopped taking your meds and you feel like you’re thinking more clearly now and wonder if it’s ok to stop all together.
Product liability laws will bankrupt AI. So there won’t be any product liability laws for AI.
Enjoy your surgery.
I’m surprised Musk’s plane hasn’t crashed yet.
Or defamation of character lawsuits……
Or ingesting and training on copyrighted material…
Big Andre!
I find LLMs to be tremendous productivity enhancers. I used it recently to write a script to download and organize data which would have taken me several weeks by hand. It took – including trouble shooting – 3-4 hours. I think that one of the reasons why hiring rates are so low is that individuals are increasing productivity by using them. And that doesn’t show up in aggregate numbers aside from low hiring numbers. So my guess is that the productivity gains attributable to AI are grossly understated. Key is to use it in a way that optimizes its capability and not just like a search engine.
rgds WP
LLMs are very good at text and pictures.
They are not good at differentiating fact from fiction. Neural Networks are just probabilistic pattern matchers.
Text and pictures are relatively stable patterns.
Helpful and profitable are 2 different things.
The Data Centers are massive cash furnaces and who is going to
pay 2000 a month (OpenAI breakeven) for a subscription (or even 200 Open.AI current ask)
Unless LLMs (ChatGPT,etc) replace human workers they are unprofitable.
And if they replace human workers..who is going to buy the products the companies make.
“Agentic AI” is fun to think about but a LOSE-LOSE for humanity.
“ They are not good at differentiating fact from fiction”
Sadly, that’s also true of humans…
Quote from Hart, regarding Venezuela:
Without an investment upwards of $50 billion, the world’s largest oil reserve is nothing more than a geological museum where the wealth is infinite but the value is zero.
Yep. For this president, Venezuela is nothing but political theatre. Like Greenland, it’s a massive distraction from domestic problems.
You have extra heavy oil that requires processing. And a miserable security environment where you risk having your investment stolen even after fixing things. And probably shakedowns while there.
There is some installed equipment. So not a greenfield. But bad condition.
CVX may do something since they are the only one that still has some assets there. The others need to have their investments guaranteed, by the USA, or they won’t enter.
Venezuela’s long-term corruption, violence and hostility towards the US is only part of the problem. A large part of the problem is the US. We have the instability of the current president, as well as the instability of the current congress, which may change completely in just one year.
Very, very few people are going to trust guarantees from the current US federal government.
Heck, the reputation of the US has been harmed for more than the short term. It will take quite a bit for people to trust the US again.
50 billion is nothing to the government.
They can easily subsidize that development and I think that is what Big OIl is looking for.
Privatize the profits, Publicize the losses and risk.
Andre —
Trump has to conquer Venezuela first. I’m not holding my breath.
Alim,
Some form of boots on the ground will be needed. Good point.
I am not saying I want that, I don’t support Trump.
But if he wants this to work, it will require it.
Trump requested a 1.5 trillion budget for the military.
( 1.5 trillion military, 2.8 tillion medicare+medicaid (growing at 9% per year), 1 trillion social security,
1 trillion interest = 6.5 trillion )
50 billion is nothing.
one note about the uniqueness of Vz heavy oil and jet fuel,
the US used to be dominating jet fuel producer, link here is probably data in 2022/2021.
https://unstats.un.org/unsd/energystats/pubs/yearbook/2021/t21.pdf
Before 2019, China had to import some jet fuel, and jet fuel production is lower than Singapore.
But from 2022 to 2024, China had an annual compound growth of 35% in jet fuel production, latest number in 2025 is already over 2MBOPD, very close to US jet fuel production with over 30% exported.
Sheng:
I don’t always understand you. Why juxtapose Vz crude with growth in kerosene production? Vz crude is cheap, but I don’t see it as some magic source for kerosene. My understanding is that lighter crude (e.g. WTI or even medium sours) have a higher kerosene cut than WCS (heavy sour).
China is growing its merchant refining sector in general. And also refineries optimize to supply the regional market. And the demand for jet in Asia is still growing strongly (more so than the US/LATAM). So, OK. Good for China.
Trump and Milei want to do experiments in the socialist LATAM countries — pure political aspect.
Vz crude is good for diesel and jet fuel, and cheap while shale oil has been classified as no good for diesel by shale bashers, therefore more profit and more strategic importance for Vz takeover.
US used to export lots of jet fuel, and this need more naphthelene rich feedstock, and because Vz heavy are both lacustrine sourced (quite a few geologists still argue Orinoco is marine), and most likely Mexico heavy as well (like ultra-deep^2 GOM/A), they are ideal for jet fuel but both are disappearing from US refineries; while Canadian oil sands is marine sourced and less naphthelene.
About the GOM/A, the US side close to LA/E TX has been predominately gas, until going into deeper water + ultra deep (UD^2). The W TX to Mexico UD^2 start to get gassy, and yet still quite more oil than shallow GOM/A part. So, it is my conjecture that the Maya field is the higher maturity saline lacustrine source rock in the Mexico direction that migrate to shallow part and form heavy oil like Orinoco.
Continental has one rig on the ND list and I read a story on oil price.com that Hamm says they are stacking it.
29 rigs running in ND, two drilling SWD wells.
Does Continental have anything going in the Permian? As I recall they were primarily in the Bakken and OK.
I think they are in Argentina…
Here is a news story:
https://boereport.com/2026/01/16/harold-hamm-set-to-halt-bakken-drilling-margins-are-basically-gone-bloomberg-news/
FWIW, I’m not sure how you look it up. I don’t think BH gives the breakout by company.
CLR does have holdings in OK, which might be drillable based on natty prices. They also have a position in WY and in the Permian. Not sure that either of the latter is super productive. But they might still have rigs for HBP or even just from remnant contracts, that haven’t run out.
P.s. I wanted to ask you a stripper well question.
Nony,
If you want to ask a question of Shallow Sand, then ask it, perhaps he will answer the question if he knows both the question and the answer.
Venezuela
The reality is that there are guys who are willing and able to go into Venezuela. One is Bill Armstrong, who found the Pikka Field on the N. Slope of Alaska. Another is Jeffery Hildebrand, head of Hilcorp, which runs Prudhoe Bay, as well as the old San Juan Basin in the Four Corners. And the third is Rod Lewis, who drilled a whole bunch of wells in Mexico, surrounded by drug cartels that were cordoned off by a small army. Then, of course, there’s Chevron, which has been steadily working the territory.
This bunch won’t need a subsidy, just an army to protect their workers. I’m not saying I’m a big fan of this, but it is almost certainly going to happen.
And that oil, with API gravity roughly the same as refrigerated molasses (7-8) and a high enough sulfur content to create corrosion in the best pipe, will find a welcome home at the Chevron, Marathon and Valero refineries, which can handle that stuff all day long. Heck, the big Chevron refinery at Pascagoula was built to specifications with Venezuelan oil in mind. Even at discounted rates, it’s going to be an immensely profitable situation for all. But especially for Chevron.
Nice one Gerry.
Trump has committed. He is going to look like an idiot if Big Oil doesn’t get in there and produce the Oil.
Big Oil isn’t dumb, put the 50 billion capital expense and any risks and potential losses on Uncle Sam,
Big Oil will take the profits.
You could see that by how the Exxon Ceo approximately said “We’ve been there 2 times before we are going to need some things to “change” to go in there again.”
Dr Maddoux,
At under $60/b for WTI and Venezuelan oil likely at under $50/bo, it doesn’t seem likely that these oil companies will be very interested in investing in Venezuela with the additional expense of a private army, profits would be zero or less under those conditions, it would seem.
Not clear many people in the US would like to waste our blood and treasure to suppport military intervention in order to line the pockets of oil billionaires.
Rig Report for the Week Ending January 16
The rig count drop that started in early April 2025 when 450 rigs were operating rose this week. Drilling continues at a steady rate with WTI below $60/b.
– US Hz oil rigs rose by 1 to 365, down 88 since April 2025 when it was 450. It was also up 3 from the low of 362 first reached in the week ending August 1. The rig count is down 19% since April 2925.
– New Mexico Permian rose by 1 to 92. Lea dropped by 1 to 59 while Eddy rose by 2 to 33.
– Texas dropped by 1 to 167. Texas Permian dropped by 2 to 131. Midland dropped 2 rigs to 23 and Martin dropped 1 to 25. Loving was steady at 17 while Reeves dropped 1 to 11.
– Eagle Ford added 1 to 29.
– NG Hz rigs dropped 1 to 108.
A Rig
Frac Spread Report for the Week Ending January 16
The frac spread count rose by 4 to 160. From one year ago, it is down by 28 spreads and is down by 55 since March 28.
A Frac
DC, I don’t think protection will be provided by a private army, but one run/overseen by U.S. forces, and also believe that all of those corrupt “taxes” to Venezuelan government will be dissolved, if Americans develop the oil fields. The U.S. government previously had to get harsh with Maduro over neighboring Guyana where Exxon is working, over which the Venezuelan government tried to assert ownership rights, so between Guyana and Venezuela, there’s now a larger reason for control. Heck, it wasn’t that long ago that Venezuela tried to exert “sovereignty” over the oil-rich sector of Guyana.
Like I said, I’m not a fan of this tactic but I believe I am beginning to understand it. This was a two-pronged decision: 1) to divert Venezuelan oil away from the shadow fleet taking it to China and Cuba, and 2) to secure enough heavy sour oil to blend with LTO at the Gulf Coast refineries, and, if push comes to shove (read, war), to produce it at a high enough level to remain “energy independent” in a very complex, dangerous world.
I don’t like all this “take it if you can” philosophy. However, this is the way I see the world going. Somebody finally told the president that the shale fields are faltering, but that we have plenty of oil on the American continent. And then someone else pointed out that much of that oil used to be transported to Cuba, a communist state close by, and to China, which is running all sorts of exercises in the S. China Sea. The result is a bellicose, preemptive series of reactions: the “Donroe Doctrine.”
“Somebody finally told the president that the shale fields are faltering, but that we have plenty of oil on the American continent”
As I have pointed out on this site previously, a few times, and have seen no one on the internet make this connection.
Trumps first Secretary of Defense was General Jim Mattis.
https://peakoil.net/non-renewable/us-military-warns-oil-output-may-dip-causing-massive-shortages-by-2015/
“By 2012, surplus oil production capacity could entirely disappear, and as early as 2015, the shortfall in output could reach nearly 10 million barrels per day,” says the report, which has a foreword by a senior commander, General James N Mattis.
Does anyone think General Mattis forgot to mention this to Trump?
And Trump would see $$ signs in his eyes
The prediction was wrong…but that was what the General was thinking at the time documented.
Paper:
https://apps.dtic.mil/sti/tr/pdf/ADA518100.pdf
Actually a pretty good document overall, Read the FORWARD and then search for PEAK OIL
Dr Maddox,
From my perspective this seems even less well planned than the Iraq episode in 2003 and that did not go well after the initial assault. My guess is that things will not go well in Venezuela if the US decides the US military will provide security for oil companies and the US taxpayer will pay the bill.
Pretty sure this is not what the MAGA faithful signed up for.
It probably was less planned, but it was also a much smaller operation. And we don’t have boots on the ground. I am in agreement that VZ won’t turn into some liberal capitalist democracy. But if we just changed one thug for another that’s actually less damage than provoking a civil war like in Libya or Iraq. And definitely not as bad as Iraq or Afghanistan with massive expenditures as well as some American lives lost.
Note: I’m not saying I’m down with it. I’m not. Just don’t let recency bias cause you to exaggerate.
Anony,
I agree – the smaller the better. I strongly suspect this is just theatre, in which case the president would normally just declare victory and move on.
I’m starting to worry that he didn’t get the bump in approval from the V maneuver that he expected, which is why he pivoted to Greenland.
He’s like a 7 year old with a big hammer in a china shop, smashing things until he gets his parents’ attention.
Nony,
No idea what will happen. Just know the US has done a poor job of regime change in general, there are many examples in history, statistically many more bad results than good results since WW2. Perhaps that changes because Trump is such a genius surrounded by a very capable cabinet. 🙂
The point is that nothing changes in Venezuela without boots on the ground. At present we have traded one thug for another and claims by Trump that he is in charge are specious at best.
“ we have plenty of oil on the American continent.”
I think you’ve correctly identified the craziness. Crazy on so many levels:
-There is no American continent: S. America is a different continent;
-the people who live in that continent really, really don’t want what they see as more colonialism – if this president were a paid Chinese agent he couldn’t do a better job of promoting China in S. America and elsewhere;
-the US is an exporter, and Canadian oil is far more secure than oil in another continent with ocean transport required
-if Americans really want Energy Independence they shouldn’t rely on imports, even from Canada – oil prices are set on the world market, and imports drain US income & wealth and make it vulnerable;
-if Americans want t to prepare for war they should eliminate most oil consumption by electrifying with domestic electricity. That’s what China and Germany are doing. It’s what the rest of the world is doing, and the US is being left behind…
Guess that does read sort of funny.
Western Hemisphere, how’s that?
Preparing for war really worked out well for Germany the last couple times.
Thanks for that helpful tidbit; I’ll pass it along.
“Guess that does read sort of funny. Western Hemisphere, how’s that?”
Better, but the original captures the feeling of this president’s perceptions. He’s like the old joke about how cats look around them and say “Everything here is mine”.
“Preparing for war really worked out well for Germany the last couple times.”
Making your energy supply cheaper and more resilient only makes everyone safer. It prevents economic tensions and reduces the chances of resource wars. It’s nothing like invading Poland…or Venezuela.
oil wars:
90 BW Oil War The gulf wars were widely understood to be oil wars. Here’s a cover from Businessweek
Yawn…kinda reminds me of that Hirsch Report. Pompous and semi official. And colossally wrong.
“Hirsch… colossally wrong.”
I agree – Hirsch badly overestimated how hard it would be to replace FF. He didn’t even mention EVs, even though commercial versions existed at the time of his report.
OTOH, he was correct that planning and R&D was needed for the transition away from FF. PLanning ahead is usualy cheaper and easier than reacting to events.
A huge increase in LNG projects is underway.
https://www.iea.org/reports/gas-2025/executive-summary
This will have two benefits, it will reduce energy costs in Europe and hopefully increase the price of gas in producing countries so flaring can stop.
People like Nick G who know nothing about energy say wind and solar are so cheap. Yet they can’t explain why coal consumption is at global high.
Or why oil consumption is hitting record levels.
It really is quite simple, if you can dig coal out of the ground and sell it for a profit then millions of people will do just that.
But that fact is toooo simple for pseudo intellectual minds.
Piped natural gas is usually much cheaper and more energy efficient. If peace breaks out in a couple year, Europe may go back to Russian piped gas. They are the ideal market and Russia is the ideal supplier. Much cheaper to get Russian piped gas than LNG.
I doubt the UKR war lasts for more than 2-3 years more. I suspect we will have a freeze at the line of contact at that time. Russia not accomplishing all their war objectives. E.g. I don’t think they can cross the Dnipro River and take Kherson, which they claim. Similarly UKR will not be able to drive back to 2022 or 2014 borders. Both sides will finally just call a halt in sort of a “Korean solution”. Europe will not want to make territorial concessions (more than the line of contact) and will use dropping of sanctions as a bargaining chip instead.
Anon
You could be right but most European countries will never trust Russia again.
We will continue to build expensive wind, solar and battery storage to reduce need for natural gas. The rest can be imported as now via LNG.
We now know if we rely on Russia to heat our homes we are in a very vulnerable position.
Sounds like a great plan. Enjoy the loss of your chemical industry.
https://x.com/MOAR_Drilling/status/1567334043795988480
Anony,
There is a simple solution to saving the European chemical industry: give them a subsidy to compensate for the extra cost of LNG. If the chemical industry is worth saving, it’s a simple choice. Probably cheaper than the security cost of dependency on Russia.
“ People…say wind and solar are so cheap. Yet they can’t explain why coal consumption is at global high.”
It’s easy to explain: coal and oil were here first, because the tech needed to burn them was easier to develop than PV and wind turbines. PV & wind became cheaper relatively recently, but…they are cheaper now, and they’re the great majority of new generation. They’re still growing fast, and started replacing coal and gas…last year!
“It really is quite simple, if you can dig coal out of the ground and sell it for a profit then millions of people will do just that.”
Sure. Until something else is cheaper, and the profit disappears. US coal production and consumption have dropped in half. That’s starting to happen in the rest of the world.
Have you noticed that the primary markets for NG all have as national goals cutting NG consumption in half in just a few years?
Nick G another left wing ignoramous
Who hates any bit of truth that does not fit his created reality.
Why has coal consumption gone down in the U.K. not because liars say wind is cheaper. It is because left wing politicians have banned coal fired electricity.
Replaced by wind and our bills have gone up 200% in the last 15 years.
Why has India coal consumption gone up by 800 million tonnes during the same time cos the government has not banned people making a profit.
Why has China coal consumption gone up by 1 billion tonnes in that time cos China knows cheap coal and cheap electricity are the backbone of their industrial production.
https://www.endfuelpoverty.org.uk/4950-excess-winter-deaths-caused-by-cold-homes-last-winter/
Hope you are proud of what ignorant fools are doing
“How Venezuela’s Oil Comeback Would Undermine Global Climate Goals…Venezuelan heavy crude is among the most carbon-intensive oil in the world, posing severe risks to global climate targets….Increased output could consume a significant share of the remaining global carbon budget, ….A study by S&P Global Platts Analytics found that Venezuela’s Orinoco Belt deposits have by far the highest carbon intensity of any major oil region, at around 1,000 times higher than crude produced from Norway’s Johan Sverdrup field.”
https://oilprice.com/The-Environment/Global-Warming/How-Venezuelas-Oil-Comeback-Would-Undermine-Global-Climate-Goals.html
With or without uptick in Venez oil production you can bet on a world getting hotter and hotter, with areas of severe chronic water shortage and episodes of massive deluge/flooding. Methane is a big part of this story as well.
“The trend for air conditioning units worldwide shows massive growth, driven by climate change and rising incomes, with current numbers around 2-2.4 billion units expected to hit 5.6 billion by 2050”
One word- Copper.
Its takes a lot of copper to adapt, to counteract.
Oh Hickory Hickory
Meeting any of the targets now is impossible
https://www.unep.org/resources/emissions-gap-report-2024
I have said for years, global CO2 emissions needed to start going down from 2010 at the latest to prevent the permafrost regions of the world from melting.
They are already adding to global warming.
Also deforestation needed to be at net zero by now.
https://tyndall.ac.uk/news/global-co2-emissions-from-forest-fires-increase-by-60-per-cent/
Hope springs eternal but it should not face reality.
Most people have accidents because they fail to see the danger. How anyone can think we can cut emissions by 40% in 5 years. No hope in hell.
there is a price tag for “net-zero” higher than “not going net-zero”
https://oilprice.com/Energy/Energy-General/The-Staggering-76-Trillion-Price-Tag-of-Britains-Net-Zero-Ambition.html
The above parallel story by oilprice.com probably was written by AI chatbot confused with all the unit conversions in oil and gas industry, like using M as million.
Sheng Wu
The government estimate is so absurd one does not know whether to laugh or cry.
The average cost of installing a heat pump system is £12,000.
That’s your £120 billion just to covert one million homes and there are 25 million homes in the U.K.
Who knows how much it would cost to convert all the buses and HGV lorries.
We are between a rock and a hard place, everyone is.
Correction
ten million homes would cost 120 billion to convert to heat pumps. Then we have all the shops, offices, schools, hospitals and factories to consider.
The point of that article is that Venez oil industry uptick and cumulative production over the next decades is going to add considerably to the heat budget of the earth…regardless of anyones aspiration to the contrary.
I harbor no illusion about the behavior of humanity-
Its take what you can, burn what you can.
The idea that an American invasion of Venezuela — if it ever happens — would increase oil production there seems pretty far fetched. It took Iraq a quarter of a century to get back to its pre-invasion output levels.
More realistically, the current American policy of bombing fishing boats (are they still doing that?) and high jacking oil tankers doesn’t seems likely to promote trade of anything.
Trump is doing to the Caribbean what Putin did to the Black Sea. War suppresses trade. That’s why container ships from China go all the way around Europe to Petersburg to deliver cargo to Russia.
Why call it natural gas? Whats wrong with ‘swamp gas’? Is there unnatural gas?
I guess we could apply the naming standard to other things like ‘natural carrots’ or ‘natural thought’.
Is it natural for an animal to use fire as a tool?
It’s in contrast to coal gas (a mixture of CO/H2/CH4, produced by heating coal, used prior to the natural gas industry). The wording “natural” emphasize that it is extracted directly rather than coming from a chemical process. It is “natural” not in some tree hugger sense but natural in the sense that it is not manufactured, but extracted.
Sheng Wu:
1. To make paras, hit the return button twice, to create a full line break in between.
2. I still don’t understand your posts. It’s like you’re talking to different people in the same post. (Trump adventure topic mixed in with jet fuel talk.)
3. Kerosene/jet comes off in between gasoline and diesel. I get differing info trying to research which is better for jet, but in general, it seems like WTI is better. In addition to the distillation yield, you don’t have to clean it up as much.
4. Shale skeptics and peak oilers have said a lot of nutty things about WTI being no good. But the bottom line is light sweet sells at a PREMIUM to heavy sour.
https://discoveryalert.com.au/global-energy-market-shifts-strategic-pricing-2026/
5. China likes the Vz cargos because they are opportunistically cheap. Not because they are a superior refinery input. It’s like getting a cheap hooker versus an expensive call girl. It’s not that they like the uglier one. But they can deal with it and it’s cheaper. But if prices were equal, they would go pretty, not ugly.
6. The shale h8ers should not be listened to, too much. They have been drastically wrong about the whole quality worries. LTO sells at a premium. And the market has absorbed US growth readily.
https://archive.ph/Os4XW
Anonymous,
I agree with your points,
#1, doing that, just stretch longer
#2. there are several aspects really come across in Vz and LATAM — NB prize aspiration coupled with social experiments, adding opportunity in cheap Orinoco crude with more refinery outputs, i.e. Trump has more $$ logic than just NB prize momentum driven?
#3. I am just trying to argue that compared to Canadian marine sourced heavy oil/bitumen, Orinoco has more value in refineries. I am not trying to argue that the market premium for WTI is wrong.
#4,#5,#6. pretty close on the same page.
just write up a post here,
https://www.linkedin.com/pulse/orinoco-oil-rare-earth-crude-sheng-wu-eta1c
and when the main media put “billions $$ to restart Orinoco”, they did not tell you it is much smaller compared to other oil fields, and the return is also not mentioned. Like the “net-zero” cost was underestimated by orders of magnitude, and the positive output of “carbon driven industrialization” was not mentioned.
Thanks for the paras. 😉
I still have a hard time understanding you. Sometimes you say something, noting a couple factors or the like, but without making a clear statement of the import. I’m not sure if you are making an assertion or not. It feels sort of “not even wrong” in that I don’t have a falsifiable, clearly labeled hypothesis.
VZ and CA crudes are much more similar to each other than they are to light sweet crudes. I’m not sure what the import is of dwelling on these small differences within heavy crudes. I think the difference of 17 API, 4% S (after dilution) to 40 API and almost no S is way bigger than waxing on about the saturated or unsaturated monster-looking polycyclic molecules.
In both extraction and in usage, there are probably way more lessons learned to take from CA to VZ oil than there are profound differences. And yes…viscosity blablabla. Heck, even within each deposit, there are many differences that dwarf the differences between them…after all API varies, flowability varies within the deposits!
Even the difference of light sweet versus heavier stock is overemphasized at times. I was at a refinery that stopped running Persian Gulf medium sour (28 API, 3% S) to run literal WTI (39 API, 0.2% S…sourced from Midland, not Cushing), purely to take advantage of the price arbitrage. Before the export restrictions were lifted, it was like printing money! Yeah…we had some foaming issues and pipes shaking in the preheater…but an extra $5 of crack spread can make you fine with the maintenance manager whining.
And I’m not sure why you obsess on the jet/kerosene production. Yeah, it’s a premium product. And yes, regionally Asia has a growing demand for jet (long distances, oceans, and Chinese living outside China). But it’s still just one of the three premium products. And usually less than gasoline or diesel, on a volume basis. And really refiners are doing a linear optimization with various constraints. It’s not like you can go jet only…or that Vz crude makes jet only! They try to get “everything except for the squeal” from the barrel of crude, just like butchering a hog, where you have choice cuts and lesser cuts, but consume it all.
I would bet money that the attraction of the VZ crude is much more for cost than it is for chemistry. It’s an uglier but cheaper pig to buy.
I guess Islandboy got bored of saying every month from 2015 that China’s coal industry was soon to become hundreds of stranded assets.
https://oilprice.com/Latest-Energy-News/World-News/Chinas-Coal-Output-Hits-Record-High-Even-as-Coal-Fired-Power-Declines.html
Island boy, what you wanting with your fossil fueled world?
https://www.youtube.com/watch?v=xpRZZmB9zB0
Oddly enough, the article says the reverse: China is still building coal generating plants even as coal generation output declines, replaced by solar and wind.
Provincial governments have been building coal generation because it provides jobs. Capacity factors for coal in China have been dropping sharply for years, due to overbuilding and relatively slow growth in demand for coal. The last time I checked it was below 50%. On the other hand, China has been closing older, less efficient coal plants, in part to reduce pollution. Those closures tend to not be included when people report breathlessly on new plant construction.
Still, most of the recently built plants will be badly underutilized, and more and more coal plants will be shut down well before their normal economic lifespan.
In other words – stranded assets.
China is replacing old coal fired power plants with more efficient and cleaner higher temperature/pressure versions, there were over 70% old power plants needs to be updated.
China still have to figure out cleaner better way to keep countryside residence warm in winter without individual home coal-burning stoves — the largest pollution source so far.
Sheng Wu,
Perhaps heat pumps and passive solar along with better home sealing and more insulation in homes to reduce energy use for home heating. Propane, natural gas, or electric for cooking.
Induction cook tops are ridiculously cheap – that’s a no-brainer. Insulation is pretty cheap. Windows come next.
China was a pioneer in solar building design, even thousands of years ago, but that’s usually hard to retrofit.
Heat pumps can be small – if properly sized they can be relatively inexpensive, but that’s the very last step.
As I have mentioned before, many new Chinese coal plants are also much more flexible than traditional plants. The idea was originally developed in Germany but is rarely used because coal is in decline there.
They grind the coal to dust in advance and store it in silos. Also they dry it using waste heat from the plant, greatly improving efficiency. This makes the plants viable as peaker plants, supplanting gas in that role. That may explain why the keep building despite the low capacity factor.
Also there is some province level politics going on. For example Yunnan province has made what seems like a massive overinvestment in coal plants for some reason.
Nick G
What you appear to be hell bent on not understanding is the variability of wind and solar.
In China solar power can go from 70% of installed capacity to zero. Did you know that?
And wind can go from 40% of installed capacity to 1%.
That means the coal plants are needed to prevent regular blackouts. It is nothing to do with utilisation it is to do with grid stability.
Blackouts cost vast amounts of money far more than keeping power plants going.
“ In China solar power can go from 70% of installed capacity to zero. Did you know that?”
Of course – it’s called night. Everyone knows about it. OTOH, the sun is extremely reliable: it always comes up the next morning. It’s easy plan around, and grid managers have been doing that for demand cycles forever.
There are a wide range of techniques for dealing with this, including storage, diversity of supply, geographic diversity & transmission, over building, etc.
Both Germany and China have committed to getting to net-zero. They both pride themselves on their science, technology and engineering expertise. Do you really believe they don’t know what they’re doing?
How Hertz lost $billions, betting on electric car hype:
https://archive.ph/BcBTx
yes, that’s the time when peak-oil and renewable EVs were at their peak.
I drove one model 3 from Hertz made in Shanghai all the way to an oil rig half way cross the continent, saved quite some fuel $$, amazing Tesla could still have it charged in Oklahoma
https://www.rionegro.com.ar/energia/rio-negro-tiene-un-pozo-record-en-vaca-muerta/
Vaca Muerta drilling more prolific wells in the Low-GOR and API Black Shale Oil block — previously ruled out as impossible, and not to mention any shale oil possible in Rio Negro province.
They dare not mention that half of the other best wells are also similar or lower API&GOR wells.
This happened in Shengli/Bohai China as well.
https://www.linkedin.com/pulse/new-record-low-gorapi-shale-oil-sheng-wu-gx2hc
Anonymous,
there is possibly more story behind this heavy shale oil and the heavy Orinoco oil.
When the GOR and API are low, and composition is right, the heavy oil underground could form “foamy oil” and produce better than low viscosity fluids, as if the foam just expands freely while to the wellhead. This foamy fluid will easily separate into liquid and gas for light oil with high GOR.
In Canada, such heavy reservoirs are limited, but in Vz Orinoco there are quite a portion.
A good portion of Orinoco oil is actually buried over 100meters, and therefore they do have quite some dissolved gas under pressure. In fact, Venezuela has a 6TCM gas reserve, ranking #9/#10 in the world. Not sure if this is associated gas or free gas reservoir — lots of unclear reports.
https://www.linkedin.com/posts/andrew-pepper-19663312_venezuela-lots-of-talk-about-venezuelan-activity-7419117432281329664-iNXl?utm_source=social_share_send&utm_medium=member_desktop_web&rcm=ACoAACGpq74BW3kSlu8JO2oAxGMPrstponMcpAI
Andy’s results are toooo old with limited Orinoco data points, but still shows the trend that heavier is actually more productive in Vz, or as Andy put it “there is no clear correlation between recovery factor and API gravity”.
summary of my point: the cost is also lower here in Orinoco probably, with higher EUR
https://oilprice.com/Energy/Crude-Oil/Venezuelas-Oil-Reset-Has-Finally-Begun.html
just checked the local crude prices for Bohai heavy, and it is quite close to Brent, or even higher than WTI. So, the Chinese refineries are probably taking Vz heavy crude at a discount larger than Russia crude to India! and probably prepaid with investment/equipment and other goods.
No wonder Trump claiming “take back US crude”.
https://oilprice.com/Latest-Energy-News/World-News/Chevron-Led-Tengiz-Oilfield-Offline-for-Another-Week-After-Fire.html
Also, this Tengiz field is probably like the Kashagan (Cash Gone) field, with high Sulfur at high pressure and GOR (1.5MCF/bbl, like Permian), and much harder to deal with than the high sulfur but low GOR and low pressure Orinoco.
here is a good comparison of the 3 major heavy oil super basins 3P oil and gas reserves,
WCSB, heavy oil (majority oil sand) 171 Billion Barrels, gas (2/3 tight gas) at ~1,000TCF, GOR ~6MCF/bbl, and production GOR is about 6MCF/bbl too
Venezueal, heavy oil 300 Billion Barrels, gas (majority associated gas) at 300TCF, GOR~ 0.6MCF/bbl
China Bohai Bay, heavy oil 22 Billion Barrels, gas (majority gas condensate reservoirs) at 7.2TCF, GOR~ 0.3MCF/bbl, and production GOR is about 0.6MCF/bbl
the US GOM ultra-deep production GOR is fast approaching 0.6MCF/bbl
I used to think peak oil was really important.
After 20 years of seeing increased production of oil, coal and gas. It is obvious that peak food and fresh water are the real concerns
https://www.theguardian.com/environment/ng-interactive/2025/dec/18/how-climate-breakdown-is-putting-the-worlds-food-in-peril-in-maps-and-charts?CMP=Share_AndroidApp_Other
If we have any problems with oil supply it will be due to someone like Putin starting a war.
Coherent thought per capita peaked many decades ago.
Hickory,
Per capita demand peaked, due to good planning. 10MPG vehicles are just nuts.
The CAFE program started under a Republican president – hard to imagine now…
A glimpse of the big future in energy-
https://docs.nrel.gov/docs/fy26osti/91898.pdf
https://cleantechnica.com/2026/01/19/2025-us-geothermal-market-report-documents-industry-growth/
Drillers and turbine manufacturers are going to be busy.
Magma doesn’t deplete.
Supply diversity is a very good thing.
Hard to imagine geothermal will ever get cheaper or more widely available than solar, but it will be very good to have.
https://www.pbs.org/newshour/nation/a-u-s-citizen-says-ice-forced-open-the-door-to-his-minnesota-home-and-removed-him-in-his-underwear-after-a-warrantless-search
See link above for what happens when a wannabe dictator is elected president.
Disgusting.
And this is related to peak oil, how?
Is this just a liberal political blog, now?
Anony,
Ron Patterson, who started this blog and ran it for a long time, was very clear that any topic was ok.
OTOH, politics are very deeply related to energy, because government policy is critical to the past and future of energy. Energy prices were controlled by Rockefeller’s monopoly which was broken up by Teddy Roosevelt; supported by the TRRC; manipulated by the US Federal government; and supported by OPEC.
The M.E. Is a very important source of oil, and the US government has been deeply involved there, from protecting the UK’s oil supply by helping depose a popularly elected government in Iran in 1954 (boy, has that come back to bite the US) to the Carter Doctrine, to the 1990 Gulf oil war, to the invasion of Iraq. The US military budget is easily $300B/yr higher because of oil wars and the related War on Terror.
Government tax policy has deeply subsidized oil. OTOH, subsidies for renewables were expanded by the last president, and have been slashed by the current president.
China is currently eating the US’ lunch on the energy of the future. It’s eating the US’ lunch on the cars and trucks of the future. That’s because the oil industry owns the US Republican Party, and is trying to hold back the tides of change.
Nuclear power would not exist in the US if not for Federal policy: it started as a military weapon (“the bomb”), and then became a power source for naval vessels, and moved to civilian uses as a PR campaign (Atoms for Peace). It would not exist without liability limits, which are a very large subsidy.
Renewables would not exist today if it weren’t for Federal R&D. Hybrids were started by a government program. German government policies helped dramatically increase the size of the renewables industry and helped it gain the scale needed to cut costs dramatically and achieve its current “energy dominance”.
Politics, for better or worse, are central to energy.
———————-
One last thing: I thought that conservatives valued the ideas that made the US great, that made it different: the freedoms we think of our soldiers as defending.
What freedom is more important than due process, innocent until proven guilty, no searches without a search warrant? Those are the values that Dennis was talking about above.
Aren’t those conservative values???
Dennis
You left wing …
https://www.dhs.gov/news/2026/01/20/making-america-safe-dhs-arrested-7000-gang-members-american-streets-first-year
Why don’t you consider all the evil people that the law enforcement officers protect YOU from.
Don’t imagine you ever risking yourself to do their job.
Well done President you are doing right here
Iver
The ICE shenanigans in Minnesota have nothing to do with protecting anyone and everything to do with Trump getting revenge on what he sees as his political enemies. And keep in mind your boy sees NATO as America’s enemies and Russia and China as friends, according to his recent social media posts.
If it was about immigration, ICE would be all over Texas and Florida, where the immigrants are. If it was about drugs and violent crime they would focus on the rural South, where drugs and crime are rampant.
If it was about protecting Americans, Republicans would target the leading causes of preventable death, such as dangerous roads and the broken health care system.
Your arguments make no sense whatsoever in a fact based world. You live in an information bubble and base your political opinions on emotions. That makes you easy to manipulate. The tech bros love people like you.
Alim
The arrests and convictions speak for themselves.
You just look at everything through a warped spyglass
https://ucr.fbi.gov/crime-in-the-u.s/2019/crime-in-the-u.s.-2019/tables/expanded-homicide-data-table-6.xls
Blacks and Hispanics murder rate is far higher than white murder which is bad enough.
Iver,
I am fine with police arresting criminals, not OK with ICE detaining US citizens without warrants. How would you feel if you were in the position of the man in the piece I linked. If you think this is ok you would have been very happy in Nazi Germany as well.
Nony,
The rule of law affects the oil industry, for example in Iraq and Venezuela. So yes relevant in my view. Feel free to ignore what you wish.
“the more wind mills the country has, the more money that country loses and the worse the country is doing”
— dictator is trying to save the west from the suicidal culture created in the past years.
The problems with renewable energies like windmills:
1. Government directed, without good planning and more out of neocon like idealism, and being taken advantage by domestic thugs and criminals, along with adversary countries, like China.
2. Chinese government had a late start and better plan, but still wasted a lot; but they know they can not afford neocon idealism and has to be pragmatic.
The MN lawyers, left or right, should make good money helping Renee Good and ChongLy Thao, and justice for all.
Dennis
Police arrest people all the time and they do get things wrong.
That is why we have a process.
Often police let people go without charge when they realise they have made a mistake. If they are sure they have the right person they have to build a case and send in to be evaluated by the prosecution service.
In Nazi Germans there were no such safeguards, police did not have to build a case. People were sent to Dachau with no trail where they were tortured.
https://en.wikipedia.org/wiki/Dachau_concentration_camp
I think your comparison with Nazi Germany is so ridiculous, again showing your utter ignorance of reality and total lack of judgement and perspective.
You are an extremist of the highest order.
The US is going to have to work very hard in the coming decades to attract immigrants.
Iver,
ICE agents are not following the normal police process. Did you read the article I linked. No warrant, ICE agents breaking into a home without probable cause. Trump is pretty lawless, the more he gets away with the more he resemble Hitler and Stalin.
I believe in standing up for the rule of law, perhaps you have a different view.
another killing by ICE in MN, obviously MAGA believe MN is the Blue’s fish belly.
An oil analyst’s optimistic/realistic view of the oil market
The outlook starts at 2:00.
https://www.bnnbloomberg.ca/video/shows/market-call/2026/01/21/eric-nuttalls-market-outlook-energy-stocks/
Iver are you saying you think Trump sent the ICE to Minnesota to deport Afro-Americans?
Iver,
Have you listened to Trump blab for more than a few sound bites?
Anyone who has listened to Trump talk for 30-60 minute clips at a time would realize he is a Liar Extraordinary (or easy to understand terms… a Pathological Liar) and a totally disjointed…
People who take Trump seriously must not realize he doesn’t give a rat’s ass about them.
The Real Irony… is that MAGA believes Trump cares about them.
LOL,
steve
Steve,
There’s an interesting book about groups, and group identity – “The Collective Edge” by Colin Fisher.
It explores how people identify with groups, and get their ideas from them.
Very informative.
Wind power is so cheap and coal so expensive
https://www.endfuelpoverty.org.uk/4950-excess-winter-deaths-caused-by-cold-homes-last-winter/
So why are so many more elderly dying of cold?
Coal is so expensive so why has China increased consumption by 2 billion tonnes per year since the start of the century?
https://www.researchgate.net/figure/Coal-consumption-and-growth-rate-from-1978-to-2020-in-China_fig4_357024811
Iver,
China’s coal consumption increased by about 3 billion tonnes per year from 2000(1.4 Bt/y) to 2024(4.4 Bt/y). Of this increase, 2.5 Bt/y occurred for 2000 to 2014 and about 0.5 Bt/y from 2014 to 2024, so the rate of growth has been slower of late.
The difference between coal on the one hand and wind and solar on the other is that the cost of coal fired power plants isn’t falling.
Almost all of the increase in coal capacity in China came in before the Germans started heavily investing in solar in the 2000s. This cause a collapse in solar prices, as shown here:
https://aneconomicsense.org/2019/06/20/the-increasingly-attractive-economics-of-solar-power-solar-prices-have-plunged/
There are several reasons why coal is still heavily used in China:
Existing coal plants are competing against new wind and solar.
The power plants are new compared to European and especially American plants.
Some Chinese regions have a lot of coal mines the want to keep alive.
The newest plants are flexible enough to function as peaker plants.
Wind saw a less dramatic fall, but the timing is about the same.
DC
Of course it’s going to slow down, they built everything they need.
Alim
If solar and wind are so cheap then why have our bills increased 150% during the massive increase in wind power in the U.K?
https://www.ageuk.org.uk/siteassets/documents/reports-and-publications/reports-and-briefings/health–wellbeing/age_uk_excess_winter_deaths_briefing_june_2016.pdf
I hope you think these people dying is worth it. Most people realise that the night energy bills are the more vulnerable people will die. Rather horrible taking weeks to die of relentless cold.
a majority of China solar companies posted red, total loss at ~5billion USD for solar alone
Interesting
https://www.cnbc.com/2026/01/22/trump-tariffs-greenland-europe-deal-taco-trade-sell-america.html?utm_source=firefox-newtab-en-us
How does this relate to energy? The economy and energy are attached very tightly. The TACO trade affects World GDP.
Meanwhile Canada is doing a trade deal with China and Trump is threatening 100% tariffs on all Canadian imports if Canada does. That includes 60% of US oil imports, so maybe 4 million barrels a day.
But TACO, probably, but who knows? Nobody knows how much Canadian oil will cost in America next month. It’s not the world’s best investment environment.
North Dakota November Oil Production
Up 12 kb/d to 1,189 kb/d. Surprised with the cold weather.
See chart
A ND
Rig Report for the Week Ending January 23
The rig count drop that started in early April 2025 when 450 rigs were operating rose again this week. Drilling continues at a steady rate with WTI moving into the low $60s/b.
– US Hz oil rigs rose by 2 to 367, down 83 since April 2025 when it was 450. The 2 rigs were added in Colorado. It was also up 5 from the low of 362 first reached in the week ending August 1. The rig count is down 18% since April 2025.
– New Mexico Permian was unchanged at 92. Lea and Eddy were unchanged at 59 and 33, respectively.
– Texas was unchanged 167. Midland and Martin were unchanged 23 and 25 respectively.
– Eagle Ford was unchanged at 29.
– NG Hz rigs dropped 1 to 107.
A Rig
Frac Spread Report for the Week Ending January 23
The frac spread count rose by 3 to 163. From one year ago, it is down by 20 spreads and is down by 52 since March 28.
A Frac
Scrub Puller,
I haven’t seen OFM for a while, sadly.
Thanks for reply Nick . . . yeah I wondered, I used to enjoy his down homy practical posts.
Cheers
Me too. His father lived quite a long time, so I thought he might too. Perhaps he’s just doing other things – that would be nice.
A new post is up.
https://peakoilbarrel.com/short-term-energy-outlook-january-2026/
I’ve heard that in the US, some fields were overexploited to increase production at the expense of the final total potential of the fields. I suspect Saudi Arabia and perhaps a few other groups have been doing the same overexploiting their fields to increase production but hastening and increasing the sharpness of the coming decline.
DS
From what I have read, I don’t think that Saudi Aramco would do that. They have been leaders in optimizing their oil production. Their water injection program has increased recovery from oil fields from 1/3 to 1/2 and have even suggested 60%.
I sent an email to Old Farmer Mac in May 2018 asking how he was, I did not hear back. Tried again today. Will let people know if I hear anything.
I seem to remember OFM posted maybe 12 or 18 months back.