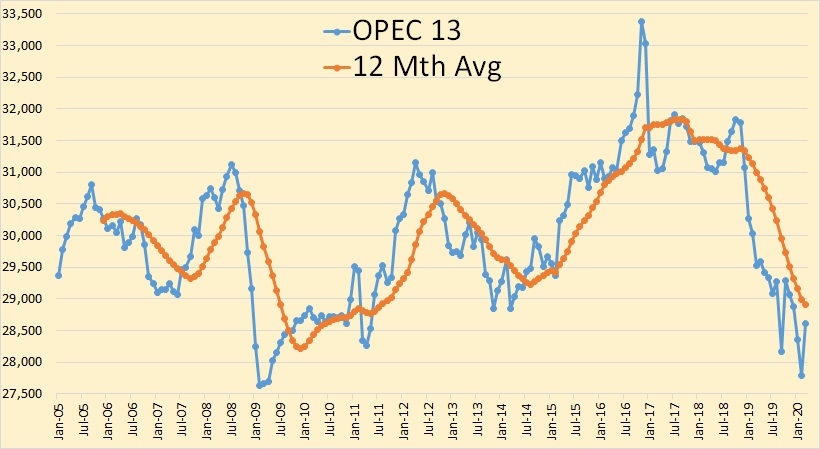
All OPEC data reflected in the charts below are from the April edition of the OPEC Monthly Oil Market Report. https://momr.opec.org/pdf-download/ The data in in thousand barrels per day and all data is through March 2020.
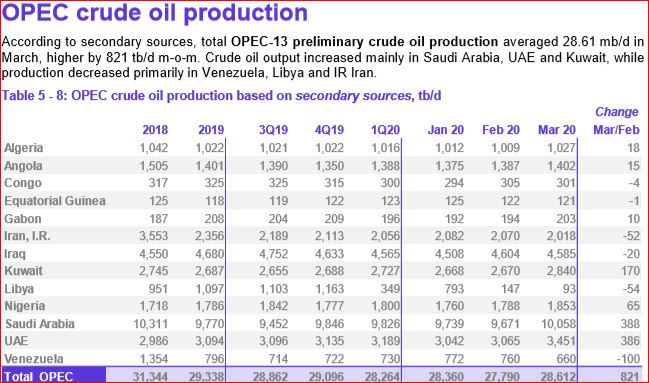
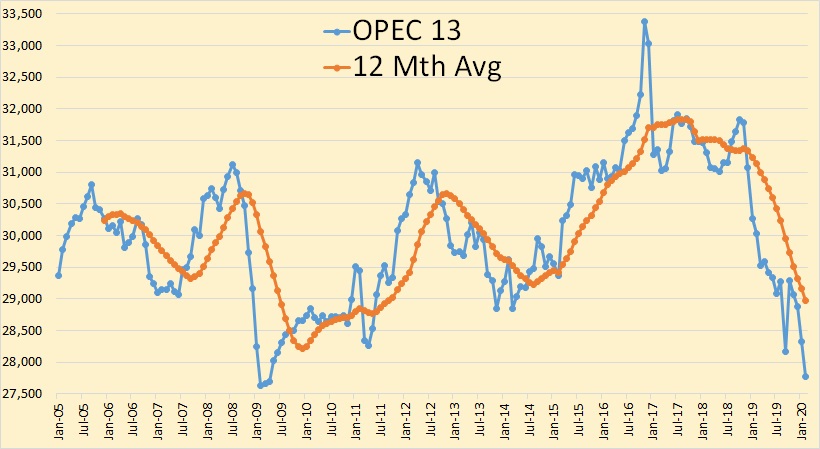
Though OPEC 13 was up 821,000 barrels per day in March it was still the fourth lowest month in 9 years.
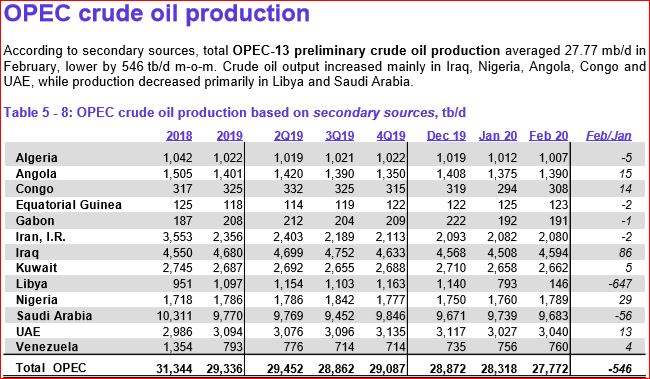
Iran, Libya, and Venezuela are exempt from the agreed on cuts. These three were down a combined 206,000 barrels per day. Those subject to cuts, were up a combined 1,026,000 barrels per day.
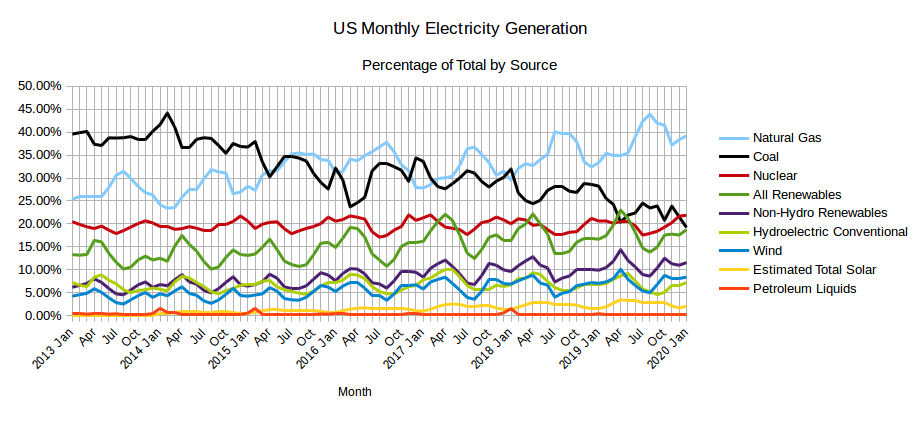
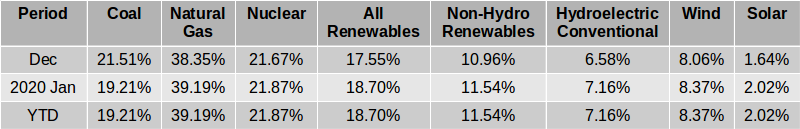
The EIA released the latest edition of their Electric Power Monthly on March 24th, with data for January 2020. The table above shows the percentage contribution of the main fuel sources to two decimal places for the last two months and the year 2020 to date. Read More
Preparing this March post has been a surrealistic exercise. Here I am providing a January US production update when at a time, January, the world had no clue that it was going to be hit with a double Black Swan event in early March . There was a hint in January on the coming pandemic for those who were listening. However, there was no clue of the Shock and Awe attack that would be launched by SA after Putin and his Oily Oligarch friend Sechin made the wrong move in the world’s Oil Chess Game. Russia thought that they had SA in Check, instead Russia and the rest of world were End Played. Now, a way must be found out of this mess. Reports are circulating that Trump and Putin have been talking and that an OPEC + meeting will be convened shortly. Let’s hope adult’s come to the table.
The silver lining, if there is one, is that the world will need lower oil prices to come out of the current economic slowdown. The question is, if an agreement can be brokered between US, Russia and OPEC, “What will be the right price for oil for both the producers and the economy?
The irony here is that Trump will be holding meetings with oil company executives shortly to see how the US can help. In the meantime the NOPEC (No Oil Producing and Exporting Cartels Act) bill keeps circulating within Congress. Interesting how the world, US positions and thinking, can be flipped upside down over night.
Chapter 5 of our book Mathematical Geoenergy describes a model of the production of oil based on discoveries followed by a sequence of lags relating to decisions made and physical constraints governing the flow of that oil. As it turns out, this so-named Oil Shock Model is mathematically similar to the compartmental models used to model contagion growth in epidemiology, pharmaceutical/drug deliver systems, and other applications as demonstrated in Appendix E of the book.
One aspect of the 2020 pandemic is that everyone with any math acumen is becoming aware of contagion models such as the SIR compartmental model, where S I R stands for Susceptible, Infectious, and Recovered individuals. The Infectious part of the time progression within a population resembles a bell curve that peaks at a particular point indicating maximum contagiousness. The hope is that this either peaks quickly or that it doesn’t peak at too high a level.