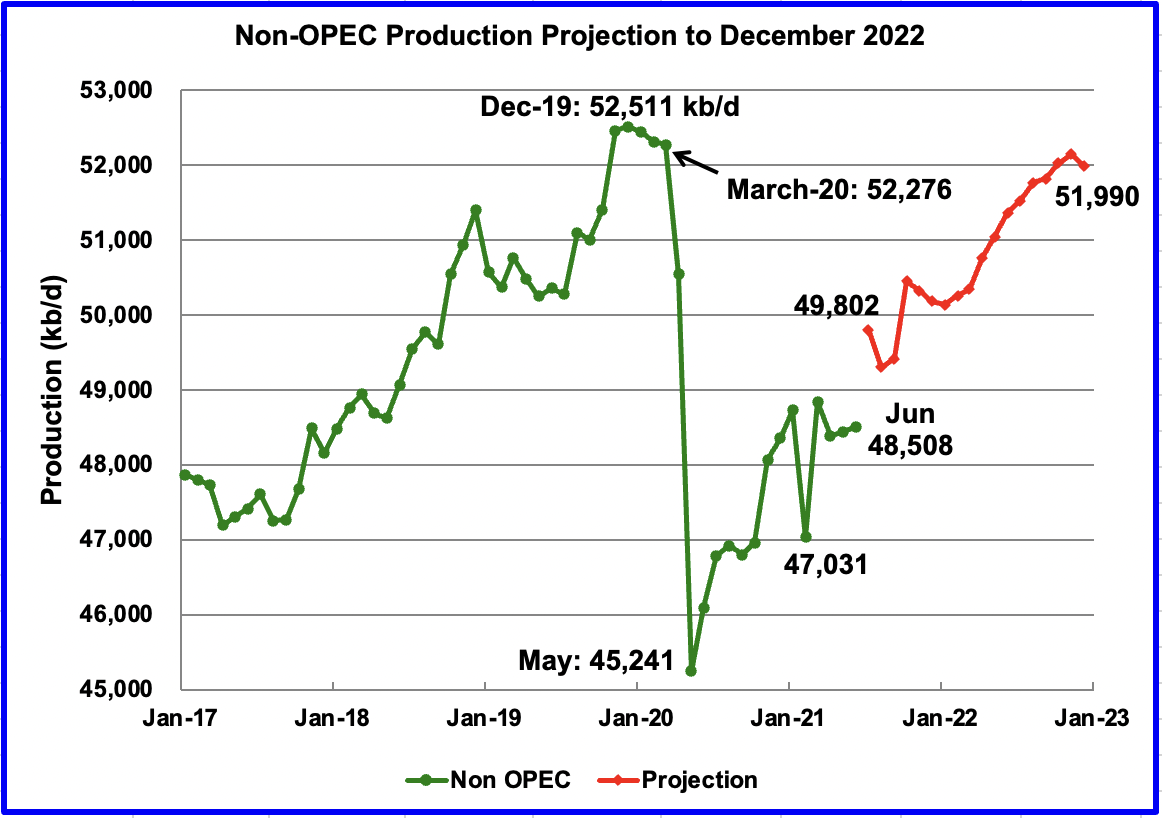
Below are a number of oil (C + C ) production charts for Non-OPEC countries created from data provided by the EIAʼs International Energy Statistics and updated to June 2021. Information from other sources such as OPEC, the STEO and country specific sites such as Russia, Norway and China is used to provide a short term outlook for future output and direction for a few countries and the world.
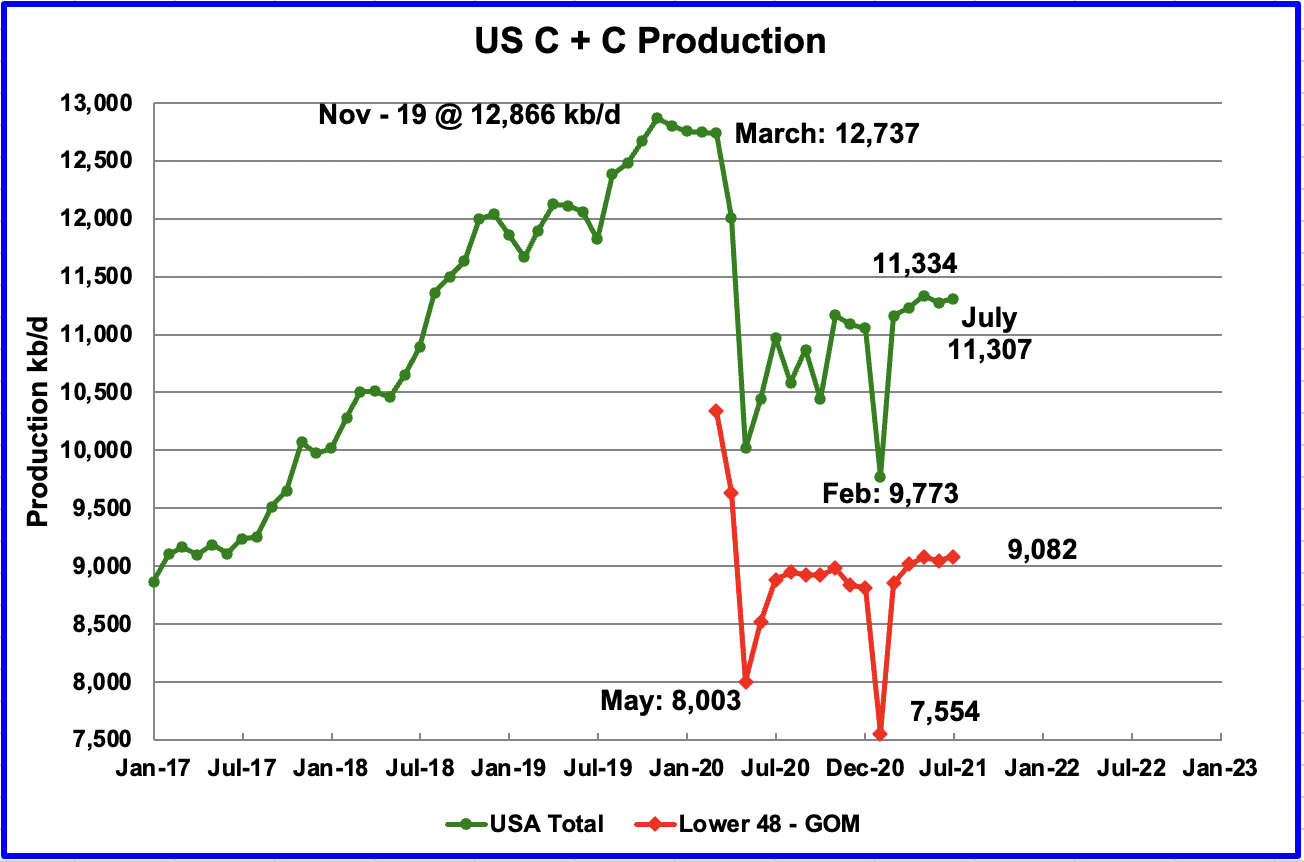
All of the oil (C + C) production data for the US state charts comes from the EIAʼ’s Petroleum Supply monthly PSM. After the production charts, an analysis of three EIA monthly reports that project future production is provided. The charts below are updated to July 2021 for the 10 largest US oil producing states.
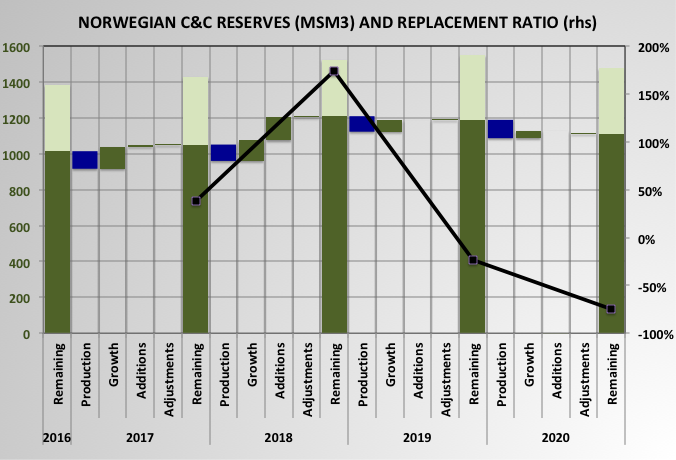
The increase in remaining C&C reserves that has been seen over the last few years, and has come mostly from growth in Johan Sverdrup, has run its course and there was a significant drop in 2020, even as production continued to climb. The reserve replacement ratio has been 38%, 174%, -24%, -75% for 2017 through 2020.
The Norwegian NPD does not use the standard proven/probable/possible categories but based on the way growth occurs the dark colours are close to a P1 reserve number (producing or in development in NPD terms) and the light colour represents a resources or a P3 value (production in clarification or production likely but not yet evaluated). Growth mostly is given by moving resources from the light areas to the dark. New discoveries are usually initially added to the resources.