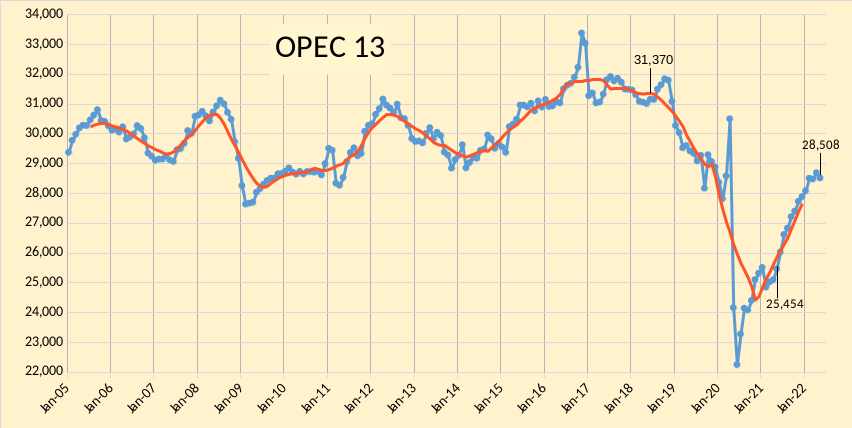
The OPEC Monthly Oil Market Report (MOMR) for June 2022 was published last week. The last month reported in most of the charts that follow is May 2022 and output reported for OPEC nations is crude oil output in thousands of barrels per day (kb/d). In most of the charts that follow the blue line is monthly output and the red line is the centered twelve month average (CTMA) output.
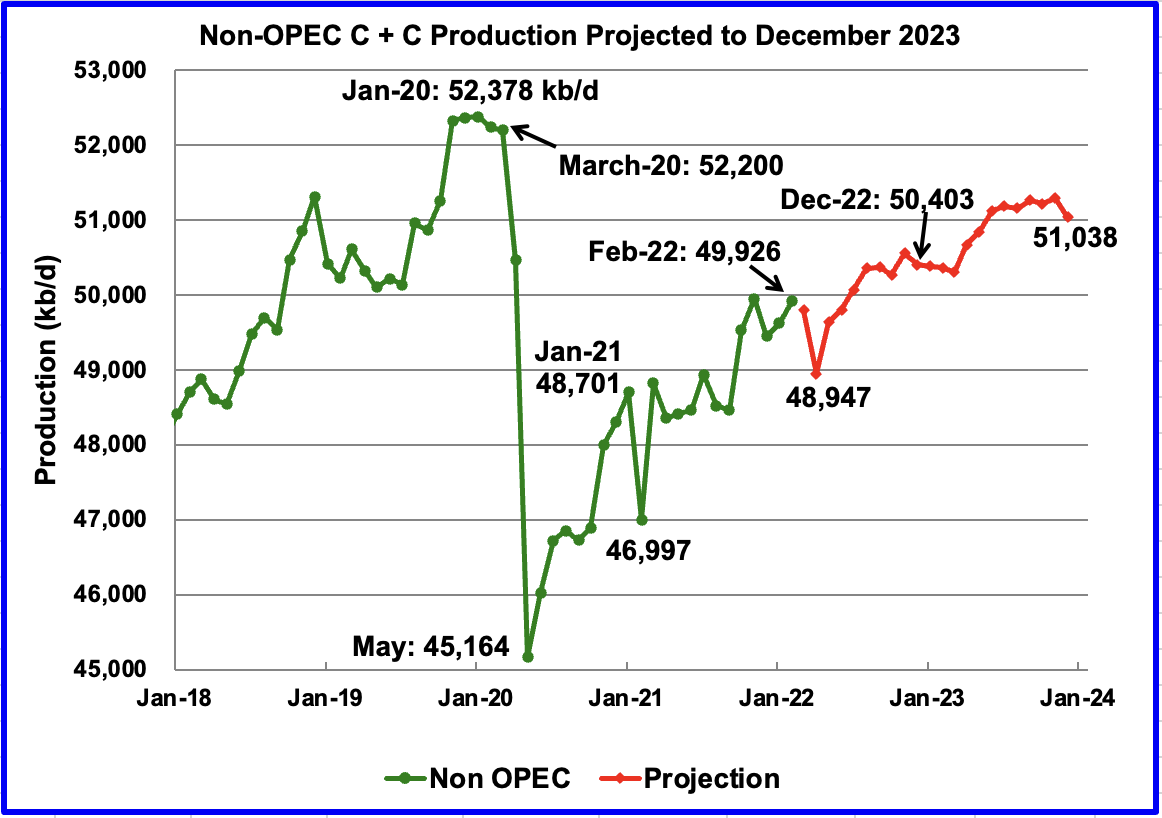
Below are a number of crude oil plus condensate (C + C ) production charts for Non-OPEC countries created from data provided by the EIA’s International Energy Statistics and updated to February 2022. This is the latest and most detailed world oil production information available. Information from other sources such as OPEC, the STEO and country specific sites such as Russia, Brazil, Norway and China is used to provide a short term outlook for future output and direction for a few countries and the world.
February Non-OPEC production increased by 303 kb/d to 49,926 kb/d. Of the 303 kb/d increase, the biggest increase came from Canada 225 kb/d. Offsetting the increase were decreases from Brazil 116 kb/d and China 92 kb/d. The Febuary 2022 output of 49,926 kb/d is 2,274 kb/d lower than the March pre-covid rate of 52,200 kb/d.
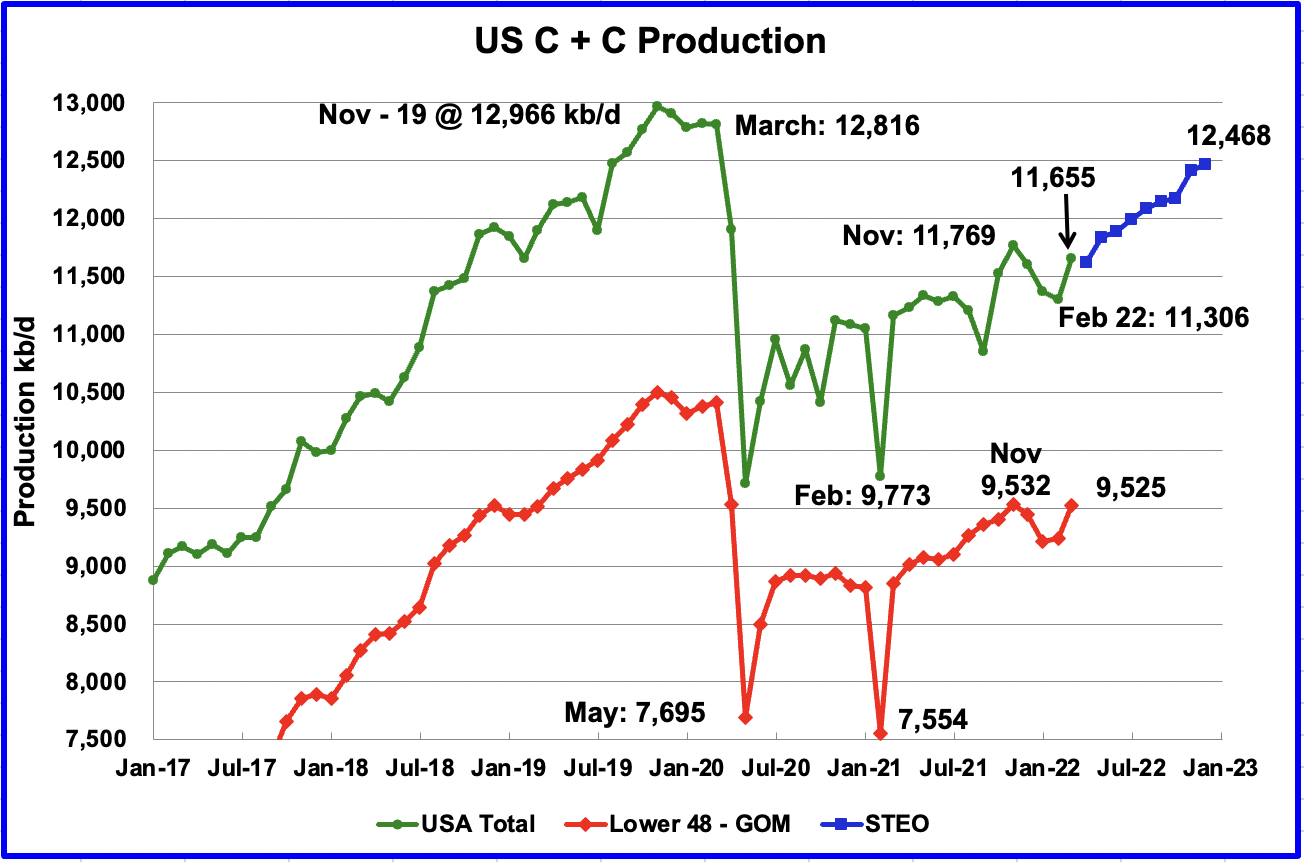
All of the oil (C + C) production data for the US state charts comes from the EIAʼ’s Petroleum Supply monthly PSM.
U.S. March production increased by 349 kb/d to 11,655 kb/d. Relative to November’s 2021 production of 11,769 kb/d, March is still 114 kb/d lower. The main increases came from Texas 147 kb/d, ND 66 kb/d and the GOM 75 kb/d.