Comments not related to Oil or Natural Gas production in this thread please. Thank you.
World Oil Production up in February

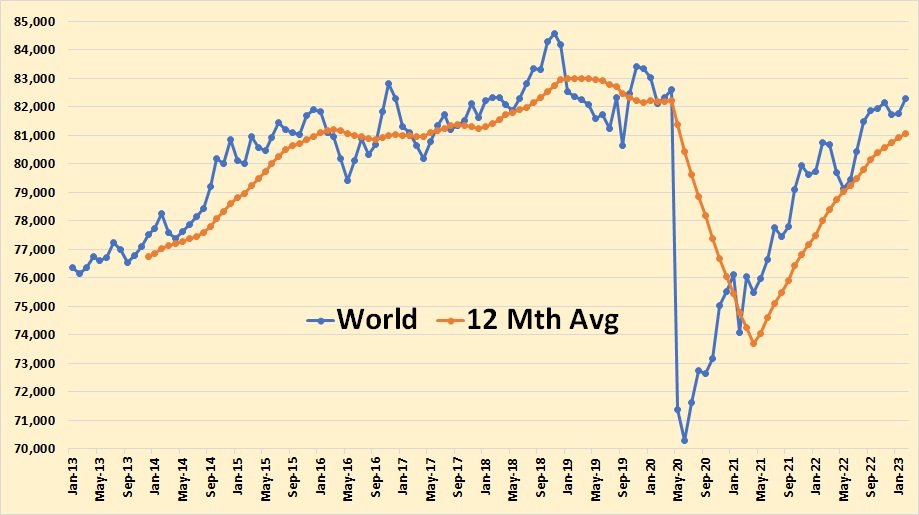
World C+C production increased by 524,000 barrels per day in February to a post-pandemic high.
Read MoreOpen Thread Non-Petroleum June 10 2023
Comments not related to oil or natural gas production in this thread please. Thanks.
Read more: Open Thread Non-Petroleum June 10 2023US March Oil Production at Post-Pandemic High
A guest post by Ovi
All of the Crude plus Condensate (C + C) production data for the US state charts comes from the EIAʼs Petroleum Supply monthly PSM which provides updated information up to March 2023.

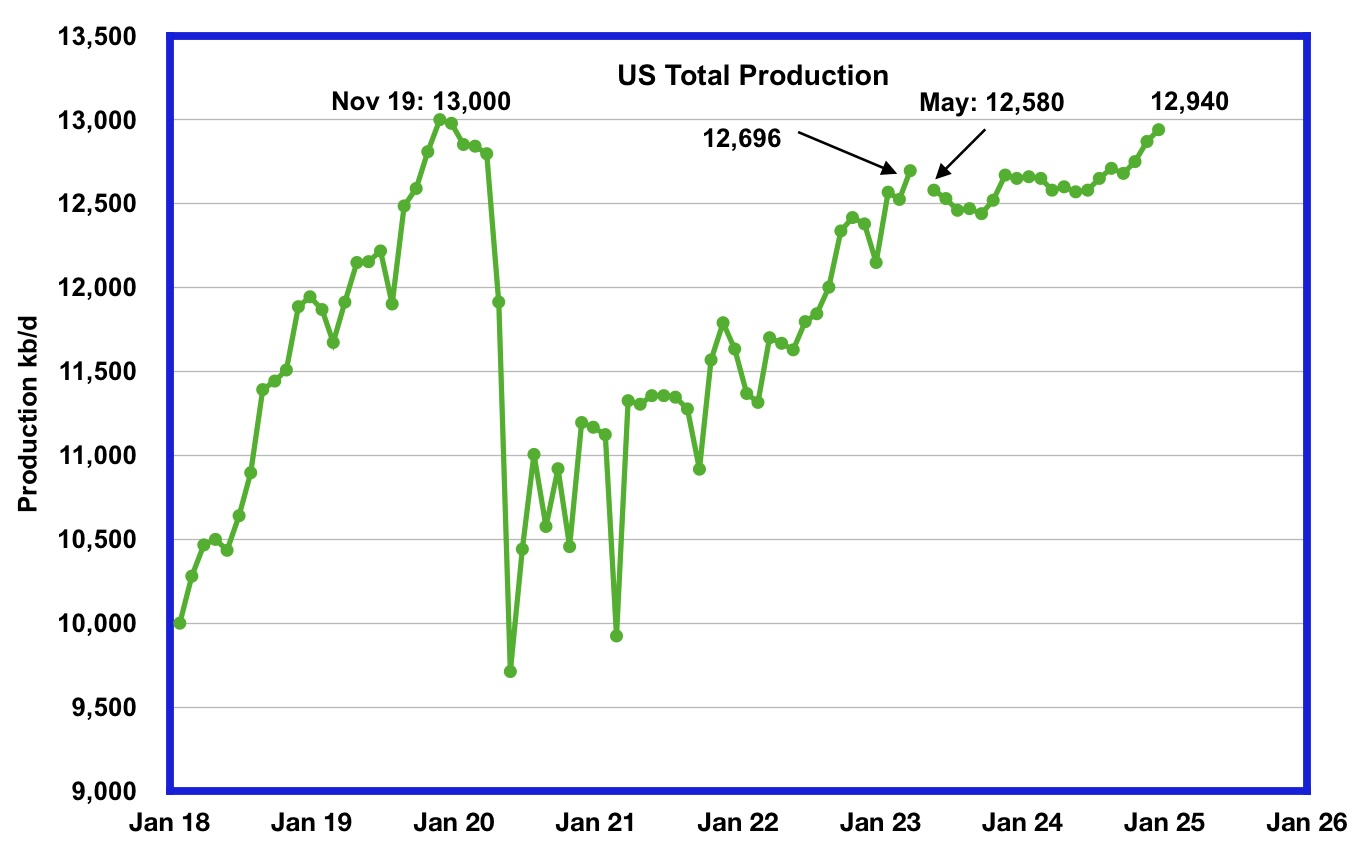
U.S. March oil production increased by 171 kb/d to 12,696 kb/d, a new post pandemic high. Note that February’s output was also revised up by 42 kb/d from 12,483 to 12,525 kb/d. So relative to the initial EIA February report, production is up by 213 kb/d.
The EIA’s forecast production drop that starts in May 2023 could be associated with the drop in completions that started in early May combined with a projected drop in GOM production.
Read MoreOpen Thread Non-Petroleum, June 3, 2023
Comments not related to oil or natural gas production in this thread please. Thanks.
Read More