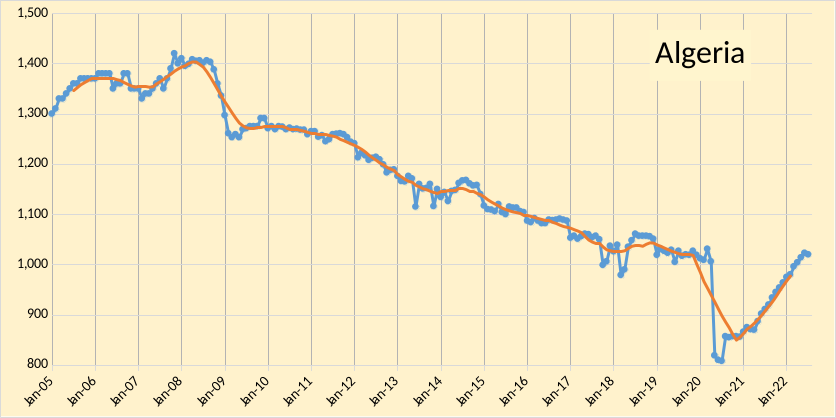
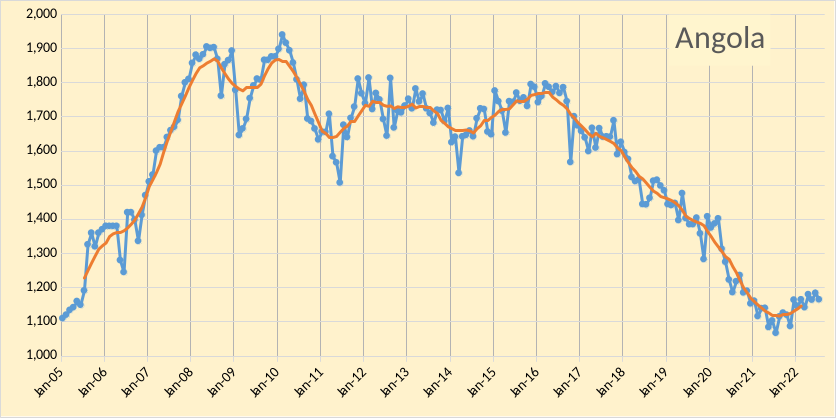
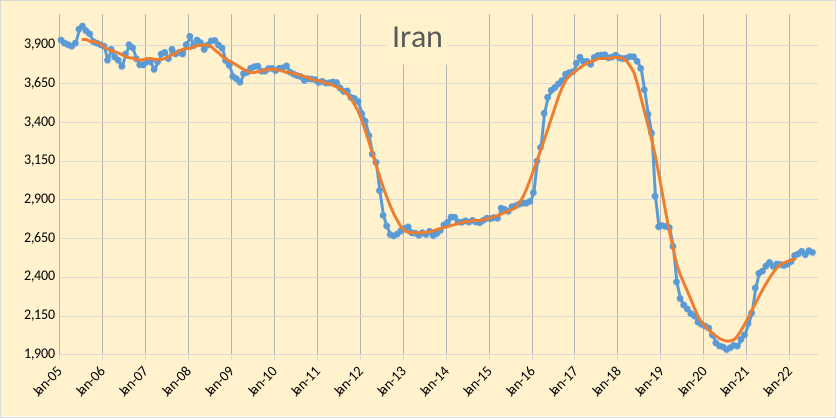
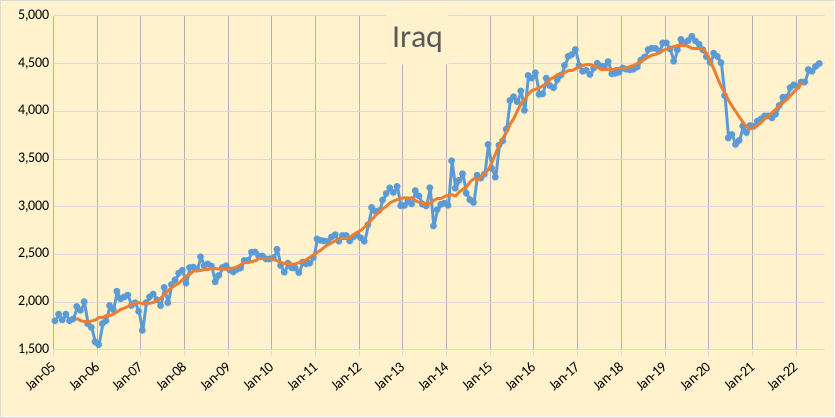
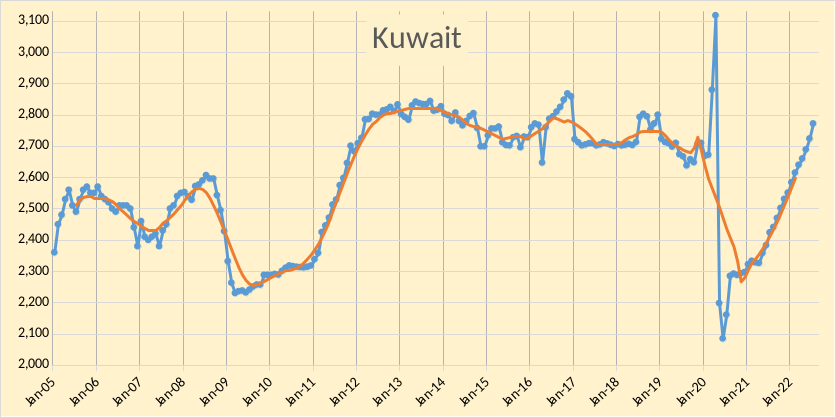
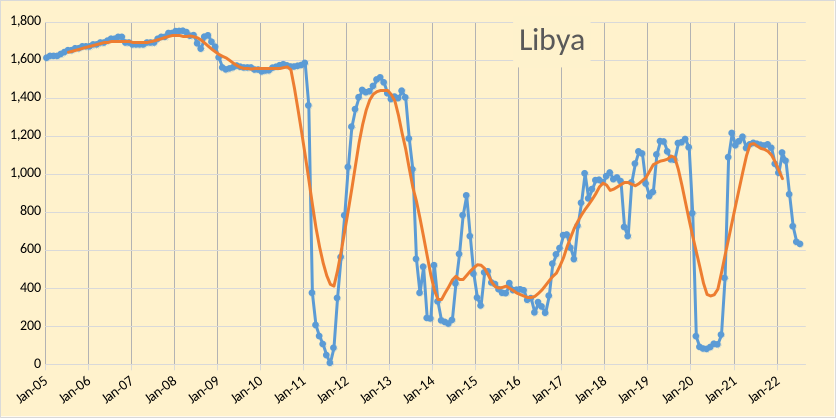
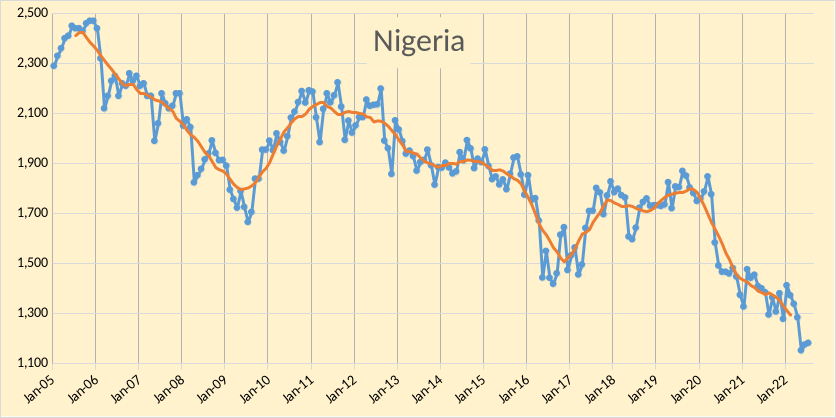
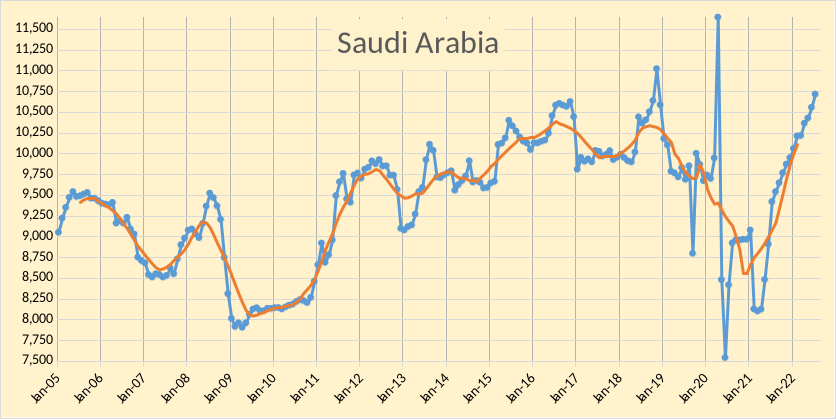
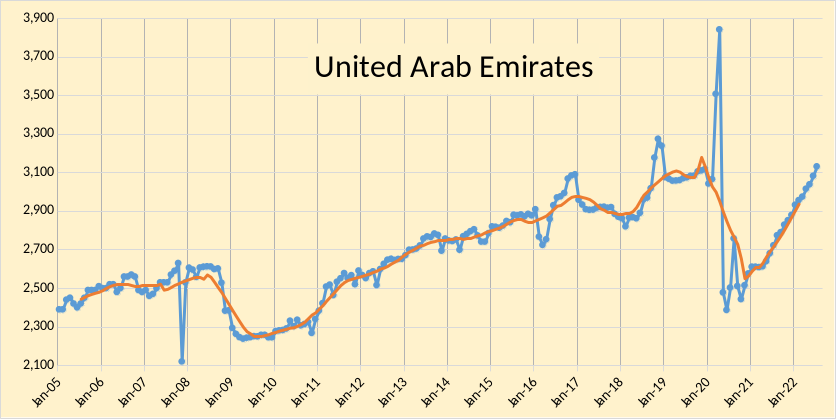
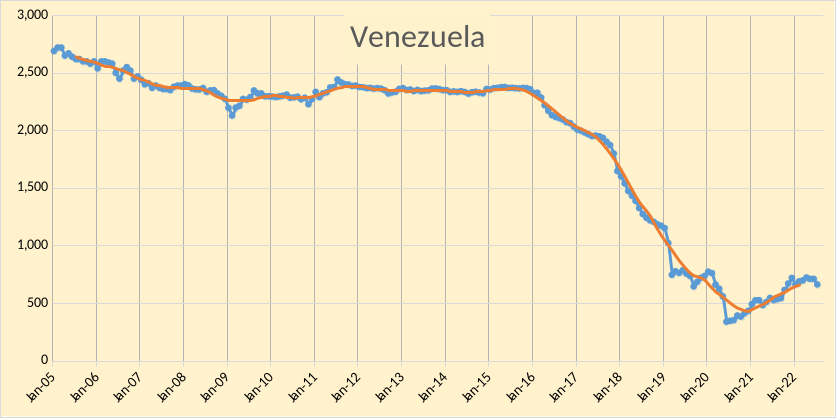
The OPEC Monthly Oil Market Report (MOMR) for August 2022 was published recently. The last month reported in most of the OPEC charts that follow is July 2022 and output reported for OPEC nations is crude oil output in thousands of barrels per day (kb/d). In most of the OPEC charts that follow the blue line is monthly output and the red line is the centered twelve month average (CTMA) output.
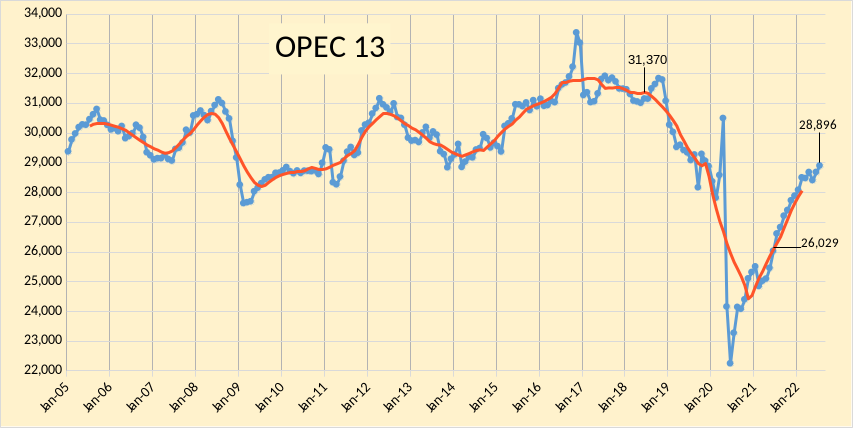
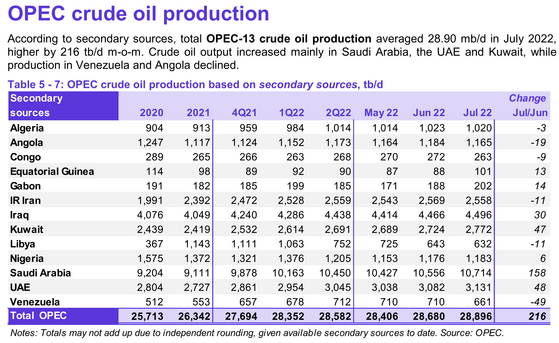
OPEC output was revised lower in June 2022 by 36 kb/d and May 2022 output was revised down by 76 kb/d compared to last month’s MOMR. The bulk of the July increase in OPEC output (73%) was from Saudi Arabia(158), with smaller increases from UAE(48), Kuwait(47), and Iraq (30). Venezuela had a decrease of 49 kb/d. The rest of the OPEC producers had small increases or decreases of less than 20 kb/d with a total decrease of 18 kb/d for all 8 nations.
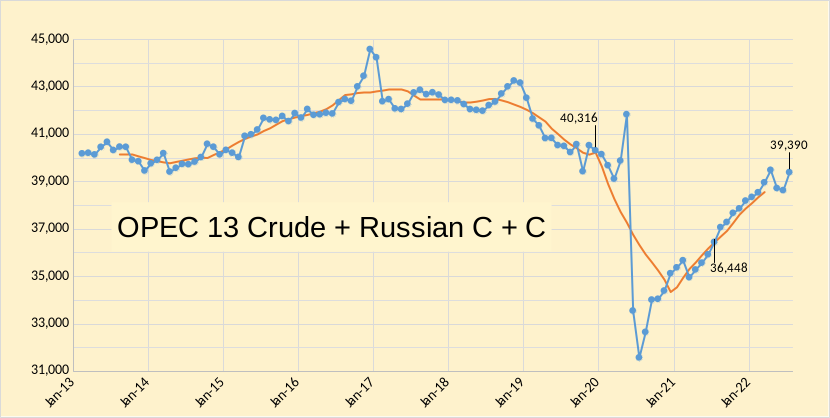
In the chart below we have Russian C + C and OPEC crude oil output. Output is 2561 kb/d below the centered 12 month average in November 2018 (when world output was at its peak.) I used estimates of Russian output from Tass at this link for output in May and June (1 tonne=7.33 barrels) and the link here was used for the July 2022 estimate. The Russian crude plus condensate data has been harder to find since March when the war with Ukraine started.
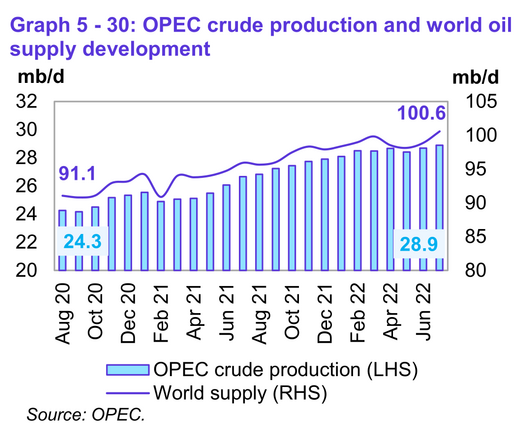
World Liquids supply increased to 100.6 Mb/d in July 2022, about 9.5 Mb/d higher than 2 years ago.


It is unlikely that OPEC will be able to meet the call on OPEC of 30 Mb/d or more in the second half of 2023 unless a deal is reached with Iran on the JCPOA (aka Nuclear Deal) in the near term and sanctions on Iran are quickly removed, even then it will take time for Iran to ramp up output, if an agreement is reached.
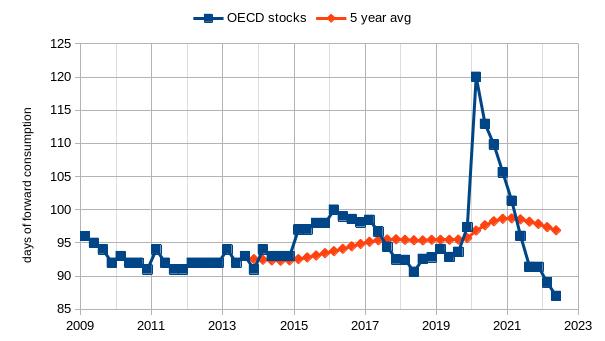
OECD stocks using days of forward consumption are presented in Figure 7 above along with the trailing 5 year average from 2013Q4 to 2022Q2. Currently they are at 87 days (includes government and commercial petroleum stocks) lower than any quarter from 2009Q1 to 2022Q1 and about 10 days below the 5 year average (97 days) . Looking at the chart it seems stocks at days of forward supply between 90 and 94 days usually results in high oil prices, I expect high oil prices (which I define as $80/bo or more in 2021 US$) will continue unless we see a severe recession (which I define as World annual real GDP growth of negative 1% or lower.)
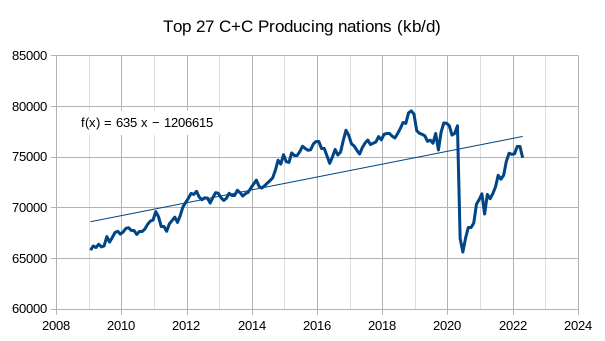
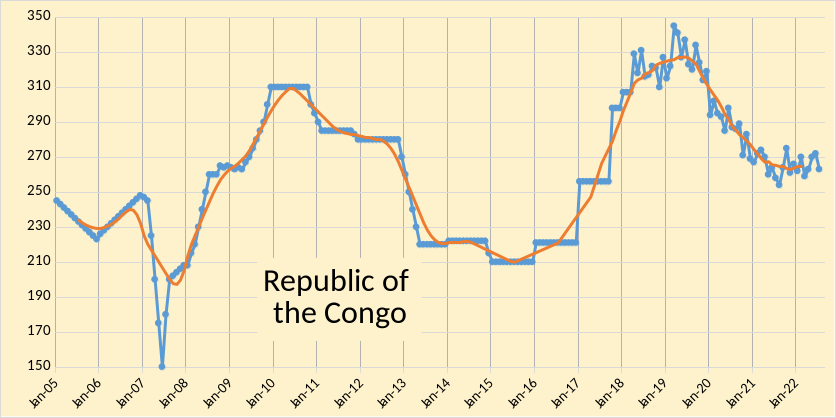
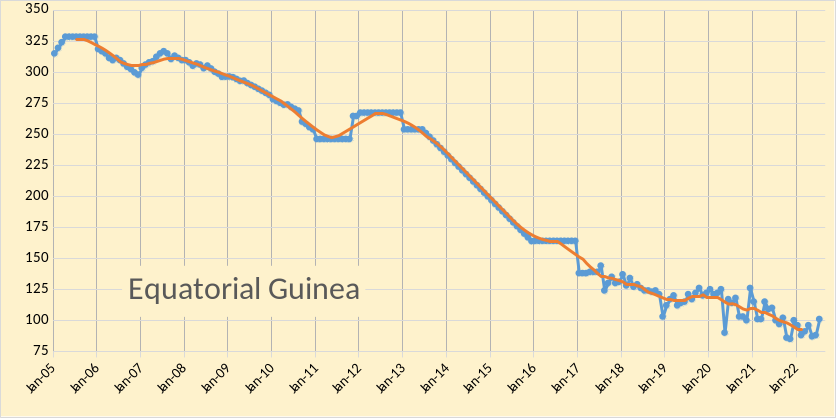
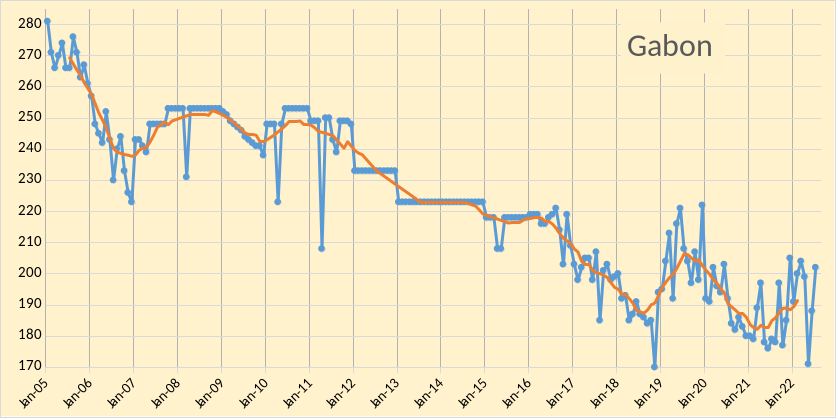
The Crude plus Condensate (C+C) output from the top 27 oil producing nations in April 2022 are presented in Figure 8 above. The average annual rate of increase in output from Jan 2009 to April 2022 using an OLS trendline is 635 kb/d each year. If we do a similar chart over the Jan 2009 to Dec 2019 period (eliminating the pandemic) the average annual rate of increase is 1272 kb/d each year using OLS to estimate the trend. The 27 nations include the 16 non-OPEC producers covered in the previous post along with Argentina, only the top 10 OPEC producers are included in this group of 27 nations, we leave out Republic of Congo, Equatorial Guinea, and Gabon which all produce under 300 kb/d and had combined output of only 566 kb/d in July 2022.
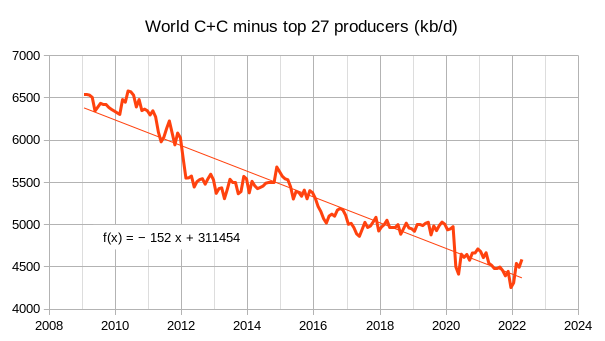
Figure 9 above presents World C+C minus output from the top 27 oil producing nations from Jan 2009 to April 2022. The average annual decrease in output is 152 kb/d each year using OLS over the entire period presented to estimate the trend. Using these estimates suggests about 85 +/- 1 Mb/d for World C+C output in 2028 which I expect may be the peak in World C plus C output.
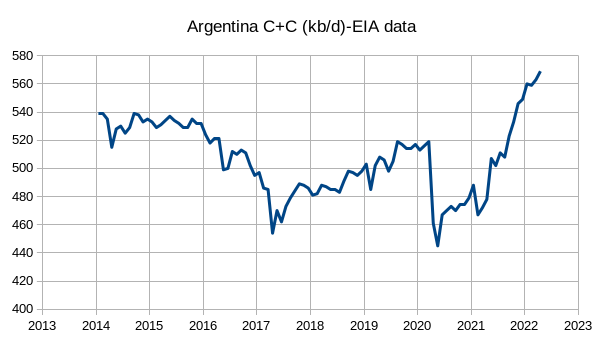
Above I present output for Argentina from Jan 2014 to April 2022 for completeness. The charts for the other 26 nations that constitute the top oil producing nations are covered in this post for OPEC and in last week’s post for non-OPEC oil producers.
The EIA’s Monthly Energy Review is out with production data through May and an estimate of June and July production.
Ron
For comparison, the STEO has June output at 11,800 kb/d, which I think will be closer to the next EIA update.
11,800 kb/d sounds reasonable. That’s an increase of 205 kb/d over May, less than half the 445 kb/d increase that the Energy Review forecast. Makes you wonder if these guys at the EIA ever talk to each other. Perhaps they work in different office buildings. Anyway, we will know Wednesday when the Petroleum Supply Monthly comes out.
Thanks Dennis for the effort and information.
It is unlikely that OPEC will be able to meet the call on OPEC of 30 Mb/d or more in the second half of 2023 unless a deal is reached with Iran on the JCPOA (aka Nuclear Deal) in the near term and sanctions on Iran are quickly removed, even then it will take time for Iran to ramp up output, if an agreement is reached.
This will be unlikely in my opinion, I just cannot see a deal being reached now or in the near future. Plus late 2024 is the U.S presidential election and if a republican candidates gets elected we can assume Irans production will be where it is at now or less (barring clandestine sales).
From figure 4. June 22 OPEC production accounts for ~ 28% of the worlds liquid fuel supply. You stated you don’t expect this to increase even if Iran nuclear deal is reached the lagging factor. Do you expect U.S and/or Russia to pick up the slack to make up for 2023 (figure 5) OPEC estimates of world oil demand ?
Iron Mike,
You’re welcome.
I think it more likely that supply will be short and oil prices will need to rise to destroy some oil demand in order to balance the market, there might be some supply reponse to very high oil prices, but it will take a few years for resources to be developed, so my expectation is high oil prices at least until July 2024 unless a major recession puts a big dent in demand for oil. Lots of uncertainty and probably very volatile oil prices over the next 6 to 7 years at least.
Last month HHH predicted WTI will hit $25 by March’23. So, I’ve paper traded (bought) 2 micro-WTI put options to try and capture the gains from this prediction. Both options have expiry dates of March’23. Trades dated Aug 23rd.
1. Strike $60 cost 2.61 x $100 = $261
2. Strike $93 cost 14.04 x $100 = $1404
As of today these trades have already lost $242. I will provide updates on the 23rd of each month.
Well, that is putting money where your mouth is!
Will be interesting to follow, indeed.
But in order to hedge, one can of course store an IBC of diesel or gasoline, also handy if things get really rought…
Thanks Laplander, no money involved, it’s all virtual. Everyone seems to have missed the phrase “paper traded”. It would have been clearer if I’d said “bought on paper”. If I had a US brokerage account I might be tempted to part with a real $261 for the $60 strike…
John, oil prices are extremely hard to predict. Remember, you are going up against some of the smartest traders, and damn few of them are making a lot of money.
That being said, barring the economic collapse of half the world, long-term oil prices are going up. They will gyrate up and down all the while, but the long-term trend will be up. HHH is betting on a severe recession, driving demand down and prices down. That very well could happen, but there is just no way prices will ever reach $25 a barrel again.
That’s like $16 in 2004…oil was $40-$50 in 2004…
I think we’d be lucky to see oil anywhere near $50, but $80 seems like a longer-term bottom…
My guess is that we’d see sustained prices above $120 from Oct. 2022 to Sep. 2023, peaking at ~$200 in June 2023… a new bottom in the $60 range could form in Feb. 2024.
It’s no longer a buyers market, that’s for sure….
Yes, while all the politicians and economist at the FED and elsewhere are aren’t predicting anything bad.
The bankers that actually loan all the real money into the economy are telling you via the grow testily inverted yield curves that shit is actually going to hit the fan. I know most believe it can’t happen again because the FED and government won’t let it.
I’m saying FED and government can’t stop it. And we should look to Europe and China as they will lead the way down.
$25 oil is a real possibility if the Chinese economy implodes. After 30 years of continuous growth a deep recession is inevitable at some point. And their property bubble looks set to unwind in a massive way.
This is the Chinese response. Huge amounts of oil taken out of the ground, expended on what amounts to be rubble.
https://www.reddit.com/r/interestingasfuck/comments/wstp8r/china_demolishing_unfinished_highrises/
John Norris,
Good luck with that. I think lottery tickets would be a better bet.
Easier to predict European energy price contracts, so get in on that.
French 1 year forwards as of today: €875 MWh
German 1 year forwards: €750 MWh.
In 2010 to 2020 the average was €41 per MWh.
I can see the $60 put. But the $93? Seems kind of expensive to buy “at the money” puts for an event happening 7 months from now. Given a spread from $100 – $25, and you think oil price is going LOW, I would think buy something closer to $70 and $50 puts. Plus you’ll feel “less bad” if there’s a spike back towards $110.
For comparison, attached is a table that compares OPEC’s July production estimates with the IEA’s estimates. The IEA has higher estimates for the two largest OPEC producers SA and the UAE with the UAE being 4.8% higher.
Looking at past ~5 years data the following trends stick out like a sore thumb:
There are approximately 10 oil producing nations that export a considerable amount of oil compared to what they produce.
They are typically grouped by OPEC and Non-OPEC as follows:
Non-OPEC countries are Russia (exporting between 7.5 – 8.3 MBpD between ’17 – ’21);
Canada (exp. between 2.4 – 3.2 MBpD);
Norway (exp. between 1.5 – 1.8 MBpD);
Qatar (exp. ~1.4 MBpD); and
Kazakhstan (exp. ~1.5 MBpD).
OPEC countries are Suadi Arabia (exp. 7.3 – 8.5 MBpD);
Iraq (exp. 3.4 – 4.0 MBpD);
Iran (exp. 1.4 – 3.2 MBpD);
UAE (exp. 2.7 – 3.0 MBpD); and
Kuwait (exp. 2.2 – 2.5 MBpD).
It’s no surprise that these combined countries had peak net exports of ~36.3 MBpD in 2018. The following year (2019) their combined contribution to the global oil market dropped by ~1.3 MBpD (3.5%). 2020 was an anomalous year where their combined net exports were only ~32.6 MBpD. Excluding 2020, the drop in net exports from 2019 (35) to 2021 (33.2) was 1.8 MBpD (~5%; or ~2.5% annual).
In 2022, no net increase is currently anticipated over 2021 for the five Non-OPEC exporters (Russia, Canada, Norway, Qatar, and Kazakhstan).
For the top 5 OPEC exporters (Saudi Arabia, Iraq, Iran, UAE, and Kuwait). A net increase of 0.5 MBpD is possible, but more likely they will stay roughly the same.
Total net exports of the top 10 oil exporters are as follows:
2022: 33.5 MBpD (Estimate)
2021: 33.1 MBpD
2020: 32.6 MBpD
2019: 35.0 MBpD
2018: 36.3 MBpD
2017: 35.7 MBpD
Trends for the countries declining the most:
Saudi Arabia – Net exports between 2018 and 2021 declined by 1.1 MBpD.
Iran – Over the same period decline of 1.0 MBpD.
Russia – Over the same period decline of 0.7 MBpD.
The only Top 10 oil exporting country to buck the decline trend was Canada, increasing their net exports by ~0.5 MBpD between 2018 and 2021.
Since peaking in 2018, approximately 10% less exported oil is available to the oil importing countries. Data suggests that this overall trend is not changing any time soon. Conditions in the 2 biggest oil exporting countries (Russia and Saudi Arabia) would need to improve drastically in order for the Top 10 oil exporters to get back in the game, with the war in Russia and Saudi Arabia’s near max production it doesn’t look like increases to match 2018 could happen any time soon…
Damn, Kengeo, fantastic report. I read it twice, and I still can’t believe it is that obvious. I have always looked at production data and never export data. But what the hell? The export data makes the point even more obvious. Obviously, peak production was in 2018. But you make it even more obvious that peak exports were also in 2018.
Thanks, please keep posting the obvious.
Thanks Ron, seems to me that it’s the more important aspect of global oil trade.
After all, places like Mexico, Brazil, US, and China may produce a combined ~30 MBpD, but almost none of that amount leaves their borders (or at least none of it from a Net perspective). That group of 4 non-exporters manages to consume almost 40 MBpD…benefiting from all the exports from the Top 10 exporters…
Seeing that the exporters are trending lower each year and non-exporters need to import more each year as their own supplies run low it’s setting up to be a perfect storm…what I can’t figure out is if overall we should expect 3-5% annual decline or if it’s almost twice that 7-9%…I suspect it will be over 6% and less than 9%…read something recently that the big fields have decline rates of 6.5%, can’t recall the source exactly…
Kengeo,
Interesting data, but in my view total production is what matters, what gets exported or imported depends on many choices by individual nations, businesses and consumers and these are impossible to predict going forward. In my mind it is much simpler to look at what is produced and that is simply distributed to the highest bidder. So I consider supply and I consider demand, that problem is complex enough, deciding who will decide to export or import is a yet more complex problem that is beyond my ability, As far as looking at the World and net imports or exports, one needs to look at all nation to get a complete picture, not just the top net exporters.
A very simple explanation for why there would be less net exports from 2018 to 2019, is that a net importer (the US) increased output and decreased net imports as a result. The 2022 estimate is obviously a guess as we don’t have a lot of data at this point. May have claimed that exports would be a problem since 2005, so far not really a problem.
2022 was not a guess, it was an estimate based off of almost 8 months of data (2022 is in fact ~2/3s complete). Since we are 67% complete for 2022 we only have to make a very slight guess (~33%). So we know that 2022 will not be a significant breakout from the 2018-2021 downtrend.
Here’s a graph of decline rates, I agree with Laherre on a 5% average decline rate. He returned an email of mine some time ago and sounds like he definitely doesn’t forecast any production gains…what is with Argentina, are you getting desperate for production graphs with upward trends? I got a good laugh that you are highlighting Argentina when the rest of the world is in shambles from a oil production growth perspective, but I commend your optimistic nature…all things need balance I suppose…
Dennis – That is a fair request to look at all of the net exporters, so here’s a quick rundown of the ‘Other Net Exporters’.
The Others list includes:
Azerbaijan, Oman, Algeria, Angola, Chad, Rep. of Congo, Eq. Guinea, Gabon, Libya, Nigeria, and S. Sudan.
2021: 7.3 MBpD
2020: 6.9 MBpD
2019: 8.2 MBpD
2018: 8.2 MBpD
2017: 8.1 MBpD
So here’s all the world exports of crude oil (or Top 21 Exporters):
2021: 40.4 MBpD
2020: 39.5 MBpD
2019: 43.2 MBpD
2018: 44.5 MBpD
2017: 43.8 MBpD
With the exception of Libya, all of the Others had steady declines from 2017 to 2021.
It’s interesting that the Top 10 exporters account for >80% of oil exports of the combined 21 top exporters…
It’s also interesting that of ~90-100 MBpD, only 40 MBpD is exported, the other 50-60 MBpD are consumed where produced…
Bottom line is that the USA burns around 20 million barrels of oil per day, but only extracts 12 million barrels of crude oil per day from the lower 48, Alaska, and Gulf. It’s a creative mix of book-keeping for politicians to maintain the ruse that the USA is “oil independent”. I think one of the main book-keeping tricks is to claim that imported raw crude refined in the Gulf states is counted as USA produced.
Paul, thanks for saying this. I’m so sick of hearing about Merika’s Earl Independence but as I’m a lay person no one listens to me.
Kengeo,
As I explained in the post, I was including the 27 largest producers of C plus C in the World in April 2022, 10 of these nations are OPEC producers and we have output charts in the post above. In the last non-OPEC post, Ovi covered 16 non-OPEC producers so there was no reason to do the charts for those 16 nations that he just presented a week ago, the only nation not covered was Argentina, so for completeness I presented that nation so we have a chart for each of the 27 nations.
Laherrere in his recent paper (from 2022) has World output declining at 2.5% or less.
Paul,
I prefer to focus on crude oil, the US input of crude oil to refineries is about 16 Mb/d in recent years (excluding 2020).
I think what’s needed is a data flow or stocks&flows diagram to demonstrate what oil goes to refineries and so can see the net effect.
According to this
https://www.eia.gov/dnav/pet/hist/LeafHandler.ashx?n=PET&s=MTTNTUS2&f=M
the US is not a net importer – so why the discrepancy?
Thanks
WP
My understanding of the ‘net exporter’ fallacy is that the gaseous garbage (great for cars) being produced in the frac fields is unwanted by any refiner in the US and is exported to the nations who don’t mind receiving it, while the US imports crude for refining and too, exporting some of the resulting refined products. (Lower volume in, more volume out). Keeps bookkeepers busy.
Only have first 4 months of data for crude oil output for World.
Dennis – Silly me, I thought economics played an important role (exporters sell to importers), guess it’s just flat out production that matters… that’s great, every country can just produce their own oil and then there’s no need for global oil trade (unless of course you are one of ~50 countries who rely almost entirely on global oil exporters)…lol
Ken Geo,
The exports went down because production decreased due to OPEC cuts and pandemic, better to look at percentage of World production that is net exports.
This diminishment of exports is pretty much in line with Jeffrey Brown’s export land model as he had predicted years ago. https://en.wikipedia.org/wiki/Export_Land_Model
What strikes me is how much more oil could be exported if minds were focused on it. Much of the decline is based on geopolitical rather than geological considerations.So either the world doesn’t really need the oil, or it is just blindly stumbling towards disaster.
“So either the world doesn’t really need the oil, or it is just blindly stumbling towards disaster.” ~ Alim
Analysis of competing hypotheses
https://en.m.wikipedia.org/wiki/Analysis_of_competing_hypotheses
Psychology of Intelligence Analysis
https://www.ialeia.org/docs/Psychology_of_Intelligence_Analysis.pdf
Can’t forget the hungry club (countries who only consume, zero production):
Together they consume ~15 MBpD (I left out some low consumers, <0.1 MBpD)
Coincidentally, this is about the same amount that the Top 10 exporters consume ~13.9 MBpD.
Japan: 3.3 MBpD
Germany: 2.0 MBpD
France: 1.4 MBpD
Spain: 1.2 MBpD
Turkey: 0.9 MBpD
Netherlands: 0.8 MBpD
Belgium: 0.6 MBpD
S. Africa: 0.5 MBpD
Chile: 0.4 MBpD
Sweden: 0.3 MBpD
Finland, Greece, Hungary, Romania, Switzerland, Israel, Bangladesh, Hong Kong, Belarus, and Austria: ~0.2 MBpD
Ireland: 0.1 MBpD
Recap:
Top 10 exporters provide world with ~33 MBpD of which ~15 MBpD is consumed by non-producing countries listed above and the other ~18 MBpD is sent to countries that produce oil but do not export meaningful amounts…Those other non-exporting countries are self-sufficient for approximately half of the worlds overall oil supply.
It's no surprise then that Asia and Europe look particularly dependent on oil exports from Russia and the Middle East…
Missing Italy!
Kind of, Italy consumes around 1.0 MBpD and is 90% reliant on oil exporters (but not 100% reliant)…
And South Korea ….
Something like 19 or 20 million Americans are currently late on their power bill. Canceling student debt doesn’t really change the outlook for anybody because nobody has paid on their student debt in two years anyway.
If natural gas prices in the US spiked on par with those in Europe and Asia we’d likely have 60 million people late on their power bill.
High prices don’t work for consumers and 70% of GDP in US is consumption. Small window of time remaining for prices to stay high.
Prices can only go low via demand destruction in this current scenario.
And demand destruction on energy bills calls a massive recession, cutting back on spending everywhere else – driving the car longer, spend less at the mall and restaurant, pushing back the house improvements .
Yes this looks like the current situation while the central banks continue hiking interrest rates.
How does this compare to the historical average?
Short video from Nate Hagens.
https://youtu.be/l5NuN0rqV6s
the last part of his video is telling , in my view now I see no adults in the room at the top . Macron might have woken up a bit but the whole West response to the energy issue and the ukr/rus war was childlike.
Much I see in the MSM is child like too , its going to be an interesting winter
as I’ve posted before May 2021 – gas & leccy was £1170 soon to be £3600 .
I will be a reluctant consumer , like many others , and with the UK 80% serivce based then , well , interesting times ahead ……
In 2014 I published a book entitled “Twilight of Abundance”:https://www.amazon.com.au/Twilight-Abundance-Century-Nasty-Brutish/dp/1621571580
In 2022 Macron announces the “End of Abundance”. Coincidence? I think not.
Thanks for coming out Nostradamus.
So I provided an update: https://wentworthreport.com/macrons-end-of-abundance/
“It is worth repeating that global warming has yet to kill anybody ”
Bullshit
From your update:
“Humans are hardwired to believe in a religion (see Nicholas Wade’s The Faith Instinct) and global warming is the religion of choice for militant atheists.”
really??
rgds
WP
The steady drumbeat of Trump Trump Trump will keep the real news off the air. (May he burn in hell.)
“May he burn in hell”
https://www.youtube.com/watch?v=L0-tFahPVIU
I think it is great news there isn’t a hell.
Having a > 0% chance of being tortured eternally for being a fallible ape with no FREE WILL isn’t worth the risk IMO.
The historical Jesus himself (as portrayed in the Gospels, the earliest versions ) did not believe in Hell.
The Greek Philosopher Plato made that up ( or atleast that is who it is first attributed too).
What Macron publicly acknowledged-
“I believe that we are in the process of living through a tipping point or great upheaval. Firstly because we are living through… what could seem like the end of abundance,”
“The moment we are living … may seem to be structured by a series of crises, each more serious than the other,” Macron said, referring to the drought, fires and storms that have hit France during the summer as well as the Ukraine war and disruptions to global trade.
The level of affordability of all items and energy on the worlds markets has been enabled by a confluence of favorable factors that may have peaked in overall effect. Factors like labor productivity and globalization of manufacturing or resource supply, global cargo transport efficiency and global exchange of liquid fuels, digitization and computer management of complex systems, mechanization of farming, mining and manufacture, and resource exploitation such as accessible super giant oil fields, high grade copper ores, old growth forests, prime hydroelectric sites, or concentrated fisheries, are part of the big mix that contribute to a world in which billions have been able to afford items and services that would have been unbelievable science and social fiction in year 1800.
Throw into the mix the global demographic peak we are approaching, and the notion that global serviceable debt in real dollar terms may have peaked already, and we have the setup for conditions that may result in the global decline of average abundance.
In fact I think it is likely.
We all know that GDP is a very poor indicator of prosperity for individual people, and we all know that an incredibly high percentage of global wealth is sequestered by a small portion of the worlds wealthy (the top 1% of the top 1%).
I picture a crowded train overflowing with people hanging on to the sides and roof.
We have added tens of thousands of additional rail-cars over the decades. The train has gotten huge, but the capacity to keep people on board and the train rolling may now be at the beginning of a permanent reversal.
Disembarkment will not go over well.
“A 2021 Oxfam report found that collectively, the 10 richest men in the world owned more than the combined wealth of the bottom 3.1 billion people, almost half of the entire world population.”
Snowpiercer was a documentary, basically.
http://ethicsthroughliterature.weebly.com/uploads/3/1/6/2/31623635/the_tunnel_by_durrenmatt.pdf
Saludos
el mar
Note that in the charts above, Kuwait, SA and the UAE are producing at levels today that over the last five years have never been sustained for longer than six months.
At the same time OPEC production is currently 2.0 Mb/d below what appears to be their maximum sustainable production of 31 Mb/d. Note the number of times OPEC hit 31 Mb/d only to fall back to a lower level.
So we have 3 of the 4 biggest producers near capacity. One has to ask if there is any real spare capacity left within OPEC at this time. I think we will have the answer by the end of the year.
I redrew your line Dennis. Something must have hit your elbow when you were drawing it the first time, causing you to get it way off. 🤣
All that really matters is the inflection point in the late 2018 timeframe, new trend is down, not up and has now been established for nearly 4 years…current analysis should focus on August 2018 to present…once we have 5 years of clear downward trajectory then I think Dennis and any other optimists may come around…Dennis does that seem reasonable to you?
Yeah, I see what you mean.
Click on chart to enlarge in order to better see the decline.
It’s even more clear when you filter out the top 3 and it starts back in 2016…
I’d love to better understand when and how people expect all of these hypothetical oil reserves to reveal themselves…
It’s another huge mistake to think that reserve growth will continue into the future…
Anyway – 3,000 Gb URR puts the peak at 2016…likely been running on fumes/frac-oil since then…
Kengeo: I’d love to better understand when and how people expect all of these hypothetical oil reserves to reveal themselves…
They are not hypothetical; they are exactly where they have always been—in the ground. Oil recovery from the sedimentary basins was only 20% in the 80’s and 90’s. It has improved marginally since then, up to maybe 30-40%.
When you remove all the high power descriptors, which have put a veneer on the subject, you quickly realize that most of the EOR techniques are primitive: water-flooding being the best example.
Fact: there’s much more oil left in the ground than we’ve removed from the ground—at least in the US. A sedimentary basin was customarily exploited roughshod, with no regard for the scraps. Figuring that another 10% can be salvaged, I submit that the oil left in the ground in America is enough for our tail end needs. I do not think it is adequate to supply the world, or to even make the US much of a swing producer.
And the infrastructure is already in place.
“there’s much more oil left in the ground than we’ve removed from the ground—at least in the US.”
” I submit that the oil left in the ground in America is enough for our tail end needs.”
Not disagreeing.
I’d like to see Mike Shellman or any of the other oil pros respond to this statement.
I read on Mike’s site ( http://www.oilystuffblog.com) that we’ve got like 3-5 years of oil left in the US ( or atleast shale ).
https://www.oilystuffblog.com/forumstuff/forum-stuff/the-current-state-of-us-pdp-reserves
“But really, even calling these new tight oil barrels, “reserves,” is a stretch. At the moment the US has a PDP reserves to consumption rate ratio of 5, meaning we’ve got 5 years of oil left”
I am not an oil professional so I am confused
thanks!
Peak Avocado,
Regarding oil left in the ground – Gerry is right – while oil field recovery is highly variable, there is certainly alot of oil left in the ground. If a field has only had primary recovery, maybe only 20-40% of the oil is produced – if it’s a big enough field to justify water flood then maybe 40-60% can get produced. The unproduced oil is either residual oil (which can’t be produced via conventional recovery, and may be 20-30% of the original oil) or movable oil that is either mixed in with the encroaching aquifer water, or in conventional traps that the operator either doesn’t know are there, or are too small for the operator to pursue (either structural traps or stratigraphic traps).
Recovery techniques beyond water floods are less common – CO2 floods and others – they are expensive, and the field size needs to be big enough to support it. The highest recovery I’m familiar with is in the 60% range.
Regarding your comment that the US only has 5 years of oil left – my comment will be around the concept of proven reserves. Proven reserves in the US get updated every year, so it’s not as simple as saying you can look at proven reserves and annual production and say the US only has 5 years of proven reserves. Proven reserves are those that the operator is extremely confident will be produced, like 90% confident. What US oil companies do every year is look at their proven reserves, their production, and then, very often make revisions (which are usually positive), to their proven reserves for the next year (after subtracting the production). For example, say a field has 10 mmbo of proven reserves, and the company produced 2 mmbo during a year. Their proven reserves would drop to 8 mmbo, but, very often, they would do decline curve analysis on their producing wells, and determine that they are now very confident that they can add 1 mmbo to their proven reserves, so their proven reserves go from 8 to 9. This happens all the time and is the most common way positive reserves revisions occur. Another way reserves are added is when a project gets sanctioned (usually in the deepwater GOM). I’m less familiar with how this happens in the resource plays, but I suspect it happens when operators commit to future drilling, and are able to successfully convince the SEC that they will add proven reserves through that future drilling.
Mr. Avocado, I really appreciate you reading my stuff; thank you. I don’t want you to be confused.
My colleagues and I, all oil men working from a checkbook, and ‘truthful’ petroleum engineers (save one “token” economist who doesn’t know shit about oil economics), believe there are 3-5 years of Tier 1 and 2 drillable locations left in both sub basins of the Permian; probably closer to 3. That is what I meant by that.
Far too many analysts put far too much emphasis on probable and technically “recoverable” resources; they believe because somebody SAYS its in the ground it will actually come OUT of the ground. Historically that has NEVER been the case. So, I prefer to focus on proven reserves; a bird in the hand is worth more than three in the bush, and all that.
I wrote that little piece on OSB because of the distortion of facts regarding the contention that US and World reserves keep growing. That is not true. Proven producing reserves (PDP) from 2019-2020 in the US were DOWN 19%. PDP reserves in the US only provide our great nation with 5 years of consumption levels. By the way, everybody lies about reserves; nobody more so that the US tight oil industry. So it’s really a silly argument. I can declare tomorrow morning over coffee and donuts with little sprinkles that my reserves doubled overnight. It doesn’t mean anything. The KSA does that all the time, over donuts. We caught the US tight oil industry oily handed four years ago lying about its EUR’s. Don’t believe ANYTHING you read on the internet. A big portion of estimate reserves throughout the world is dung heap. Reserve Growth May Rulz, but only if you embrace the lying.
My industry has been awfully efficient over the past 80 years with squeezing oil, or blood, out the turnip. But when we have depleted the reservoir’s drive mechanism (like gas), the oil left in the rock becomes stuck, imobile, and is stranded. That’s all she wrote. We can sometimes think of something a little new and ring a few more BO out of it; its insignificant in the big scheme of things. Many conventional reservoirs can be drained 60%, even more, of oil in place; in spite of the bullshit only about 4-5% of OOIP in tight shale reservoirs can be recovered.
The commenter is correct, however… in the end, on the tail end of the fossil fuel era, it won’t be expensive, marginally unprofitable shale that will take us home…it will be left behind oil in old, depleted reservoirs that will be all we need. Good oil, the <35 API stuff, not the LTO crap. Like the stuff that Shallow Sand produces, the 1-3 BOPD stuff that's profitable, paid for, and steady as a rock…THAT's America's long term oil future! Tight oil was never anything but a short little speed bump in the fast lane to depletion. So, the next time you meet a stripper well operator, shake his hand; he, or she, is your future. Not Pioneer, or EOG…unless they find a continent of new drilling locations in the Wolfcamp, they are dead meat.
I hope this helps. Thanks again for visiting.
Mike
Peak avocado,
PDP reserves are Proved Developed Producing reserves. Each year some of these are extracted and also there are some new proved reserves that start producing oil and are added to PDP reserves. As to 3 to 5 years of Permian drilling locations, I think Mike Shellman is underestimating. This would be correct at $50/bo and $2.50/ MCF for natural gas, but at $100/bo and $5/MCF for natural gas there is potential for more profitable wells in the Permian basin in my opinion.
Time will tell who is correct on this point. If we assume 450 wells are completed per month on average for 48 months that would be 21600 new wells completed after May 2022, for comparison my guess is that about 109 thousand new wells will be completed in the Permian basin, if oil prices remain high until 2040 as I expect, this is about 5 times more wells than Mr Shellman expects. The future wells completed are assumed to be about 290 acres per well and about 36 million of 50 million prospective acres identified by the USGS are developed in my scenario which has an ERR of 63 Gb for the Permian basin.
Hi Mike.
Always like to see onshore US “non-shale” discussed.
CO2 flood is a big deal in the Permian that nobody really discusses much.
I have noticed the big guys have been selling off their non-operated WI in these big CO2 flood units recently, and they really don’t seem to be getting high bids.
I think the fact they are listing them on auctions is a sign of something, in the old days not everyone had a chance to bid. Usually the operator would want to buy the non-op interests.
For example, right now Cimarex has its 1% interest in the Denver Unit (operated by OXY) for sale. This CO2 flood was initiated by Shell in 1983. Over 1 billion cumulative BO and over 2 billion cumulative MCF. Gross production is down to 19,000 BOPD and 33,000 MCFPD. I think the cumulative includes pre CO2 flood, the production history goes back to 1964. Looks like 1964 was the year it was unitized for waterflood.
This interest is currently netting Cimarex parent around $300k per month. There are no bids yet, auction ends Wednesday.
Interesting the big boys are selling all of these. Also interesting they haven’t been able to make private deals with the operators of these.
Read an interesting article on this Unit, which is the largest in the Wasson Field. As of 2018 over 147 million metric tons of CO2 has been stored in the Denver Unit. In 2018 was producing 21k BOPD from 1,130 wells. San Andres formation. OOIP for the Wasson Field as a whole estimated at 6 billion. Discovered in 1936.
I would sure like to hear from people in the know in the Permian Basin why all of these are coming on the market and why they are having to resort to the auctions to sell them?
A clue might be expenses. In the first quarter of 2021, LOE was running around $25 per BOE. By the second quarter of 2022 that was $37 per BOE. Chemicals for a CO2 flood appear to be costly, and those costs absolutely blew out for this Unit in Q2, 2022.
Shallow sand,
Chart below of US L48 onshore conventional oil output, currently around 1638 kb/d (May 2022 data from EIA). US crude input to refineries is about 16 Mbpd. This oil is great, but comes up a little short. Not clear how much it could be ramped up. Average annual decline rate from Jan 2009 to May 2022 is about 3%.
Dennis.
I’m well aware how low US lower 48 onshore conventional production is.
What I’m driving at is wondering why it’s for sale and not bringing bids.
On this particular asset, I suspect much higher costs?
But wouldn’t that hold true on most oil assets?
LOE up from $25 to $37 yoy should be some info people here would find useful?
Shallow sand,
Yes that is useful information, but it is about Permian basin, rather than conventional oil in the US. I was just suggesting conventional output is decreasing at 3% per year and from 1600 kb/d is not top of mind for many. LOE has increased by about 48%, but oil prices have doubled (100% increase). Not sure why these properties are being sold, perhaps they just are not good leases.
Google OXY and EOR.
I wouldn’t say these are bad leases at all. The Denver Unit is part of how OXY plans on becoming “net zero” through carbon sequestration.
Ron,
It is fairly obvious that decline after 2018 was due to OPEC cuts in 2019 and then the Pandemic in 2020 and 2021, I note you forgot to extenf the obvious trend from June 2020 to April 2022. My expectation is that the average annual increase from those 27 nations will be between 635 an 1272 kb/d with a best guess of about 953 kb/d, this will be offeset by average annual decline from the rest of the World of about 152 kb/d so that World output will increase at about 800 kb/d from 2023 to 2026 and may slow a bit before peaking in 2028 plus or minus one year at around 85 Mb/d (plus or minus 1 Mb/d).
Shallow Sand,
I saw the same Cimarex listing for the auction… Energynet is a good platform for transactions… I would say it is much better typically than trying to market this on your own.
I don’t feel like there are an abnormal number of properties currently on the market. There are always plenty of properties on the market… What motivates a sale of property is a unique set of circumstances that motivate the seller. With prices high, it’s not a bad time to shed non-core and build powder. It also isn’t a game-changer either way for Cimarex… margin of error size for them. Maybe just cleaning house after the merger with Cabot to reallocate the capital stored in that asset.
Also, I wouldn’t read too much into the current “no bids”… One, this is a bigger sized interest and there likely aren’t going to be that many bidders for what this will likely sell for. Second, in my experience of buying and selling on Energynet for 15+ years, most of the bids come crashing though in the last 90 seconds of bidding. Why show your hand early?
Just my opinions, but hope they help a bit.
Thanks for the reply!
Yes, most bids do come flying in at the end.
Maybe that’s the explanation.
It seems like I have seen more interests in big units like this, SACROC, etc., than in the past, on energynet. But maybe not.
It is interesting to see how much expenses have went up for the Denver Unit from Jan., 2021 to April, 2022. Chemicals alone up from $7.5 million to $12.5 million per month.
I guess I’m surprised the sellers don’t go to the operator first and work a deal w them. We always try to buy up ORRI in the lease we operate. We also have had non-ops in the past that we have bought out.
Do you how the negations go between these big companies? Maybe Cimarex wants big$$ that OXY wasn’t willing to pay?
Chevron had been selling a lot of conventional production in the Permian Basin through both energynet and other sites. I haven’t seen that so much recently since prices went up this year.
Noticed there is a bid. So I bet you are correct, the bids will come flying in near the end.
I’ll try to watch it if I have the time then.
Edit: Just checked in, already up to $5.1 million.
Kengeo,
I think its too early to say there is a new trend. The multi-decadal trend would still signify an uptrend. There is a small possibility we are also at a plateau.
Right now the only thing i can see that can maintain a continued downtrend in the short term is a severe recession.
Iron Mike, I don’t think you undersrand geology. The upward trend that ended in 2018, and was already a downward trend when the pandemic suppressed demand in early 2020, is continuing.
You need to look at each individual producer. A very few are still increasing production. The vast majority are either in plateau or in serious decline.
The peak was four years ago. If you followed the production of each individual producing nation, as I do, you would realize that.
Ron,
You definitely are much more knowledgable than me in this field.
So you don’t think some countries can increase production enough to beat the 2018 peak ? Even at higher oil prices or with more sophisticated technologies ? You don’t give that any probability ?
Iron Mike, higher oil prices can certainly increase production somewhat. If there is oil out there that is uneconomical to produce at current prices, then if the price goes up high enough, and if there is a reason producers think those prices will stay high, then some very hard to produce oil will then begin to be developed. Of course that will take years. And understand prices will be high because production is falling. It is my opinion that there will not be enough hard to produce oil to make up for the decline fields. Rember, those fields have already started to decline.
More sophisticated technologies? And just what might that be. Every technology available to producers is already in use. Just what other more sophisticated technology do you see coming down the line in the next few years?
Google: “what percentage of oil is produced from giant fields”
The world’s 507 giant oil fields comprise a little over one percent of all oil fields, but produce 60 percent of current world supply (2005). (A giant field is defined as having more than 500 million barrels of ultimately recoverable resources of conventional crude. Heavy oil deposits are not included in the study.)
Those old fields were already in decline in 2005 but massivee infill drilling, that is creaming the top of the reservoir, has kept them almost steady for over 15 years now. Now almost all are headed for the Seneca cliff. Higher prices or sophisticated technologies will not even come close to preventing it.
Ron,
I am split in my views let me elaborate.
I agree that the low hanging fruits of the oil tree has been plucked. Part of me is in complete agreement with your views and thinks we are close to the downslope or seneca cliff scenario of not just of oil production but civilisation as we know it.
However in saying that we know there is massive reserves of unconventional oil around the world.
https://www.sciencedirect.com/topics/earth-and-planetary-sciences/unconventional-oil-resource
This paper says we can add 100-200 years worth of crude reserves if unconventional fields are developed but they do acknowledge the EROI will be bad. And of course prices have to be sustainably high.
So the other part of me thinks there is a possibility or small probability that unconventionals might be produced regardless of negative EROI. Which might plateau or even beat the peak of 2018. This part of me thinks humans would go to great lengths to squeeze all the oil we can get from the earth to sustain this drug addiction called civilisation.
May the lay person comment?
Quote: we know there is massive reserves of unconventional oil around the world.
So what?
Isn’t it the point that it’s the RATE at which it can be produced and the COST that matter, not how “massive” the reserve is?
A fat tail is still a tail.
This shit is so complicated. I have to keep it simple.
Mike – Nice work, you are correct, the rate is the key…economies don’t work very well running in reverse…high energy prices also don’t work for majority of people…majority of people are the economy…I feel like this is 2008 all over again…but 14 years later…
Mike B,
In the past, people have said unconventional oil resources could not be developed quickly enough to make a difference back in 2005 to 2008.
This view proved to be wrong.
As to the future, we will see.
Iron Mike – Ok great we disagree…at what point would you be comfortable declaring a trend (one way or another?)?
I totally get it that covid threw everyone off, it’s difficult to say for sure at what point a country has recovered…
I guess the easiest way to test the data is compare the 2005-2010 timeframe to the 2015-2020 timeframe.
Here’s a chart that does just that…do we believe that some future event will cause the world to be oversupplied? Right now it doesn’t really seem like we are trending towards oversupply…
Financial crisis 2.0 seems to be on the horizon though…
Further oil growth (or plateau) seems very unlikely. In a shrinking oil market, certain consumers get priced out while others who can afford to continue buying…but a large component of oil demand is goes to the supply chain and commercial goods, if there’s no one willing to spend the money then the oil consumption is muted. Ultimately the market should balance between demand destruction due to high price and undersupply issues related to demand and/or low prices.
A look at the 1970s to early 1980s might shed some light on what happened back then…
Kengeo,
A huge amount of oil was taken off the World market by the Iranian revolution in 1979/1980 and the Iran/Iraq war that followed. That was a major supply shock which is unlikely to be reproduced in the near term.
About 5000 kb/d was taken off a World Market producing 65 Mb/d in about a year (1980) or about 8% of World output, Output from Iran and Iraq combined decreased from about 7000 kb/d to 2000 Kb/d from Dec 1979 to Dec 1980.
Ken Geo,
Or we could focus on June 2020 to April 2022. Hmm, did you miss the OPEC cuts in 2019 or the Pandemic in 2020?
@Ron:
“Those old fields were already in decline in 2005 but massive infill drilling, that is creaming the top of the reservoir, has kept them almost steady for over 15 years now. Now almost all are headed for the Seneca cliff.”
That’s exactly what me worries, too. The world production is not bell shaped, it’s heavily distorted. The same distortion that is happening in the ground via infill drilling, is also happening in the financial markets who heavily favoured upfront investments into fracking and renewables with low interest rates. Declining giant oil fields and rising interest rates have the same root cause: future flow of energy and money is restrained and geological and financial infills get only that far.
Meanwhile, the pandemic didn’t stop depletion, and with each year going by it will be more difficult for the secondary peak to become significant.
Ron,
Excel lets you add a trendline to the data, that is what the line shows, it is based on ordinary least squares regression on the data. See
https://en.wikipedia.org/wiki/Ordinary_least_squares
This is a standard technique which most high school students are familiar with.
Well done dennis.
Yes, thanks for all the work Dennis.
Tran and Schinzy,
Thanks.
he two largest producers in the Bakken are Continental Resources (CLR) and Chord Energy, which is the result of a merger this year between Oasis and Whiting. Together they produce about a third of Bakken’s oil and most of their production comes from there. The charts below show their proven reserve discoveries and revisions as reported in their annual reports. On average the negative revisions have removed about 40% of the discoveries so far, but this may increase as discoveries are plateauing while revisions appear to be going increasingly negative. The pattern followed is that there are large drops as prices drop that are not fully recovered in higher price years (including last year).
In conventional production these revisions always trend positive because they capture movement of probable to proven resources. Typically probable reserves may be around 50% of proven, initially, with combined proven plus probable giving the best estimate of the final recovered reserves. I do not know how probable reserves are used. In LTO basins, but if it is similar to conventional fields then negative revisions would imply all probable reserves have proved unrecoverable, this would mean initial reserve estimates were two and a half times overstated, and may be more than three once all revisions have been included. This may explain some of the risible reserve numbers that EIA and USGS produce.
Overall reserves and production are now falling as shown in the third chart.
Discoveries
Revisions
Reserves and Production
Thx Mr Kaplan,
Great insights as always.
GEORGE,
Nice charts. by the way, here is the difference between the reporting on Bakken oil production.
EIA Drilling Productivity Report May 2022 Bakken = 1,172,000 bd
EIA Tight Oil Production by Region May 2022 Bakken = 1,138,000 bd
SHALEPROFILE Total Oil Production May 2022 Bakken = 1,032,453 bd
Shaleprofile has the best premium data from ND DMR… EIA is just 100,000 bd off… LOL.
steve
Steve.
The drilling productivity report includes both conventional and unconventional output in the region. The shale profile data is excellent but includes only horizontal oil wells from North Dakota Bakken, EIA data includes output from North Dakota and Montana and includes both vertical and horizontal tight oil wells.
Dennis,
Even the EIA North Dakota State Oil Production Figures for May is 1,049,000 bd… TOTAL.
https://www.eia.gov/state/print.php?sid=ND
steve
Steve,
Both of the EIA reports inclus North Dakota and Montana, Shaleprofile includes only North Dakota horizontal wells.
The Gainers have stopped gaining
The spike you see for April 2020 is Saudi Arabia, Kuwait, and the UAE preparing for the pandemic quota cuts. They do this by doing no maintenance during that month and emptying their storage tanks. In other words, OPEC was producing every possible barrel they could produce during that month. Of course, the rest of the world was producing flat out also.
The gainers have stopped gaining. Some may doubt this, but it will be very obvious soon.
But the losers are still losing
Here is a graph of all nations that have declined in production since January 2013. Obviously, this will continue. The gainers are no longer gaining but the losers are still losing. And we all know what this means.
Societal collapse is what it means. Most, if not all, the losers will be left to die because no-one’s got enough soul to give up their oil share.
Ron – I think this is a key chart. Nice job, if you had to guess how much this group is losing each year, for the next ~3 years, what range would you give it (I know they’ve been in rebound from Covid, so this is an impossible question)? My WAG is 5% +/- 2%… (but I lean towards ~8-9% over next 3-5 years…)…
Well, the decline rate is currently only about 1.6%, or about 700,000 barrels per day per year. That could speed up a bit though. A bigger story is the gainers. They will likely peak this year, somewhere around their previous peak. At any rate, I believe everything will be obvious, and undeniable, by December of this year.
An alternative way to look at decline of smaller oil producers is to look at the 12 top oil producers by average output from Jan 2009 to April 2022 and then deduct the C plus C output of those top 12 producers from the rest of the World. To look at decline rate we take the natural log of World C plus C minus top 12 producers. The annual decline rate for the smaller producers is 1.6% per year.
On chart above I labelled the chart 2009-2022, a mistake on my part, the trend line is for Jan 2011 to April 2022, I also stated in the comment that the trendline was for Jan 2009 to April 2022 data, another mistake on my part.
The corrected chart below uses Jan 2009 to April 2022 data for World minus top 12 C plus C producers based on average output from Jan 2009 to April 2022. The average annual decline rate is 1.9% for this period. My apologies for my error.
Dennis – Let’s talk about Argentina though! Lol
You nailed it Dennis – The oil production tide falls steadily and while all of the smaller fields decline slowly, the hero fields decline rapidly because that’s just what they do, ~7%….Big exporters can’t keep this up forever, China and Europe are in big trouble…US too but a lesser degree, apparently drops of oil are all that we need (according to some on this forum), that mad max future sounds like a lot of fun…
Kengeo,
Top 12 C plus C producers from Jan 2009 to Dec 2018 and rest of World C plus C producers over same period.
Top 12 increased at an average annual rate of 1452 kb/d and rest of world declined at an average annual rate of 354 kb/d, the net increase in World C plus C output was at an average annual rate of roughly 1100 kb/d. Decline since December 2018 was OPEC cuts in 2019 and pandemic lack of demand in 2020 and 2021. In the last 16 months World C plus C output has increased by about 4000 kb/d (an annual rate of 3000 kb/d).
The decline rate for the rest of the World (World minus top 12 C plus C producers) was 1.6% over the Jan 2009 to Dec 2018 period.
Top 12 producers (ranked by average output from Jan 2009 to April 2022) are:
Russia
Saudi Arabia
United States
China
Iraq
Canada
Iran
United Arab Emirates
Kuwait
Brazil
Mexico
Nigeria
Venezuela
Norway
Top 12 producers (ranked by average output from Jan 2009 to April 2022) are:…
Well, perhaps, but that’s not what your chart incicatse. Your chart goes from 2009 through 2018. I t seems to stop at the beginning of 2019. WhY?
Dennis, I have the data through April 2022, and you do also. Why does your chart stop with December 2018???????
Ron,
The chart stops in Dec 2018 because OPEC made cuts in 2019 and the pandemic occurred, these events caused output to decrease after 2018 as you pointed out earlier from 2019 to 2020, then output recovered. The point was to look at the rate of increase from Jan 2009 to Dec 2018, so that is what I presented.
Chart below has Jan 2009 to April 2022
Dennis – Why was there essentially no growth from 16-18, what external event is responsible for that?
Kengeo,
Output was adequate to satisfy demand, prices were relatively low, that’s the reason for OPEC cut in 2019.
From Jan 2011 to Dec 2014 average Brent price was $108/bo, from Jan 2015 to Dec 2018 the average Brent price was $55/bo.
Also the Top 12 producers increased output at an annual rate pf 795 kb/d from Jan 2015 to Dec 2018, even though prices were relatively low relative to the previous 4 years.
The Houthi air strike on Abqaiq & Khurais, using unmanned aircraft launched from the beds of Toyota pickups, with coordinates keyed into the guidance system, should have alarmed the world of a hazardous global oil market. It didn’t.
The “Blue Sky” event over NYC, followed by a major pipeline computer ransomware gig, should have alerted the US to the frailty of its grid. It didn’t.
Putin’s older brother died of privation in the Siege of Leningrad, which possibly should have been a clue that NG could be weaponized by a Putin the Younger holding a grudge. It didn’t.
There is no such thing as a wake up call. Period.
Oil is a precious resource, requiring a meticulous set of circumstances for proper manufacture. Not so with NG, which pretty well forms whenever something falls over dead. We will soon be down to the drabs and dribbles of high quality oil. It’s coming at us pretty hard. The most oil-starved areas of the world will suffer the most, at first, and during this time geopolitical hegemony may well change. A rogue could become king.
It may not be a madmax world but it will seem like it. And that’s when it will be nice to have a map of all the poor tired oil fields—conventional wells mostly drilled into structural oil traps, hooked up to gathering stations and pipelines. That will be our field of dreams. There’s more than just a few drops down there. Enough to save us, I suspect. But we have to be pushed into it.
When production from the giant oil traps goes over the much ballyhooed Seneca Cliff, every drop counts. Mr. Shellman is right: shake the hand of the guy who keeps the old stripper wells running. And fortunately, we also have some room to drill low cost (relatively) infill wells that didn’t seem worth the effort when oil was $10 (1990).
Fun? It’s going to be fun to be alive and watch this stuff. I was born during the Second War. REA (Rural Electric) came in. Then indoor plumbing. I’ve watched the world burn through its oil supply. It never dawned on me that drip gas wasn’t high octane. Men on the moon?—hell yes, beam em up. Private jets? No problemo. Clouds where you store thousands of worthless photos and data? Bring ‘em on. Can anyone tell me how much electricity those big cloud databanks use? Bill gates won’t tell you. He’d be just as willing to tell you his carbon footprint from his G650 and super yacht.
Oil price of $25? That’s what got us into this pickle—unnaturally cheap oil. If I’m wrong, and we have plenty, then maybe it should be at $25. But if I’m right—and I’m pretty sure I am— then we’re headed for $150 on our way to $200. And also back to the future.
Excellent post Gerry!
I think an underrated aspect of Peak Oil is that Oil Infrastructure is a sitting duck militarily.
The US Navy could easily sink every oil tanker on the planet. So could the Russians, British, Chinese, etc.
Now with Drone Technology, smaller players and radicals can easily destroy oil infrastructure.
When fringe groups figure out that oil is declining, expect the apocalypticists to see an opportunity!
” Clouds where you store thousands of worthless photos and data? Bring ‘em on.”
Take a picture of yourself going to McDonald’s. You will later see an advertisement for McDonald’s on your iPhone.
Big $$ business.
If you are given something for “free” (gmail? dropbox?) then YOU are the product.
After $1.9 Trillion Giveaway to Rich, McConnell Calls Debt Relief for Working Class ‘Slap in the Face’.
Big $$ business.
Biden campaigned on a platform of up to $125,000 debt relief per undergrad, and won. Big Business is seldom the paramount concern of a democracy.
“Now with Drone Technology, smaller players and radicals can easily destroy oil infrastructure.” ~ PA
3D printing and drones is gonna be the way to go for any fringe eco’s; lots of showcasing in Ukraine.
How do you defend a pipeline that extends thru more than one country?
And another thing…
Don’t assume a man like Putin might not arm these radicals with the technology to take out your refineries……….
Getting the propellants & warhead is the tricky bit. It’s not hard to fab up the rest of it; as these pro Ukraine peeps are doing with 3D printing. It’s all rather unsettling.
https://youtube.com/shorts/aknzIAM2YyM?feature=share
https://youtube.com/shorts/8bUpd1ooE5s?feature=share
After all….
NATO has given the Ukraine “Javelin” anti – tank missiles and “Stinger” anti – helicopter missiles.
Why wouldn’t Putin start arming radicals in the Middle East with similar weapons in
the “disguise” of religious radicalism.
Anti – oil infrastructure missiles
I hate Putin. But it seems obvious to me.
NATO are oil importers!
“Why wouldn’t Putin start arming radicals in the Middle East with similar weapons in”
Doesn’t need to.
Iran already is doing that, such as Hezbollah and in Yemen and Syria.
MAD ( Mutually Assured Destruction ) would still be the “game theory” of the main countries here.
MAD worked with Nukes because only “sensible” countries with lots of wealth and resources and science/engineering could pull it off.
With drones….not so much anymore. And in a declining oil environment….some organisations are going to start saying….NOW OR NEVER
“There is no such thing as a wake up call.”
I understand why you say this, but there ARE such things as wake up calls. When Hitler’s armies marched across the first couple of borders, Europe and Asia got their wake up calls.
And when the Japanese attacked Pearl Harbor, we got ours, here in Yankee Land.
I have remarked probably a dozen times in this forum that neither the Russians nor the Germans have forgotten the Siege of Stalingrad. The Russians were mostly keeping quiet about it, and the Germans were mostly pretending to themselves that it never happened………. up until a few months back.
It’s really hard to say what it will take to convince Western Europe and countries such as Japan and Korea to do what needs to be done, what MUST be done…….. going to a wartime economic footing so as to get control of their energy problems. Not a single one of them, so far as I can see, is doing so. Progress is obviously being made on the renewables and conservation front, but that progress could come at least two or three times as fast, if we were to put our minds and our backs into the job.
The very large majority of people known to me personally don’t get it…… well educated, or not. We’ve had it so good, for so long, that no more than one person out of twenty known to me is willing to SERIOUSLY consider the possibility that the good times based on using up Mother Nature’s one time gifts, from soil to oil, must eventually come to an end…… and that that end may well be no more than five or ten years down the road.
When I was a little kid, one of the neighbors made a regular Saturday morning run to town in his old Chevy truck, at the same time every week. If you were standing beside the road with a dime, he would drop you off at any of two or three places in mythical Mayberry NC, the nearest town, and pick you up and bring you back home two hours later. Six dimes paid for his gas.
I personally don’t have any problem at all believing that if we get our next FULL GROWN wake up call SOON ENOUGH, we can get used to driving micro mini electric cars with only a fifty to seventy five mile range, which is ample for the every day needs of ninety plus percent of us.
But Sky Daddy help us, a substantial percentage of the people who DO GET IT, in terms of the environment, have their heads so far up their butts that they can’t understand, or perhaps refuse to understand, that if we DON’T mine rare earths, that if we DON’T build long distance power lines and wind and solar farms out the ying yang, and DON’T continue using manufactured fertilizers and pesticides, etc etc etc, we’re going over that cliff FOR DAMNED SURE….. and that the natural world they’re determined to save will be destroyed wholesale during the death throes of modern civilization.
Damned if we do, damned if we don’t. Right now I’m afraid Ron is right, that a world wide crash and burn scenario is inevitable.
But if we get that wake up call, maybe we can pull thru. Maybe we will get our asses in gear before it’s too late. Maybe some of us in some countries can continue to enjoy a modern industrial based life style. The odds are pretty high that Ron and I won’t live long enough to see for ourselves, lol.
Thanks for wise words OFM.
Wholeheartedly agree…including- “Progress is obviously being made on the renewables and conservation front, but that progress could come at least two or three times as fast, if we were to put our minds and our backs into the job.” Probably 5 times as fast.
The Golden Age of Russian Oil Nears an End
This article was published in 2020 and requires registration.
I could not capture the legend, it made the graph too large to post. But this is the three biggies.
Orange = Condensate
Blue = West Siberia and Ural Basin Greenfields
Red = West Siberia and Ural Basin Brownfields
Notice that in April of 2020, when this article was written, West Siberia and Ural Basin produced almost all of Russian oil. They expect these old fields to decline by almost 3 million barrels per day by 2025. However they expected greenfields, (new fields), to ramp up rapidly replace that decline in the old brownfields. After the invasion, there is just no way that is going to happen. Well, that’s my opinion anyway.
If they can get close to this, it is no cliff.
Decline form 11 to 9 Mbpd over 20 years.
Like you said maybe they won’t achieve it, and will drop to 7 or 8.
Thats not a cliff either (in my understanding of the slope of cliffs).
Not to say that there won’t be much more rapid declines of production in other exporting countries.
You are looking at just one country. Almost every other country is also declining. A drop o 25% of world production in 5 years is most definitely a cliff. I am not saying that will happen in the next 5 years, but it is a distinct possibility.
True Ron, but a more likely time frame
for a global 25 % decline in oil production is out into the 2030’s,
don’t you think?
Can the ‘world’ handle an average 3%/yr decline?
I do suspect that oil available for export will decline much faster than overall global production.
And in this scenario there will be two sets of countries that will struggle mightily- those that are simply poor and were struggling to afford base living needs of the population prior to oil peak,
and secondly those countries that have heavy economic dependence on oil import but don’t have favored country relationship with exporting countries.
How quickly they can get their economies electrified, which can blunt the loss of liquid fuels, will play a big role in the degree of severity of the outcomes.
Thing is, this was predicated on Russia having access to the service companies they had working their fields prior to Ukraine deciding to demolish their military.
We shall see, but I have reservations over how well they maintain this.
Good point.
“Efforts to draw Russia into the democratic fold of its Western neighbors through decades of economic integration and trillions of dollars of energy trade failed to prevent a brutal, senseless war in Ukraine, as well as the Kremlin’s weaponization of energy supplies across Europe. As a result, European energy systems are transforming in record time toward operating without Russian oil and gas. This unprecedented shift is neither cheap nor easy, and will take years to achieve in countries hooked on Russian energy and reliant on carbon-intensive economies.
In the meantime, skyrocketing energy costs, mandated curtailments, and general uncertainty around energy supplies this winter will fuel temptations to slide back into the yoke of Russian energy dependence. But the risks of returning to the status quo of energy diplomacy with Russia monumentally outweigh any short-term relief that the Kremlin could offer through its supply blackmail. That’s because Moscow’s nationalization of the Russian energy industry leaves little room for market-based decisions, while geopolitical priorities (often aggressive ones) take precedent. Supply shut-offs and curtailment across Europe have shattered Russia’s veneer of reliability, while the country has doubled down on the unabated fossil-fuel economy rather than investing in diversification.”
When oil is at $200/bbl and their opex is $35/bbl, Russia is going to be rolling in money. Plenty of money for Su-57s and T-14s and pensions – guns and butter. Trouble is they will also be very vindictive and nasty. Thank Victoria Nuland.
” Thank Victoria Nuland.”
Suppose you explain this remark…….
As Russia bombs and destroys the fuck out of Ukraine. Blaming Victoria Nuland for Russian policy that “will also be very vindictive and nasty” is ignorant and stupid.
Most likely from a spineless coward. Who only cares or stands for themselves.
Neville Chamberlain appeasement was the name given to Britain’s policy in the 1930s of allowing Hitler to expand German territory unchecked. Most closely associated with British Prime Minister Neville Chamberlain, it is now widely discredited as a policy of weakness.
I wrote it up here. https://www.americanthinker.com/articles/2022/03/russia_china_the_torpedoes_circle_back.html
Bear in mind that 20 years ago Russia wanted to join NATO but were knocked back by the mean girls of the State Department. Now, when China goes to war with us and our values, Russia will be at best indifferent. At worst they will provide some extra oil to the Chicom war machine. Always ally with No 2 against No 1 on the Eurasian landmass. Too late for that and the result will be counted in our dead.
The AMERICAN THINKER is a right wing troll outfit. Anybody who takes it seriously is an idiot, or else simply abysmally ignorant.
Here’s a quote from a recent article.
” But today the FBI has morphed into a campaign arm of the Democrat Party, attempting to influence elections in favor of their preferred candidates, acting more like the East German Stasi or Soviet KGB rather than the premier law enforcement agency in the world.”
Are you actually on trump’s payroll, David Archibald?
Or do you do push this shit for free, like some of my acquaintances who believe trump has a fourth seat in Heaven, the other three being occupied by God, Jesus, and Holy Mary?
Even the dumbest of my acquaintances, excepting the out of sight down the rabbit hold OLD religious individuals, now understand that trump is nothing more and nothing less than an outright scumbag and con man, although they are usually unwilling to admit it, having supported him in the past.
Ron, Dennis, I’m sorry I’m posting so much off topic stuff in this thread, but you can never tell who is reading it. Some of my grade school dropout neighbors actually believe in Peak Oil, etc, and talk to me about this site. Some of the better educated ones who are right wingers, do nevertheless understand that resource depletion is slowly killing us, world wide, and even read some of it sometimes.
American Thinker LMFAO; it’s output is rather predictable once you grasp it’s apparent ideology.
Stagnant ideals for stagnant minds, many of which perhaps find David to be quite smart.
“Bear in mind that 20 years ago Russia wanted to join NATO but were knocked back by the mean girls of the State Department.” ~ David Archibald
It would do you no harm to learn, David, that, in reality, on Nov. 4, 2021 George Robertson, a former UK Labour defence secretary who led NATO between 1999 and 2003, told The Guardian that Putin made it clear at their first meeting that he wanted Russia to be part of western Europe. The account chimes with what Putin told the late David Frost in a BBC interview shortly before he was first inaugurated as Russian president more than 21 years ago. Putin told Frost he would not rule out joining Nato “if and when Russia’s views are taken into account as those of an equal partner”. After the Orange Revolution street protests in Ukraine in 2004, Putin became increasingly suspicious of the west, which he blamed for funding pro-democracy NGOs. He was further angered by Nato’s continuing expansion into central and eastern Europe: Romania, Bulgaria, Slovakia, Slovenia, Latvia, Estonia and Lithuania chose to join the alliance in 2004; Croatia and Albania followed in 2009.
Overall, I rate the American Thinker as “Questionable”, based on extreme right-wing bias, promotion of conspiracy theories/pseudoscience, use of poor sources, and several failed fact checks.
American Thinker lol more like Aussie Wanker.
“is a right wing troll outfit.”
Well that is the narrow lane that D Archibald doesn’t stray from, so there is that consistency.
EIA has excellent write-ups on the energy situation of individual countries.
Here is the link to one example, a country that can be seen as a canary in the coal mine (literally)
on the affects of being dependent on imported energy with an industrial economy as well as a rapidly ageing population, and thus certainly bears close watching.
https://www.eia.gov/international/analysis/country/KOR
I’m always eager to see optimism at work but I am also a pragmatist. We are at a dispositive point in world oil supply, staring at decline of existing reservoirs and abbreviated discovery of new oil. We’ve never been here before.
KSA is the elephant in the room and is in serious shape. Talk about water flooding, they have by now pumped billions of gallons of seawater into their biggest reservoir. Now, alas, it’s twilight in the desert. Just listen to their oil minister’s remarks.
Russia is in very deep doodoo. The big project on Sakhalin Island takes an army of engineers, and they don’t speak Russian. Siberian permafrost is turning to muck due to global warming and the virtual explosion of methane tunnels that had been long buried underground. Infrastructure built atop permafrost is sinking. Methane is being vented straight out of the ground—by Mother Nature. The giant methane blowout craters are numbered on GPS: they are up to C27. These are due to coalescence of millions of little methane tubes that underlie Siberia.
New oil? Well there’s Kashagan—a massive reservoir—but it’s deep under the Caspian, extremely high in sulfur, and for a number of reasons basically unmarketable. Then there’s the big Exxon find off the coast of Guyana. It’s so gassy that they had to pause to get special platforms manufactured to handle gargantuan volumes. Theta, Pantheon’s conventional oil discovery on the Alaskan N Slope (just read it off the Oilystuffblog.com site), undoubtedly comes with issues too.
Hypothetically let’s say that in 5 years KSA oil is down by 3 mbod and Russian oil is down by a similar amount. Mike Shellman has told us repeatedly that the Permian is good for no more than 5 years until all those thousands of wells have petered-out, so dock US oil by 3Mm. The other OPEC countries are apt to lose some production. It’s very easy to get to a 10% drop in 5 years. And decline begets decline—which is the whole thesis behind the Seneca Cliff.
If the world is lucky, alternative energy will come onto the market in lockstep with global decline of oil. But it’s a giant experiment, one that will likely be catalyzed by imponderables (war, famine, pandemic, perhaps even a thinning of the population). This looks dicey to me.
I don’t have any curves to back me up—no one does. Just a warning: the oil market is a hall of mirrors. You have to be careful which one you trust.
To be clear, what I have said is that I believe there is only 3-5 years left of Tier 1 and 2 drilling locations in the both sub-basins of the Permian Basin; Mr. Coyne, once again, is twisting my words to simply be argumentative. We have good historical data on flank, Tier 3 and 4 well productivity in Permian goat pasture; it could very well take MORE than 140,000 more (poorer) wells to achieve some of the theoretical models randomly thrown around. So what? Or rather, then what?
Something like 50% of all US tight oil wells, 95 % of which were drilled in core areas, make less than 40 BOPD, and boat loads of water, on AF, with terminal decline rates of 12-14%. Further, late life decline rates, in gassy, overdrilled core areas, are accelerating. Lea and Eddy Counties, for instance.
Sadly, there also there seems to be some inability to comprehend my writing about PDP reserves declining in the US. Yes, some get depleted, yes, some are replaced… but overall PDP is still going down; from 2019-2020 PDP reserves in the US declined 19% YOY. Google it. That is going to get worse; cash dividends, stock buy-backs, and CEO compensations are sucking future drilling CAPEX out of companies and negatively affecting reserve replacement ratios, something imperative to tight oil sustainability. I therefore don’t believe tight oil PDP reserves are worth much to our country’s long term future.
I would warn people that because some outfit is paid to ‘say’ there are X barrels of technically recoverable oil in certain Permian Basin producing benches over a vast area, it does NOT mean that stuff will come out of the ground, regardless of what product prices are. That is a very unlearned and intentionally deceiving allegation that masks the reality of affordable oil scarcity and how incredibly reckless our country’s energy policies are. To suggest, for instance, the the tight oil we export to foreign countries is “useless” to our country, or that oil exports have not proven to be a “problem yet,” is whacko. COVID is not too bad either. At first.
US PDP reserves decreased by about 9.4% in 2020 from 2019 (29.7 Gb in 2019 and 26.9 Gb in 2020). Reserves sometimes decrease when oil prices drop as they did in 2020.
https://www.worldoil.com/magazine/2022/february-2022/special-focus/2022-forecast-u-s-proved-reserves-drop-sharply/
Sorry Mike,
Yes you said tier 1 and tier 2 locations, I don’t have any data on those numbers, only data on average output of wells by county, or formation. As to PDP reserves, those are different from proved. Info at page below
https://www.eia.gov/petroleum/data.php#crude
I use crude plus condensate at link below
https://www.eia.gov/dnav/pet/pet_crd_cplc_dcu_NUS_a.htm
and non producing reserves at link below
https://www.eia.gov/dnav/pet/PET_CRD_NPROD_DCU_NUS_A.htm
I use C plus C data for both and proved producing reserves are proved minus proved non-producing reserves.
Clearly you know this, but many do not. The chart I posted earlier uses the data I outline in this comment.
The 19% drop was for proved reserves, PDP reserves dropped about 9.4% in 2020.
We may see PDP reserves drop a bit more in 2021 and then increase in 2022 due to higher oil prices, similar to the experience after oil prices dropped in 2014-2016
Without Repeating Myself…
The problem the world faces is similar to running a car at 100 mph. Cars are not designed to run at 100 mph. If one drove a car at 100 mph for an extended period, tires would blow out and components would break down.
With the world trying to run at 100 mbd, it is the same dynamic. Why. Because the world is losing between 10-11 mbd of production EACH & EVERY YEAR that needs to be replaced.
Either we accept this, or rather decide to employ HOPIUM that suggests LOUSY TECHNICAL RECOVERABLE RESOURCES will save us for another 1-2 decades before the collapse occurs. Unfortunately, the collapse will happen sooner because HOPIUM is not a good strategy.
However, mortals will continue to employ HOPIUM due to the FIRST STAGE OF GRIEF…. DENIAL. 🙂
steve
Steve
I think your numbers are out by a factor of 10, too high. Maybe your numbers include close to 6 Mb/d/yr of US decline.
Attached is a chart of world oil production without the US along with a projection out to December 2023. It is the highest net decline rate that I have seen or estimated. Note “net” since it is what counts as continuous drilling tries to replace declining production.
Note that the chart shows a Capacity Decline Rate line of 758 kb/d/yr from October 2018 to October 2023. Capacity decline encompasses natural decline and decline associated with reduced investment for drilling and exploration.
The red graph uses the August 2022 STEO report along with the April 2022 International Energy Statistics to make the projection out to 2023. It projects that World crude production W/O US in December 2023 will be close to 68,815 kb/d. The next peak will occur in September 2022, i.e. next month, and will be 3,000 kb/d lower than October 2018 and after that output will keep on heading lower. In other words, any increase in World oil production will depend on the US.
If US output is added to this chart World C plus C production is flat at close to 81,750 kb/d from September 2022 to December 2023.
I think the projected US numbers are too high so that world production will slowly decline after September 2022.
Ovi,
For some odd reason, we continue to NOT MEET EYE-TO-EYE.
Let me repeat myself; I am not discussing the Capacity Decline Rate. What I am Talking About is how much OIL IS LOST EACH YEAR before any new drilling is done.
The Average Natural Decline Rate of Middle East Super Large Oil Fields is about 5-6%.
The Average Natural Decline Rate of NON-OPEC Oil Fields is now over 15% per year.
The Average Natural Decline Rate of Shale Tight Oil is about 45% per year.
So, when we INPUT the Production data from these different sources, we get a NATURAL DECLINE RATE OF 10-11 MBD… EACH & EVERY YEAR
So, yes… we are not FALLING 10-11 MBD because we are ADDING NEW WELLS and DISCOVERIES to offset the NATURAL DECLINES.
Have I finally made myself clear???????
steve
Hmmmm, oil at 25 a barrel was vertical wells up to 1975 or so when Nixon got US off the gold standard and went Saudi oil right? Proven with vertical well technology. A Car was 5k.
Oil at 50 a barrel was next or with horizontal wells and good to 2008 or so, Right? Oil inputs to make a car is 20K.. Probable oil right? Easy stuff above gone
Oil at 100 a barrel with oil shale and Co2 injection into fields, This was tough to get oil at 25 a barrel. Think like tar sands… We are now at end of proven oil…exotic oil now, very low Return for inputs…
At this point demand requires excessive derivative input (funds) to keep oil coming at high volumn..so end is a cliff, right? Who wins…? no one.
tar oil, shale oil….sololumenescene acoustic heating extraction?
Ovi,
Here is the data on OPEC vs. NON-OPEC Decline Rates via each decade.
https://grandemotte.wordpress.com/oil-and-gas-5-production-decline-rates/
steve
The decrease in OPEC decline rates from the 1990s to the 2000s was due to their program of massive infill drilling with horizontal wells, creaming the reservoirs. Most non-OPEC giant fields had at that time, long been in decline. However, the massive infill drilling program began sometime around 2005 in Russia’s giant fields. Here is an article posted in 2009 that gives some details of that program:
Alex Burgansky: Russian Oil and Gas Industry Surprises Analysts Sep. 25, 2009
There are plenty of projects in Russia, both, new projects and existing brownfield projects. Russia is a very mature producer. If you exclude all the drilling activity taking place every year, then Russian organic decline in production is close to 19%. To compensate for that organic decline, Russia drills somewhere between 5,000 and 6,000 wells every year.
And then there are two important questions. One, is there enough oil in Russia for 5,000 or 6,000 wells to penetrate? In my view, the answer is yes. As I explained, we are dealing with a very large reserve base. And the second question: is there enough money in Russia to do that, and can it be done economically? The answer to this question is not so obvious.
Steve
Could you supply the source of this info?
Steve.
Sorry I missed the reference.
Steve
Attached is some updated info on decline rates for Non-OPEC fields. Closer to 8%.
https://www.iea.org/data-and-statistics/charts/decline-rates-for-mature-non-opec-fields-2000-2019
You can download the full report here.
https://www.iea.org/reports/world-energy-investment-2020
The chart appears on P40.
Here is a different opinion.
Results of analysis show that non-OPEC conventional production declines annually at 3.5% excluding ramping-up fields and 2.5% including nondeclining fields by 2017. The supply gap due to this decline will be 4.4 million barrels per day (MMBD) in 2023 under current production and economic conditions, where an additional production capacity of 8.1 MMBD by 2030 is required to maintain 2017 production levels. A 1% shift in the current decline rates may result in either adding or removing approximately 3.4 MMBPD from the global oil market in 2030.
https://www.sciencedirect.com/science/article/abs/pii/S0920410520301431
Thanks, Ovi. This note was listed just below the chart you posted above.
This tells me that this decline rate is for fields like Prudhoe Bay and Cantrell. Fields that are already severely depleted and are going through some kind of “fat tail” stage in their old age. Anyway, that chart is obviously not for all non-OPEC fields. It is only for fields that are producing less than 50% of what their production was at peak.
Notes
Decline rates analysis is for non-OPEC fields that have already fallen below 50% of their peak production.
Ron,
BINGO. Because the world has been adding more DEEPWATER OFFSHORE, and smaller oil fields, they are now declining by 15%.
Even if we are conservative, I still believe ALL WORLD’s OIL FIELDS are now declining at least 10%, when we average them all as NON-OPEC is now nearly TWO-THIRDS of total production.
steve
Steve
You are cherry picking. There is another opinion in the piece I sent.
I might be prepared to accept an average of around 5%. Regardless the current net rate, which is what counts, I think is roughly 750 kb/d/yr for all countries combined except the US. If I remember, I will try to repost my chart in January 2023 to see how close it came. By then we should have the EIA data for Sept.
“Results of analysis show that non-OPEC conventional production declines annually at 3.5% excluding ramping-up fields and 2.5% including nondeclining fields by 2017.”
Ovi,
I don’t look at it as Cherry Picking, but I catch your drift.
However, just try to imagine the World Oil Industry doing NO DRILLING, EOR or NO NEW DISCOVERIES added next year. How much of a decline would you think would happen to the world’s total oil fields if NO DRILLING at all took place?
To me, it would be at least a 10% decline.
steve
If no drilling took place, then the decline rate of Russian oil would be 19%. That was stated in 2009. If no drilling took place, then Saudi’s decline rate would be 8%. They stated that themselves in 2006.
But here is the kicker. Most of that drilling was infill drilling, not new field drilling. So, they were not finding new oil, this was already found oil that they were just pulling out a lot faster. William Catton, in “Overshoot”, likens this to becoming more proficient at writing withdrawal slips to get your money out of the bank. That is the better you are at writing them, the quicker you can get your money out of the bank.
Ron/Steve
The last two major oil field discoveries in the last 20 years are Kashegan around 2000 and Guyana around 2010 to 2015,
No drilling in the US would be a major disaster.
Steve that article is pretty old, probably around 2008 or so, judging by dates on charts.
Steve
I think we are on the same road and going in the same direction. The difference is that you are driving a Lamborghini while I am in a Honda Civic.
I don’t get your tight oil 45% decline rate. That is true for average first year production not for total production. As you can see in the accompanying chart, current total production in the 7 DPR basins is 9,050 kb/d. The associated decline rate is 532 kb/d, 5.9%. More importantly, the OLS line shows that for every 1.0 Mb/d of DPR production increase, the overall decline rate only increases by 82.7 kb/d. The current overall decline rate is 532 kb/d/yr.
The best info I have on middle East decline rates is this paper which states: “Without “maintain potential” drilling to make up for production, Saudi oil fields would have a natural decline rate of a hypothetical 8%. As Saudi Aramco has an extensive drilling program with a budget running in the billions of dollars, this decline is mitigated to a number close to 2%.”
https://www.csis.org/events/saudi-arabias-strategic-energy-initiative-safeguarding-against-supply-disruptions
Download the paper shown in the upper left.
Not sure where this came from “The Average Natural Decline Rate of NON-OPEC Oil Fields is now over 15% per year.”
IMHO, I look at the numbers and let them speak for themselves. The Civic is a pretty reliable car. 😄😄😄
I had a Civic for years.
Now have a Yaris.
My 2007 Civic second car only has 50,000 km. Doesn’t get much use. Shopping around town,
The government of the Republic of Kazakhstan takes an unfriendly position towards Russian policy. Thus, in August 2022, there were reports of the sale of weapons by Kazakhstan to Ukraine through the Jordan. storms. As I remember, about 80% of oil exports from Kazakhstan occur through the CPC. Alternative export routes are limited, something around 7% can be transported through the Caspian Sea to Azerbaijan and further either by rail to Georgia or via the Baku Tbilisi Ceyhan pipeline. Here is a recent message:
CPC announced the possibility to ship up to 3.5 million tons of oil per month from one berth
August 23 / 13:12
Moscow. The Caspian Pipeline Consortium (CPC) can ensure the loading of up to 3.5 million tons of oil per month from the remaining TLU-3 at the sea terminal near Novorossiysk. This was reported to a TASS correspondent in the company.
The repair of each of the other two decommissioned TLUs will take one month after the conclusion of the contract with the contractor and other conditions.
“If an agreement has already been concluded with the contractor, the mobilization of forces and means, their delivery and arrival at the place of work, appropriate weather conditions, the performance of the work itself and subsequent inspections – one month for one TLU. At the same time, of course, the timing can be adjusted depending on objective circumstances,” the company said.
The TLU-3 that remains in operation is now operating in an intensive mode and will be able to handle up to 3.5 million tons of oil per month.
“We need to find a window for a diving survey. Currently, there are only breaks in shipping at night when diving operations are not possible. We are in dialogue with shippers in order to move tanker positions and create a day window for diving descents. We hope that the survey will be carried out before August 26 inclusive,” the CPC added.
“The government of the Republic of Kazakhstan takes an unfriendly position towards Russian policy. ”
Like most other countries, they do not want to become part of the Soviet Union of Putin Republics.
Permian horizontal oil drilling is now in clear decline. Texas has been in a slow decline for some months, New Mexico took a big drop from July to August, mostly in the deepest wells.
Another big problem in the making?
https://www.theglobeandmail.com/world/article-fears-of-unrest-in-iraq-after-influential-shiite-cleric-announces/
The unrest in Iraqu is getting more and more dangerous – at some level it will impact oil production, too. Like in Libya?
Great article with lots of charts. I have posted here just a small part of it. But the main thrust is OPEC+ has peaked and will decline.
OPEC+ Is Protecting Oil Market Downside Bold mine
Shortages of oil, natural gas and coal are reverberating across world economies—the bill from prior underinvestment is coming due, and Russian supply disruptions aren’t helping. Europe and parts of Asia are already facing an unprecedented energy crisis, with the price of natural gas in Europe (TTF) having increased 10x in 18 months.
SNIP
A “healthy” oil field should not be run at maximum capacity, as over-production reduces the quantity of total recoverable oil — OPEC+ knows this. As such, OPEC+ as a group and individual members of the cartel may be quick to reduce production moving forward. Should demand fall and the oil market move into an over-supplied situation in the event of an economic slowdown or increased lockdowns in China, OPEC+ oil supply may be reduced swiftly in response. With OPEC+ controlling over 40% of global oil supply, a cut would support oil prices in the event of a demand drawdown. An “overshoot” of production cuts could easily send oil prices soaring, which would be a positive outcome for OPEC+ members.
SNIP
Although there are several indications that OPEC+ production has peaked and may decline moving forward, the most compelling is the sheer lack of investment. Like its OECD counterparts, OPEC+ countries have been underinvesting in oil production capacity for years, as can be seen below:
What does “… which makes cutting production to spec.” mean? Is it meant to be “… which makes cutting production to be expected”?
George, I really have no idea. But looking at the entire sentence which reads:
“Some fields are likely being overproduced, which makes cutting production to spec.”
It could mean cutting production to the specific level where the field would not be overproduing. But that is just a wild ass guess.
“It is inevitable that eventually the overwhelming bulk of planetary energy will go into computing.”—Dirk Brure, August 2, 2021.
Ever wonder why the demand for electricity has increased more than the population?
Cloud + Bitcoin mining.
Maybe this is the fabled swan song of civilization: put to the hum of a cloud data storage center.
is that better or worse than internal combustion engine swan song?
maybe just as bad.
Both the internal combustion engine and cloud computing data storage changed the world, propelling civilization along. The only reason I posted the concept was because I found myself pondering—like a lot of people—why the world, and especially Europe, is using so much energy. And why everyone is scrambling to find an alternative energy source without asking what measure could conceivably reduce electricity usage.
I (perhaps naively) arrived at the conclusion that, at the core, only two revolutionary events had occurred: Bitcoin mining and logarithmic increases in the quiet but lucrative business of preservation of vast (mostly worthless) heaps of personal data.
When we are being assured that we’re cooking the earth, and also running shy of electricity, should this question not even be posed? I mean, is it politically incorrect to suggest that less crap be stored so folks can heat & cool their flat?
Put another way, is it possible that Microsoft, Amazon and Google are using drastic amounts of energy to store the electronic debris generated by billions of souls looking for short term entertainment? I think it is. 😉
However, there´s the rub, I`m afraid quite many would rather freeze or be cooked to death than loose Facebook and Instagram…
(But maybe they`d get a lot of likes on pictures of their frozen/cooked bodies, so a win for them…)
Or admit that the war against carbon dioxide is total insanity.
I agree with your concern Gerry. What a bizarre use of the earth, and energy.
Other things failing in that category is video gaming, most television programming, financial transactions based upon speculation/derivatives/computerized high frequency trading.
“In California, online gambling already consumes more than the power required for electric water heaters, washing machines, dishwashers, clothes dryers and electric stoves.” [source not verified]
https://www.governing.com/next/the-battle-over-technology-and-energy-consumption.html
https://www.i-scoop.eu/sustainability-sustainable-development/it-sector-electricity-demand/
Shallow Sand has often commented on the high price of steel pipes. Here’s a chart:
John Norris,
From 2018 level the price has roughly doubled.
Could one or more of our Economists comment on the following article and it’s possible impact on China’s oil demand and the world. Could this China condition be similar to the US financial collapse in 2008?
China’s dim prospects turn disastrous
Besides that, Beijing itself is owed $1 trillion by struggling governments around the world that cannot afford to pay back loans for Belt and Road Initiative projects. The result of this domestic and foreign borrowing is that this year China’s debt is expected to reach the equivalent of 275 percent of its GDP due to massive borrowing and economic slowdown. The United States, by comparison, is expected this year to reach a debt level of 98 percent of its GDP.
https://thehill.com/opinion/international/3619006-how-chinas-dim-prospects-may-turn-into-disaster/
In a lot of ways China is in worse shape than Europe. When it comes to manufacturing. Anything that is made in China can be made cheaper elsewhere but there are a lot of sunken cost in factories which is why stuff is still manufactured in China. China is not the lowest cost producer.
If you look at real estate or housing. In the major cities the average home cost 36 times what the average annual income is. When the US had its meltdown in 2008. That number was 6 times average annual income. So orders of magnitude.
I’m sure most people have heard of the credit impulse in China. Well China has been cutting rates and credit just really isn’t responding. Looks to me like a liquidity trap.
85% of all cross border transactions in China are settled in US dollars. Keep an eye on China currency exchange rate with the dollar. What your seeing is the Eurodollar market not wanting to lend money into China.
Lot of speculation about China going to devalue their currency. Eurodollar market is going to devalue it for them.
Drought is so bad they are shutting down factories to conserve electricity.
They have the worst demographics on the planet.
If you believe China will make a move on Taiwan. You should be getting your money out of China.
Investments in China go to zero if China makes that move and get kicked out of Swift. Now is the time to move that money out. Tens of billions of dollars will have to be wrote down by foreign companies if China decides to make a move.
Even if they don’t make a move the threat is enough for investments to think twice before going into China.
And honestly if your China or Hong Kong for that matter and you don’t have enough dollars. Are you going to use the dollars you do have to defend your currency peg? I’m guessing not.
A major devaluation in China which is highly likely and I’m leaning towards the unintentional devaluation. Not controlled will have implications on all markets.
HHH: So orders of magnitude.
Actually, 36:6 is not even one order of magnitude. But I get your point, China has a huge debt problem…
Reminds me, again, of Japan circa 1989-90. Remember the 100 year mortgage? Here’s a blast from the past:
https://money.cnn.com/magazines/fortune/fortune_archive/1990/05/21/73567/
“Nippon Mortgage and Japan Housing Loan, two big home lenders, are offering 99- and 100-year multigeneration loans with interest rates from 8.9% to 9.9%”
@HHH
Adding to this, China imposed a kind of travel ban the last 2 years for all of it’s citicens, comparing with the old Mao time. They use COVID to ban almost all travelling (quarantine is so sever so almost nobody has the time and money to do it).
This adds instability, too – and the endless testing and lockdowns and corona panic propaganda on all channels wears down, too. It’s like war fatigue without a single bullet flying.
Japan people are hit hard with corona panic, too – most now dare to leave home only when completely masked the whole time. A job for the psycho doc, too.
Oil Climbs on Production Outage Fears
Oil climbed to the highest since late July as fears of production outages in Libya that would exacerbate a global energy crunch.
West Texas Intermediate futures rose 4.2% to settle above $97 a barrel on Monday. Although Libyan output has so far withstood clashes between militias in the capital, traders are watching for signs that the violence may halt oil shipments at a time when Europe’s energy crisis is worsening.
Iran, meanwhile, said negotiations with the US over a European Union proposal to revive a nuclear deal will drag on into September, undercutting speculation that increased oil flows are imminent.
“The one trade that everyone can agree upon is that the oil market will likely remain tight,” said Ed Moya, senior market analyst at Oanda.
Crude is on course for a third straight monthly drop on concern global growth will slow as central banks tighten policy aggressively, hurting consumption. To counter that weakness, Saudi Arabia raised the possibility last week that the Organization of Petroleum Exporting Countries and its allies could cut output. The group will meet Sept. 5 to consider October production and review the outlook for the rest of the year.
Separately, loadings from an export terminal for Kazakhstan crude have seen interruptions.
Cries of supply shortages continue to come from all corners, with Shell Plc’s Chief Executive Officer Ben Van Beurden telling a conference in Norway that it’s a “fantasy” that the global energy crunch will be easy to rectify. Speaking at the same event, Tesla Inc. CEO Elon Musk said the world needs more oil and gas now while also pushing to transition to renewable supplies.
Meanwhile, the EU is planning an emergency intervention to dampen the spike in power prices. As natural gas prices rally and trade five times higher than crude futures, it will be giving strong incentives for energy switching, said Francisco Blanch, head of global commodities and derivatives research at Bank of America Corp. in a note to clients.
In a bullish note on commodities, Goldman Sachs Group Inc. said that crude oil had scope to push higher, especially amid shortages of other energy raw materials including natural gas.
Saudi Arabia raised the possibility last week that the Organization of Petroleum Exporting Countries and its allies could cut output.
Saudi Arabia has never been able to sustain production above 10 million barrels/day. This time around is no exception. It’ll be interesting to see how much they’re going to cut production.
Frugal
Same applies to Kuwait and UAE. All three are producing at levels they have not been able to sustain for longer than six months.
I wonder if they are producing at levels that could damage the wells/reservoir.
EIA Folks Must be SMOKING something REALLY GOOD… LOL.
The newest release shows Eagle Ford will reach 1.2 mbd in Sept 2022. Again, I don’t know what the folks at the EIA are smoking, but it must be pretty damn good.
https://www.eia.gov/todayinenergy/detail.php?id=53619
However, if we look at Shaleprofile as of April 2022, Eagle Ford Production is at 1,061,000 bd. Looks like the companies in the Eagle Ford are going to have to increase production by 140,000 bd in the next five months… LOL.
steve
Russian, Iranian and Venezuelan fuel oil is being disguised at a trading hub in the UAE, report says
Brian Evans
Fuel oil from Iran, Russia and Venezuela is being disguised in the UAE, the Wall Street Journal said.
The supplies are being stored in the trading hub of Fujairah, oil traders told the Journal.
Fuel oil being offered matched Russian characteristics but was labeled differently.
Some of us here suspected this was happening.
Crude Oil
91.86
-5.15(-5.31%)
Best to avoid margin
Inflation is due to supply side shocks. And what’s at the end of a supply side shock is a recession.
Central banks are hiking and will continue hiking rates into a recession. Global macro picture isn’t bullish for the price of oil. Even though the supply side disruptions will continue. The direction of price is down. The direction of demand is down turning into increasingly down as economy slows and inflation slows because demand is falling.
FED believes if enough people lose their job demand will fall. And they are right. I don’t think we’ve seen the effects yet from the first rate hike as there is a lag of 8 or so months before the effects show up in real economy.
QT or FED balance sheet run off is set to increase to $95 billion a month. My guess is something big breaks in next 6-7 months. And it’s not speculation. It’s simple math.
If the FED isn’t buying. And is allowing balance sheet runoff. It makes dollar liquidity that much tighter. Because what the FED prints are bank reserves that never leave the banking system into real economy. Actual money from real economy will be required to buy because FED isn’t buying. It exacerbates the dollar shortage that already exists.
Every crash I know had a central bank hiking in the beginning – less available credit means less inflow or even drain of money from stocks and other goods. And as you said, higher interrest rates leads to higher margins and less market liquidity, especially in something as oil where the market in mainly margin driven (no buy and hold as in most stock holdings).
Other than the last crashes, we have additional to the deflationary forces (due to the recession) some more inflationary forces:
Deglobalization. This costs money and increases prices, producing at places more resistant to supply chain breakdowns costs more money than producing at the cheapest place as the last 20 years. Companies are building new production like chip factories, but also simple supply stuff, more close to their main plants.
And massive instability – when for exampe Iraque gets some disruptions due to civil war, this is more supply disruption than a recession can handle. Then we get a depression and some time of much more state economy.
Yeah the talk is ECB doing a 0.75% rate hike. And balance sheet runoff coming. So while the Euro isn’t really global money like the dollar.
Liquidity in Euro’s is also going to be tight. Remember in the REPO market in Europe where real money is created. Italian bills are 45% of the collateral that is used in REPO.
ECB is having to keep a bid under these to keep collateral from being repriced. So there is a monetary shortage of collateral in Europe.
Which means a Euro shortage in Europe.
Not good for demand and prices.
Speaking of low liquidity and shortage of collateral:
https://www.zerohedge.com/commodities/oil-market-completely-broken-says-worlds-largest-commodity-hedge-fund-trader
They explain these 5% per day moves with record low liquidity.
Supply stays tight despite SPR release, so high volatility will continue.
Sounds like my echo. At the end of the day though liquidity or lack of liquidity will trump lack of supply.
Doesn’t matter how tight supply is if there is no money to bid price. Prices go lower. And by money I mean being able to post collateral to borrow money to bid price.
They point out that this thin market is prone to extreme volatility – especially when a scenario emerges when there is not enough oil in Cushing.
Last time when there wasn’t enough tank space oil jumped to -30$ – the upside can be ugly, too.
Thin markets can be tricky – when someone wants to close a short position and there is not enough trade, prices can shoot up a lot, forcing more to cover. Especially when there is not enough money.
The same with wall street at them moment – thin trade leads to prices are created by Gamestop home traders and short covering rallys, making a 2% move day a normal day.
When more people have to sell their stocks to cover energy or house costs it will be hard to absorb this for the market.
US Update is Out
Production up by 201 kb/d. The STEO nailed it. It was out by 2 kb/d
More significantly, Onshore L48 increased by 46 kb/d to 9,606 kb/d. Texas up by 9 kb/d. NM up by 30 kb/d. GOM up by 183 kb/d.
Full update later this week
Ovi, what’s your link. My link has not been updated.
https://www.eia.gov/petroleum/supply/monthly/
https://www.eia.gov/petroleum/production/
It only has two months of data.
Ovi,
Thanks. LOL… 91% of the June 2022 Oil Production growth came from the GOM. It will be interesting to see how the Shale Oil Regions perform in the next 3-6 months.
steve
Steve
Looking at the L48 – GOM over the last year, It looks like 25 kb/d/mth would be a good guess on what to expect for a monthly increase going forward.
GOM’s at highest level since July 2021. Probably because no significant shut-ins and starting to see impact of King’s Quay first oil and Thunderhorse South.
August will be somewhat lower because of pipeline issues with Shell’s Mars-Ursa fields.
GOM still has Mad Dog 2 and Vito to come online over the next 6 months or so.
Bob
Thanks. I will use this as part of the GOM comments
Correction
Texas down 9 kb/d. Transcribing error this morning using a secondary source.
It’s a couple months old but great analysis on diesel scarcity which is a world-wide issue…
seems multiple factors make the cards stacked against future oil production growth…
https://www.funcas.es/articulos/middle-distillates-market-situation-a-global-not-only-european-problem/
“…petroleum product markets are tight because refiners are not converting crude into refined products quickly enough to keep up with demand. In the short term, theoretically, the world must either slow down its consumption of petroleum products or increase its supply. The former, could find answers in: A potential China demand contraction, an inflationary environment, or a high price-demand elasticity. The latter may find some relieve with new refineries coming online during summer, which would help alleviate the petroleum product market tightness by 2023. In any case, high uncertainty is prevailing in the market. Also, it should be mentioned that refiners need high nominal margins to increase its operations, which is the difference between the price of diesel and oil, because one of the most relevant costs for this conversion is natural gas price that are much more expensive in historical terms than oil.”
” the world must either slow down its consumption of petroleum products”
Say it everyday, and let it sink in.
Lower your expectations, its less disappointing that way,
to lose access to all the things that diesel supplies
at such low prices as we in the states have seen since WW2,
like food.
No gas flowing to Germany for next ~4 days…
https://www.dw.com/en/nord-stream-1-russias-gazprom-halts-gas-supply-to-germany/a-62978155
Meanwhile the head of Lukoil “fell out of a window”.
https://www.reuters.com/world/europe/chairman-russian-oil-producer-lukoil-dies-after-falling-hospital-window-source-2022-09-01/
He opposed the Ukraine invasion. Was that the problem? Or is there some other trouble in the Russian oil industry?
US C plus C trend for past 24 months is an average annual increase of 572 kb/d using ordinary least squares (OLS) regression on the data from the EIA (link below.)
https://www.eia.gov/dnav/pet/hist/LeafHandler.ashx?n=PET&s=MCRFPUS2&f=M
Yes, the US is desperately trying to recover from those drastic covid demand cuts. If they keep this trend up for another 2.5 years, they will be back to their 2019 peak. Most analysts seriously doubt that will happen, however. 😫
Ron,
The 12 month average peak for the US was about 12500 kb/d and the 12 month average has been increasing at an annual rate of about 560 kb/d, the current 12 month average is about 11500 kb/d, so about 2 years if the recent trend continues. I think the is a very likely estimate, possibly conservative as high oil prices and a settling of supply chain issues will lead to high profits in the tight oil sector and a possible acceleration of completion rates over the next two years.
Dennis, what we have right now are high prices. The recent uptick in production was mostly the Gulf of Mexico. Things appear to be slowing down. I expect shale production growth to be somewhere between zero and serious decline in about a year from not.
Of course, that is just my guess. And you have stated your guess. Well, I guess we will find out who’s guess is right in about a year. 🤣
“the US is desperately trying”
Really…it seems kind of luke warm from the industry news bits I’ve heard.
Well, the government hopes and the EIA is cheering them along. But yes, the oil companies are not trying very hard.
Seems to me that there are more down months than up. The trend is up because the up months are larger steps up than the down months down. Is there a reason for this? What causes the big upticks?
Dennis
I was wondering if your analysis included the February low of 2021. I also added July 2020 to the analysis since it was the first full rebound month from covid. Adding July 2020 and removing February 2021 from the analysis gives a monthly slope of 39.73 kb/d/mth or 476.8 kb/d/yr, about 100 kb/d lower.
Ovi,
I included all months from July 2020 to June 2022(24 months of data), but my chart was for US C plus C rather than L48OS so we are measuring slightly different things. Also keep in mind that prices did not rise above $100/bo until 2022 and there tends to be a 4 to 6 month lag between increases in oil price and C plus C output based on history. There is a good chance that a continuation of high oil prices may lead to an acceleration of oil output (second derivative of C plus C output may be positive in the last half of 2022 and 2023..)
We have a very interesting scenario in the oil markets at the moment.
As is historically known, recessions are bad for energy prices, energy prices are usually first in the firing line to fall in an anticipation of a recession and first to bounce as the recession passes.
Now for energy specifically for the oil markets the headwinds are the following:
* The FED is raising interest rates trying to crush demand for energy and goods to curb inflation. They will also do QT, which I think will be starting soon which will further reduce liquidity within markets.
* The SPR supply release and an increase in OPEC production. (increased supply putting pressure on prices)
Now the tailwinds for oil in the current environment:
* Natural gas is being substituted for oil as gas is becoming too expensive in Europe.
* Estimation of 1.8 million b/d reduction of Russian oil as a consequence of sanctions is expected.
* Also Russian gas supply to Europe might decrease significantly in the coming months. Thereby increasing to demand for oil.
* Hopes of an Iranian deal is fading fast.
* Also if OPEC is at max capacity, the world demand could still outstrip supply even during the up coming recession we ‘need’ to have.
The dynamic is quite unique. One can expect some floor within the oil markets in the current environment. What that bottom is remains a mystery, but my speculation is $70-75 floor for WTI would not be unexpected in this environment as the recession approaches.
I could be completely wrong and oil prices can retest the $20 dollar floors of the past but I just cannot see that happening in this environment, unless we have a depression.
Another possible scenario is that OPEC doesnt play ball and signficantly curbs supply. Which can cause oil prices to retest the recent $130 dollar highs.
In conclusion oil prices will probably be somewhere between $20-130, depending on how one guess the future will turn out.
Sounds like OPEC closes the tap if oil stays <$100.
Suspect there are many other key exporters (Russia) that do the same…
Prob. a 90% chance of a major recession, in fact it appears the fed is begging for it.
Kengeo,
Truth be told in my opinion no OPEC nation wants to ever experience oil below the $40 mark. But who knows, lets see what happens.
Definitely agree the FED and the markets do wants a severe recession to kill off inflation. So the FED can pivot and inflate the equity bubbles again.
Yep, by the looks of manufacturing I’d say it’s guaranteed:
Iron Mike, also consider the long trend oil price tailwind of
depletion in setting of a rising global population/demand
Hickory,
Definitely tailwinds in the medium-long term assuming the global economy doesn’t tip over.
Mike – Regarding your first tailwind point: “Natural gas is being substituted for oil” – I thought that it was the other way around.
Hi maildog,
This is one example:
Germany has also restarted two power plants that run on oil as the country tries to conserve natural gas as Russian gas flows to Europe continue to be restricted amid an ongoing gas turbine repair situation.
https://en.mercopress.com/2022/08/06/germany-resurrecting-nuclear-oil-and-coal-powered-plants-to-replace-russian-gas
I think this has the potential to increase the demand for oil if this trend continues in Europe, especially over the winter.
This article also (a bit older from 2021)
Gas Shortage Prompts Power Plants to Switch to Oil, Boosting Demand
IEA expects energy crunch to lift oil demand above pre-pandemic levels next year
https://www.wsj.com/articles/gas-shortage-forces-power-plants-to-switch-to-oil-boosting-demand-11634200084
Iron Mike,
Interesting. I expect the “recession” is likely to be mild as central banks will reverse course if a recession hits. The $25/bo scenario favored by some is highly unlikely imho. A $70 to $130/bo window for prices seems reasonable. If oil price falls below $80/bo for Brent, OPEC will cut and oil prices will rise, even if there is a recession.
Something which could bring a hint of information about the fate of Russian oil industry and its oil production. The head of the executive board of Lukoil died after falling out a window of the Central Clinical Hospital of Moscow in which he was undergoing treatment. That’s true, that’s happening every day, isn’t it? It is certain that with a such hopeful and so nice atmosphere for Russian oil industry, the oil production in Russia is going to explode all its production records.
https://www.politico.eu/article/chairman-of-russian-oil-producer-lukoil-dies-after-reportedly-falling-out-of-window/
And he was an early critic of the Ukraine invasion.
Can you give us an update on the nuclear power situation in France- what is the status of reactors taken offline for corrosion / plans for new construction, etc?
Thank you.
I …. don’t know exactly. EDF promised to put back into service most of the reactors at the end of the year. But that will depend on the decision(s) of the ASN. To have a clear view of each nuclear units, you should keep an eye on the different units mentionned on this page : https://www.services-rte.com/fr/visualisez-les-donnees-publiees-par-rte/indisponibilites-des-moyens-de-production.html By clicking on ”afficher”, you can have the estimated date of return to service. Regarding new constructions, the discussions in parliament have not begun and nothing has been formally proposed by the government. As a matter of fact, there are more pressing matters with the current inflation, the lack of teachers, the gas supply for the winter, the gasoline price subsidization and so on. Concerning the program mosarela (MOlten SAlt REactor Life Assessment), the research is in its infancy, to say the least. They are recruiting researchers.
Oil rigs down 9 for the week. Permian down 6. Sub $90 oil is not enough to raise production levels.
Us post out later tonight.
A new thread on US production has beed posted.
https://peakoilbarrel.com/gom-oil-production-fuels-us-june-increase/
A new Open thread Non-Petroleum has been posted
https://peakoilbarrel.com/open-thread-non-petroleum-september-2-2022/