By Ovi
All of the Crude plus Condensate (C + C) production data, oil, for the US state charts comes from the EIAʼs Petroleum Supply monthly PSM which provides updated information up to October 2024.
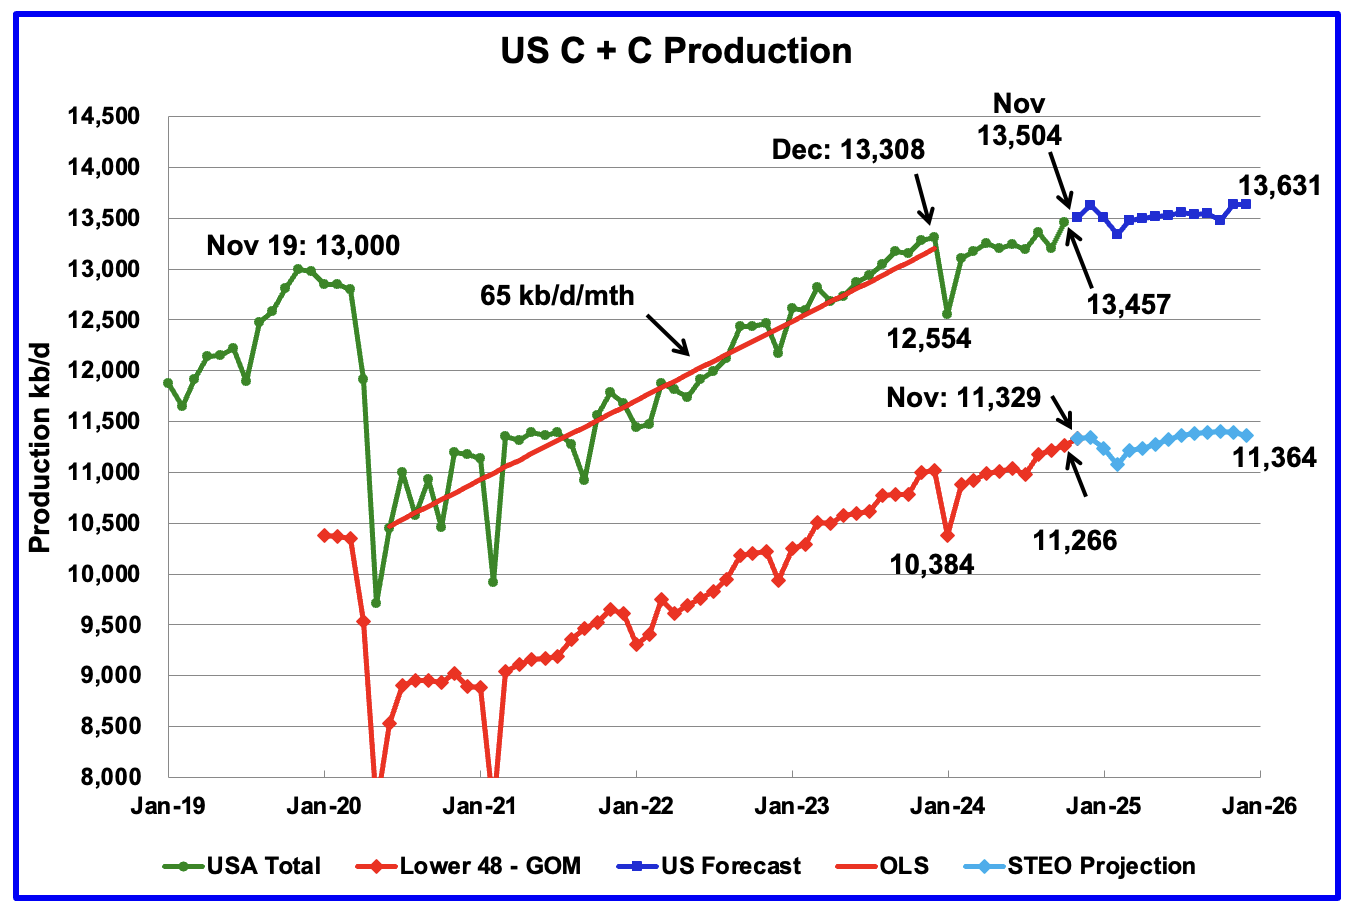
U.S. October oil production increased by 259 kb/d to 13,457 kb/d. The largest increases came from the GOM, 191 kb/d and Texas, 55 kb/d.
The dark blue graph, taken from the December 2024 STEO, is the forecast for U.S. oil production from November 2024 to December 2025. Output for December 2025 is expected to reach 13,631 kb/d, down 30 kb/d from the previous post. From November 2024 to December 2025 production is expected to grow by 127 kb/d. Most of the increase will occur in November/December 2025 time frame.
The light blue graph is the STEO’s projection for output to December 2025 for the Onshore L48. October Onshore L48 production increased by 49 kb/d to 11,266 kb/d. From October 2024 to December 2025, production is expected to increase by 98 kb/d to 11,364 kb/d. Note how the last three months are indicating a possible peak in the Onshore L48.
US Oil Production Ranked by State

Listed above are the 11 US states with the largest oil production along with the Gulf of Mexico. Ohio has been added to this table since its production approached 100 kb/d in January and exceeded Louisiana’s production. These 11 states accounted for 84.5% of all U.S. oil production out of a total production of 13,457 kb/d in October 2024.
On a MoM basis, October oil production in these 11 states rose by 54 kb/d. On a YoY basis, US production increased by 308 kb/d.
State Oil Production Charts

Texas production increased by 55 kb/d in October to 5,855 kb/d a new record high. YoY production is up by 269 kb/d.
The red graph is a production projection for Texas using Texas’ RRC reported September and October oil production. The projection uses the cumulative difference between the September and October preliminary production data provided by the Texas RRC. I think there is some catch up reporting of older production in the September production reported in the October RRC data. This makes the October production projection of 5,954 slightly on the high side. This slight over production estimate may be corrected in the November update.
The blue graph shows the average number of weekly rigs reported for each month, shifted forward by 10 months. So the 276 rigs operating in July 2023 have been shifted forward to May 2024. From February 2024 to July 2024, the rig count dropped from 312 in time shifted February 2024 to 256 in July 2024. That drop of 56 rigs has had no impact on production up to now.
As of October, production rose even though the rig count continued to fall. This is a clear indication that some significant improvements have been made with drilling technology and possibly fracturing.

According to the EIA, New Mexico’s October production dropped by 5 kb/d to 2,084 kb/d.
The blue graph is a production projection for Lea plus Eddy counties. These two counties account for close to 99% of New Mexico’s oil production. The projection used the difference between the September and October preliminary production data provided by the New Mexico Oil Conservation Division. A 1% correction was added to the Lea plus Eddy projection to account for their approximate fraction of New Mexico’s oil production. The projection estimates October production increased by 73 kb/d to 2,121 kb/d. The increase is related to increasing production in Eddy county and discussed further down in the Permian section.
Note the methodology used to project New Mexico’s production is the same as that used for Texas.
More oil production information for a few New Mexico and Texas counties is reviewed in the special Permian section further down.
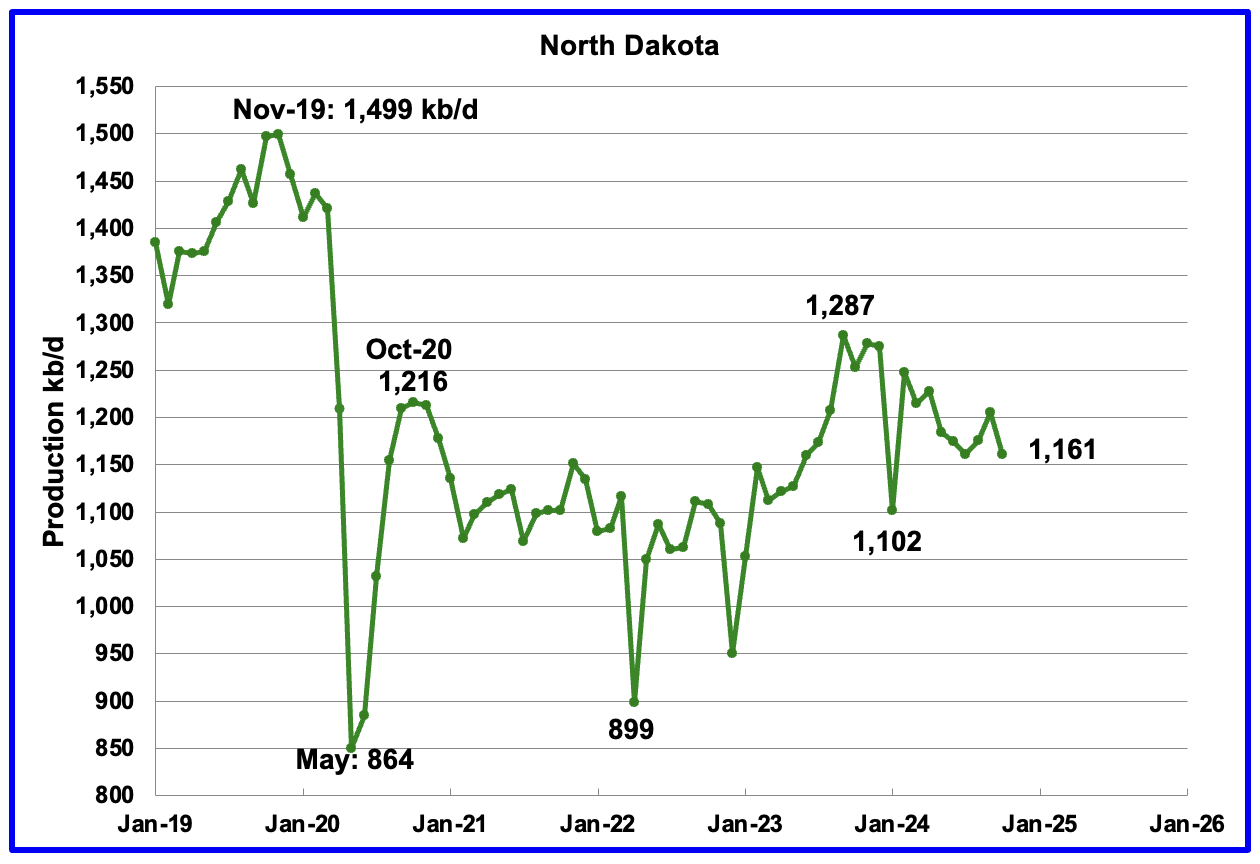
October’s output decreased by 44 kb/d to 1,161 kb/d. Production is down by 126 kb/d from the post pandemic peak of 1,287 kb/d.
According to this article, ND production drillers shut in wells due to fires.
Oil operators in North Dakota, the third-largest producing state in the U.S., are still bringing some facilities back online after wildfires swept through key oil-producing counties in October, the state’s Industrial Commission said on Wednesday.
The outages are limited to isolated production facilities such as well pads, which experienced either local equipment damage or a loss of electricity due to damaged power lines, according to Justin Kringstad, the director of the North Dakota Pipeline Authority.
October output in the state shrank by 520,000 barrels largely due to operators shutting in wells to protect against wildfire damage, said Mark Bohrer, assistant director of the oil and gas division at the North Dakota Department of Mineral Resources.
“The (fall in production) figure is significant,” said Bohrer.
Production in October fell to 1.178 million barrels per day (bpd), down from 1.2 million bpd in September, monthly data from the commission showed on Wednesday. (Ovi: Note the EIA October production estimate is 17 kb/d lower at 1.161 Mb/d than reported by North Dakota).
Currently, the state’s rig count is steady on the month, at 37 in December. But this is expected to increase to the mid-40s over the next couple of years, Bohrer added.
There are 14 active hydraulic fracturing crews in North Dakota as of December, down from 16 last month and from 18 in October.
Another Article reports that some 4 mile laterals are being permitted.
“He said the trend over the past several years has been less 2-mile lateral wells being permitted and more 3-mile lateral permits coming in. He said most recently, there’s been probably half a dozen 4-mile lateral permits, He said the trend for longer laterals continues in the state.“
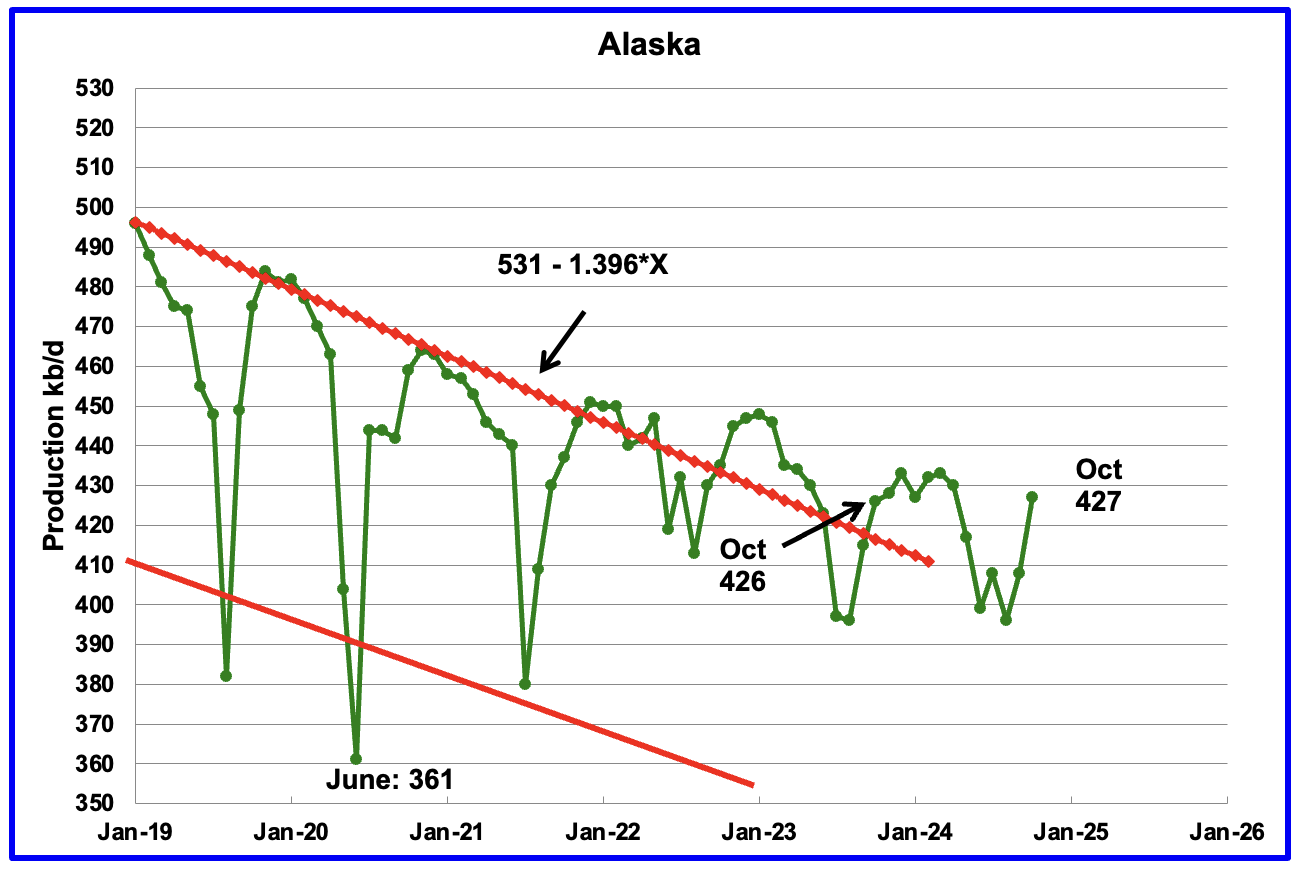
Alaskaʼs October output rose by 19 kb/d to 427 kb/d while YoY production rose by 1 kb/d. The increase in production is an indication that summer maintenance is winding down and production should begin to recover. Weekly Alaska October production reports are close to 430 kb/d while December is approaching 436 kb/d.

Coloradoʼs October oil production increased by 23 kb/d to 499 kb/d. Colorado began the year with 12 rigs but dropped to 10 during June, July and August and had 8 in operation October and November.
The majority of Colorado’s oil comes from the Denver-Julesburg (DJ) Basin located in Weld county, according to this Article.
According to this Article, “Colorado oil and gas regulators have given final approval to a new rule requiring drillers to better analyze the combined environmental effects of their operations, but activists say the move is the latest example of the state failing to live up to the goals of a 2019 health and safety law.”
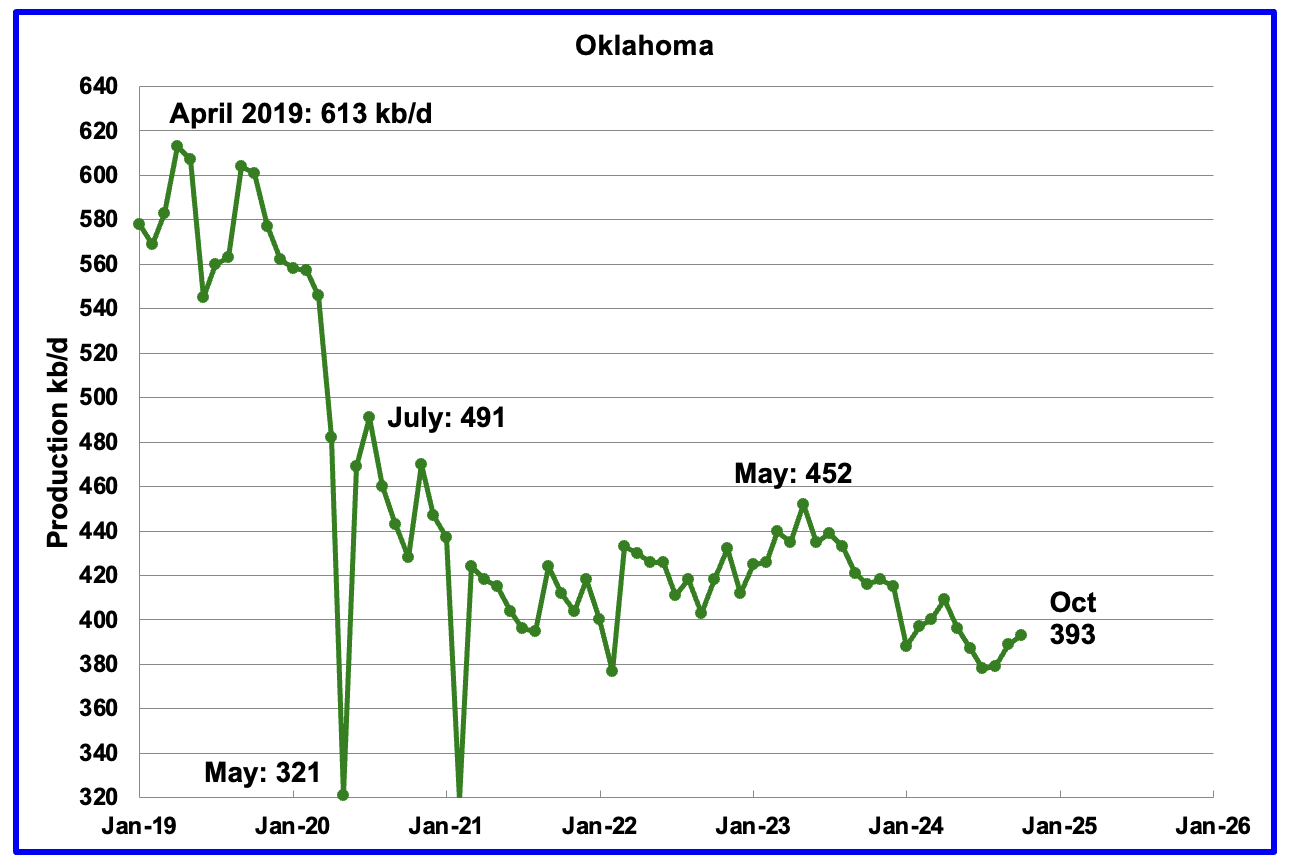
Oklahoma’s output in October rose by 4 kb/d to 393 kb/d. Production remains below the post pandemic July 2020 high of 491 kb/d and is down by 59 kb/d since May 2023. Output entered a slow declining phase in June 2023 but appears to be recovering.
Oklahoma’s rig count dropped from 40 in May to 30 in July. By the end of September 2024 there was an uptick to 41 operational rigs and has held steady at 40 in October and November. Will the increase in the rig count result in increasing/stabilizing oil production.

California’s declining production trend continues. October production dropped by 3 kb/d to 278 kb/d.
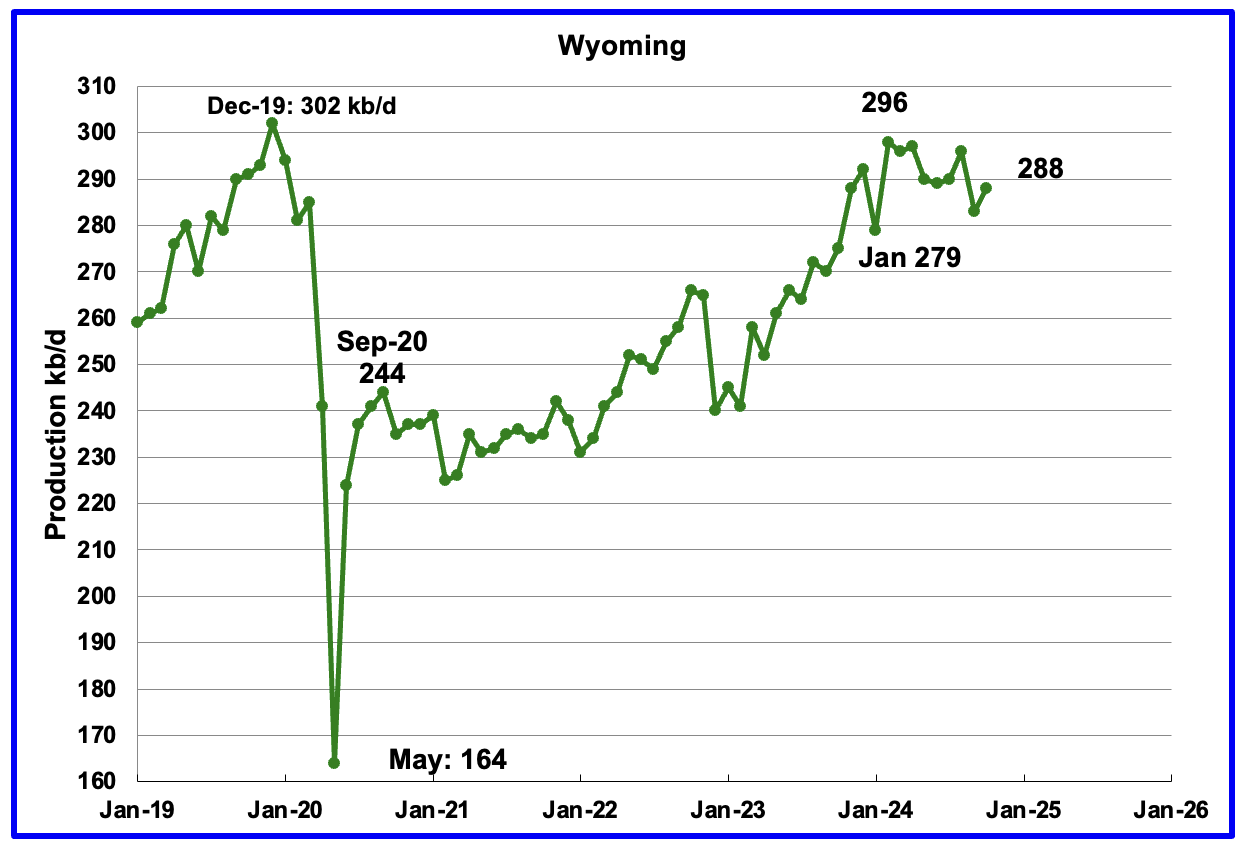
Wyoming’s oil production has been rebounding since March 2023. However the rebound was impacted by the January 2024 storm. Production peaked in February 2024 and is showing signs of being on a plateau.
October’s production rose by 5 kb/d to 288 kb/d. Note that production has almost recovered to the pre-Covid level of 302 kb/d.
In August Wyoming had 8 operational rigs. The rig count has slowly risen to 14 in November.
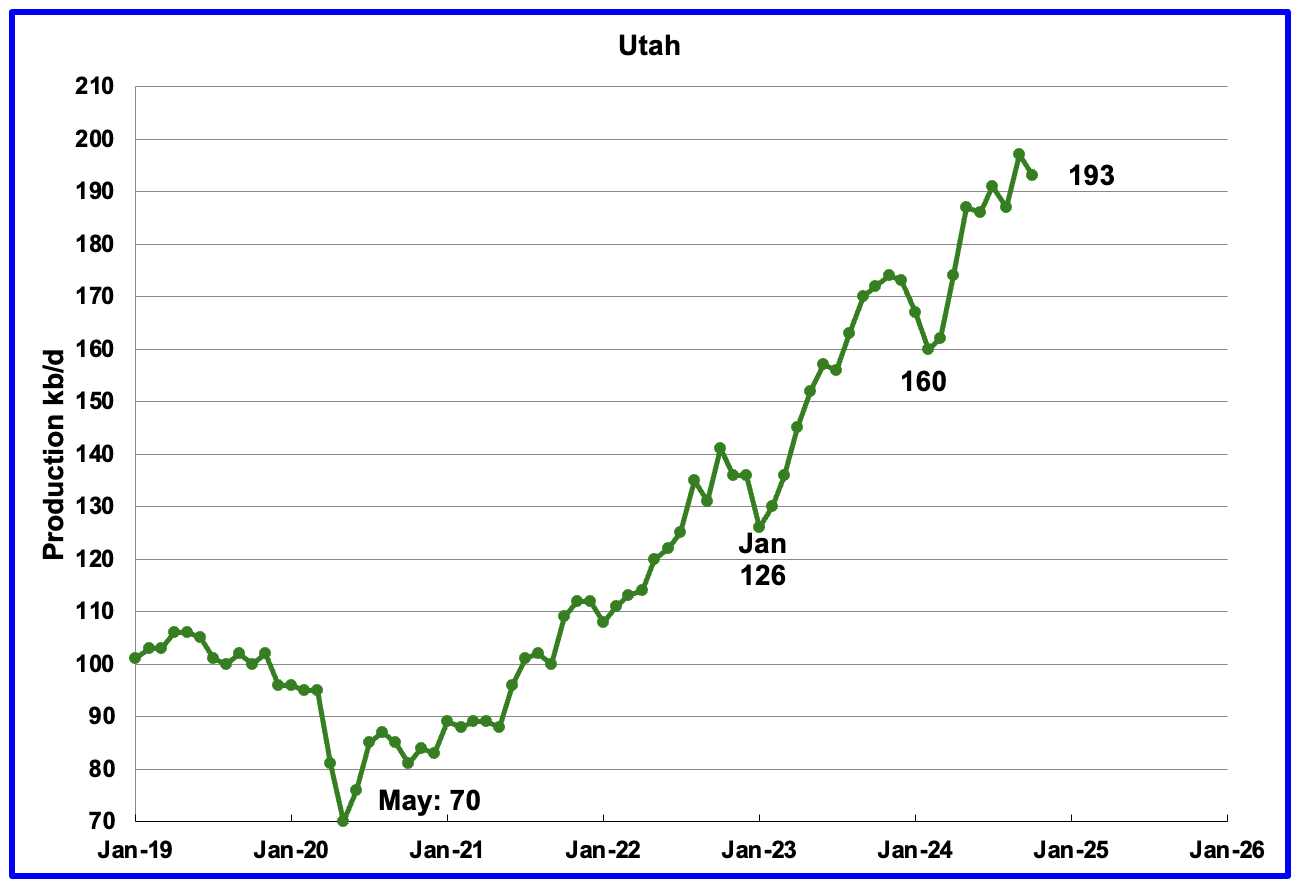
October’s production decreased by 4 kb/d to 193 kb/d. Utah had 9 oil rigs in operation from January to September 2024 but dropped to 8 in October and November.
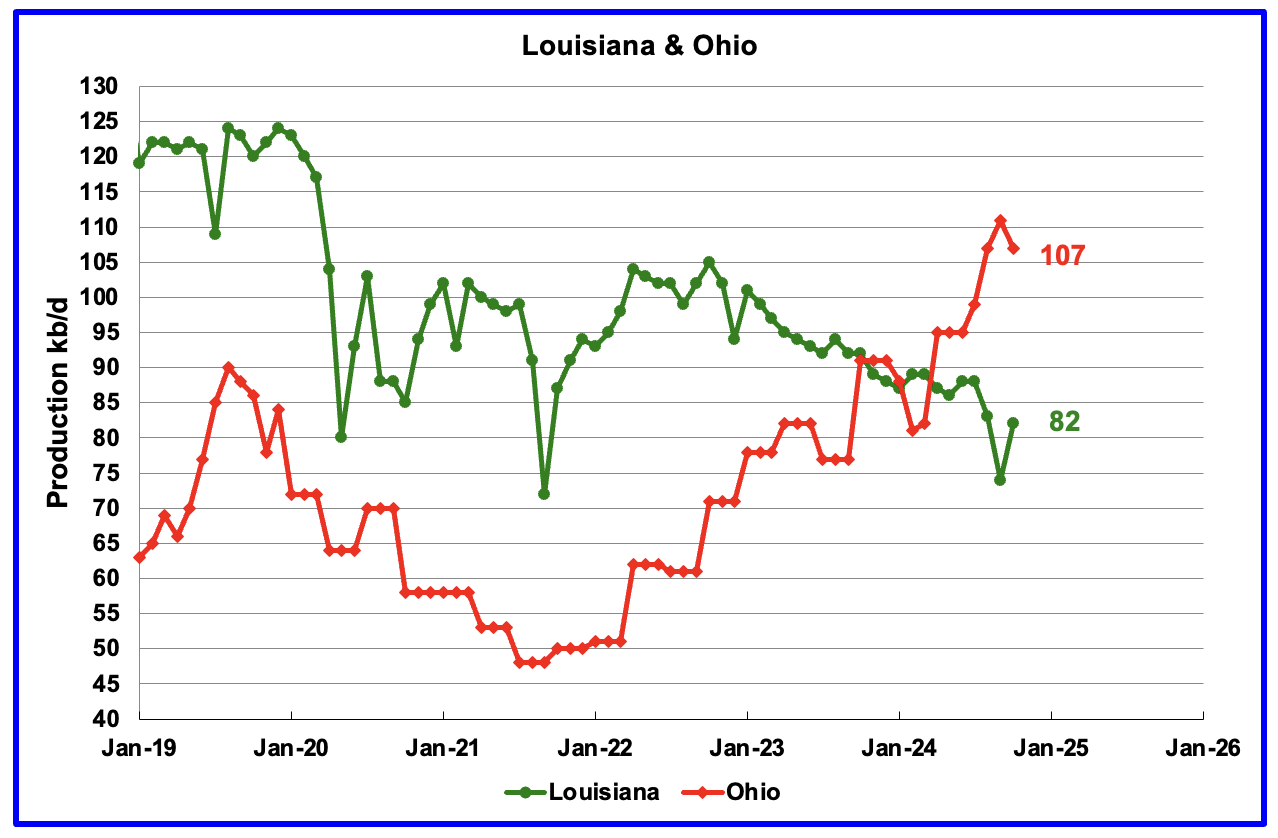
Ohio has been added to the Louisiana chart because Ohio’s production has been slowly increasing since October 2021 and passed Louisiana in November 2023.
Louisiana’s output entered a slow decline phase in October 2022. October’s production rose by 8 kb/d to 82 kb/d.
Ohio’s October oil production dropped by 4 kb/d to 107 kb/d. The most recent Baker Hughes rig report shows two horizontal oil rigs operating in Ohio in September, October and November.
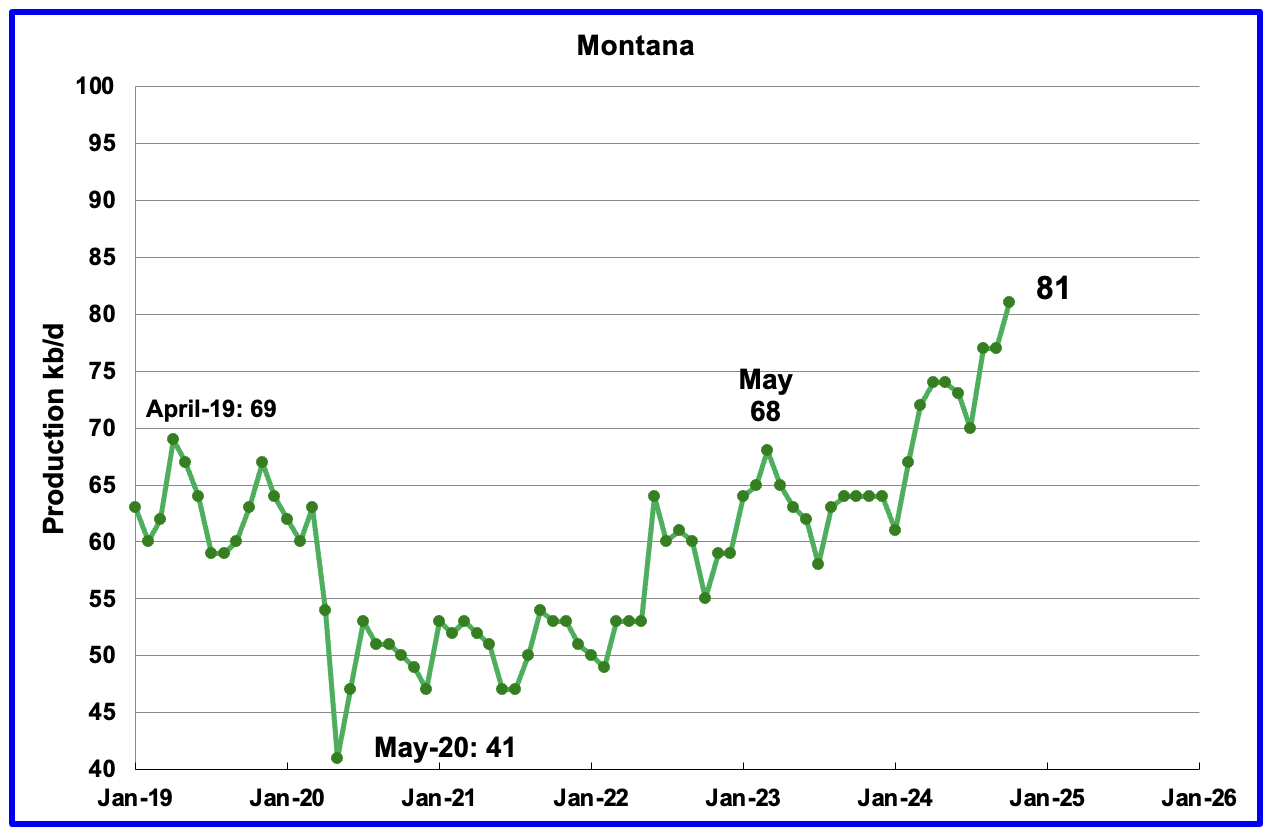
Montana’s oil production is at another new high and possibly heading for 100 kb/d. It’s October oil production is now 1 kb/d lower than Louisiana’s.
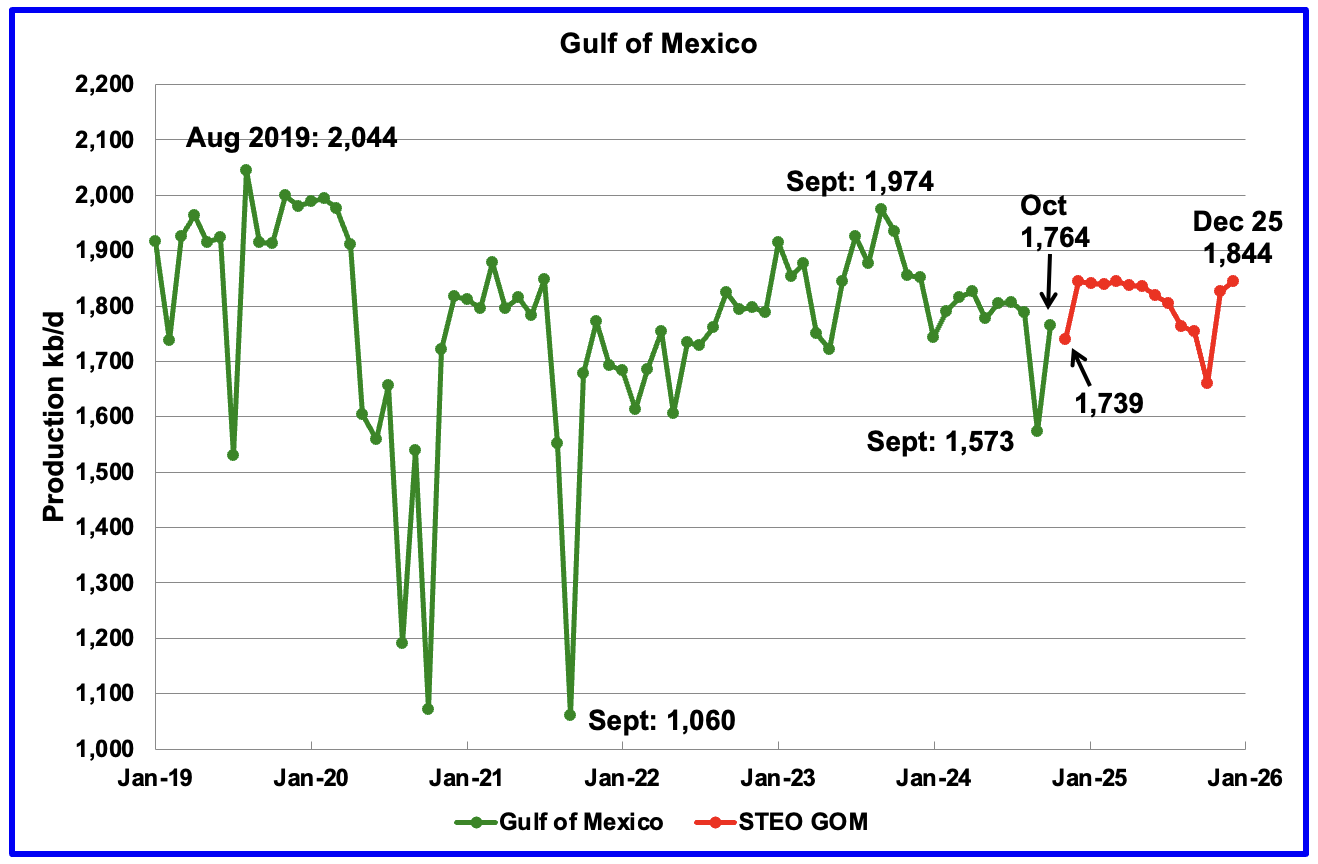
GOM production rose by 191 kb/d in October to 1,764 kb/d but is expected to drop by 25 kb/d in November to 1,739 kb/d. October’s increase is simply the production rebound that came after the September drop caused by Category 4 hurricane Helene.
The December 2024 STEO projection for the GOM output has been added to this chart. It projects production from October 2024 to December 2025 will rise by 80 kb/d to 1,844 kb/d.
A Different Perspective on US Oil Production
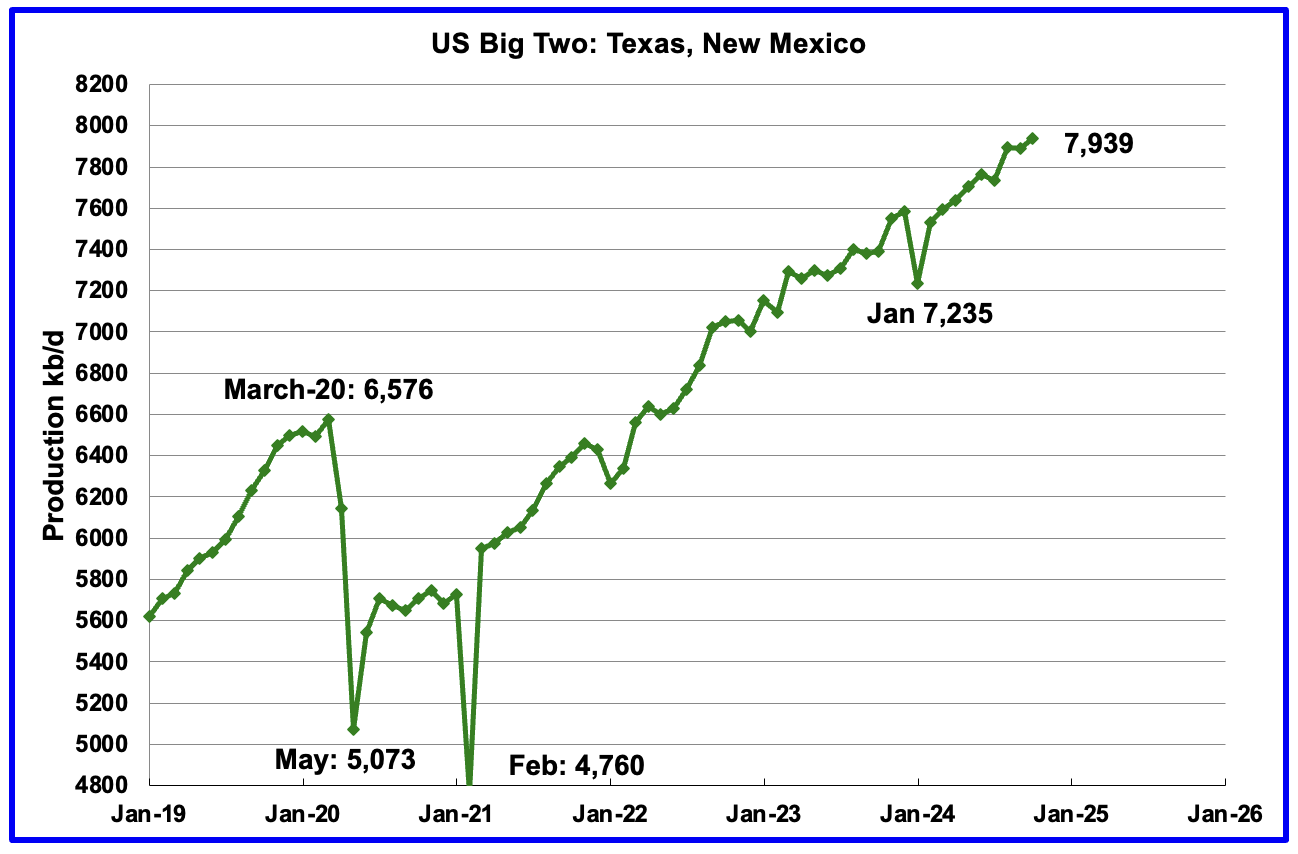
The Big Two states combined oil output for Texas and New Mexico.
October’s production in the Big Two states increased by a combined 50 kb/d to 7,939 kb/d, a new high, with Texas adding 55 kb/d while New Mexico dropped by 5 kb/d.
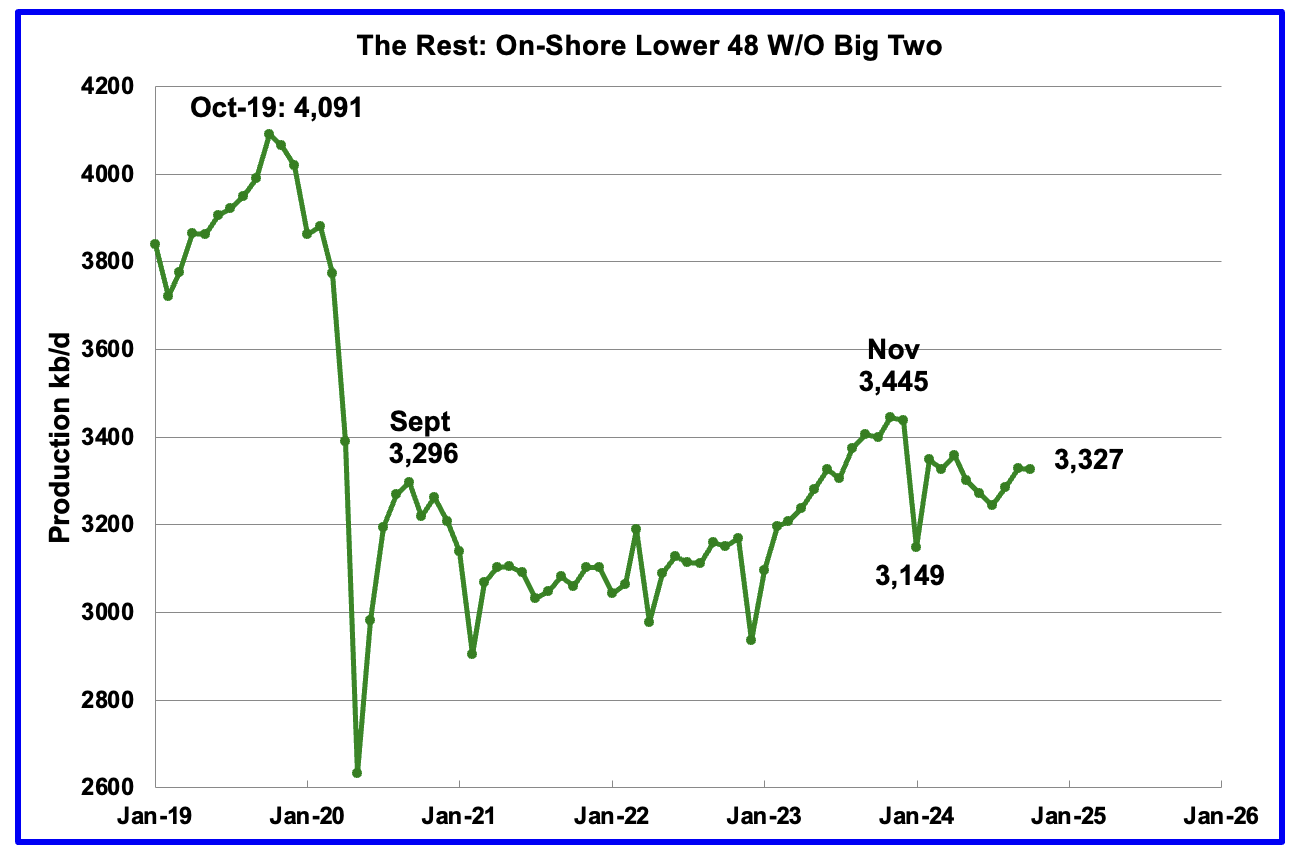
Oil production by The Rest
October’s oil production by The Rest dropped by 1 kb/d to 3,327 kb/d and is 118 kb/d lower than November 2023.
The main takeaway from The Rest chart is that current production is below the high of October 2019 and is a significant loss that occurred during the Covid shut down and will not be readily recovered. Note that October 2024 production has now exceeded the Sept 2020 post covid rebound to 3,296 kb/d by 31 kb/d.
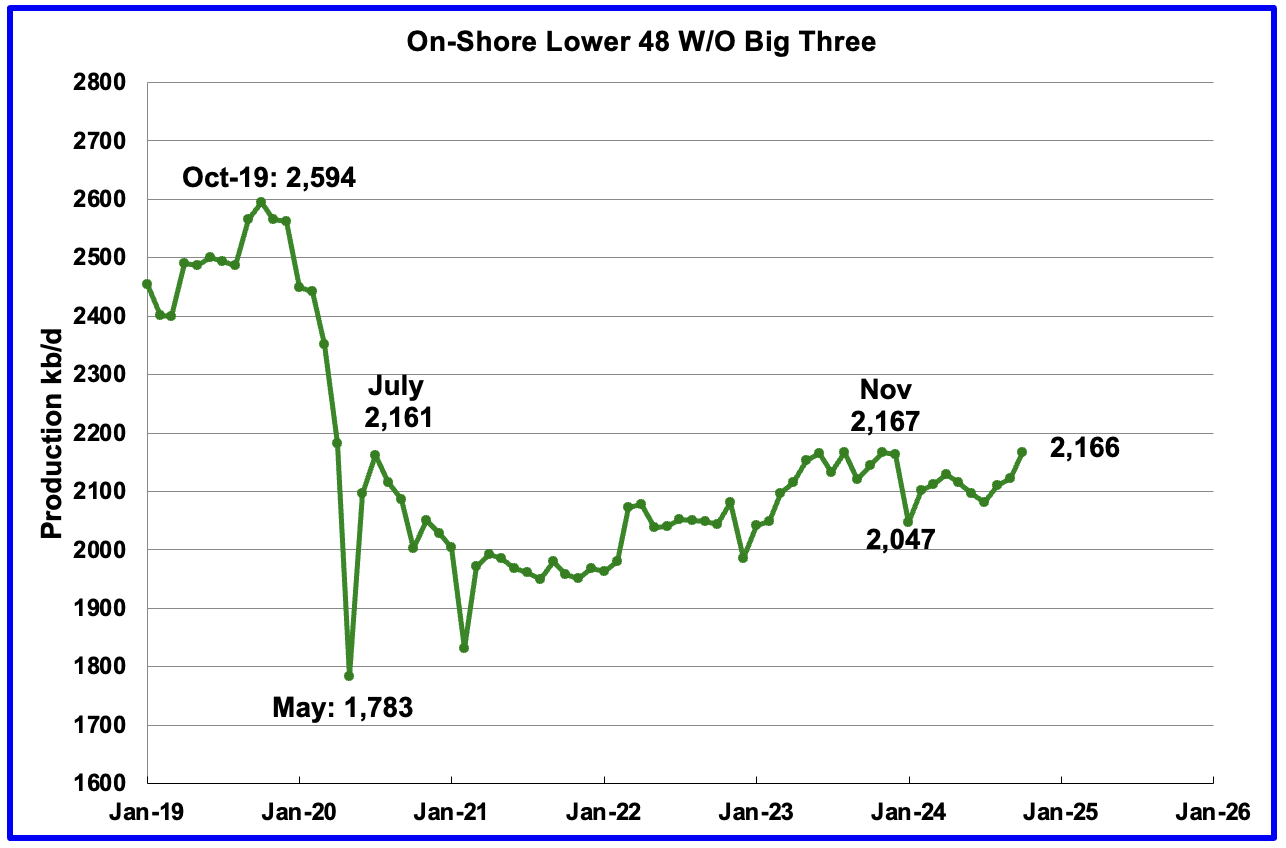
The OnShore L48 W/O the big three, Texas, New Mexico and North Dakota, shows production is on a plateau in the range of 2,100 ±100 kb/d from January 2023.
October’s OnShore L48 W/O the big three production increased by 43 kb/d to 2,166 kb/d.
Permian Basin Report by Main Counties and Districts
This special monthly Permian section was recently added to the US report because of a range of views on whether Permian production will continue to grow or will peak over the next year or two. The issue was brought into focus recently by two Goehring and Rozencwajg Report and Report2 which indicated that a few of the biggest Permian oil producing counties were close to peaking or past peak. Also comments by posters on this site have similar beliefs from hands on experience.
This section will focus on the four largest oil producing counties in the Permian, Lea, Eddy, Midland and Martin. It will track the oil and natural gas production and the associated Gas Oil Ratio (GOR) on a monthly basis. The data is taken from the state’s government agencies for Texas and New Mexico. Typically the data for the latest two or three months is not complete and is revised upward as companies submit their updated information. Note the natural gas production shown in the charts that is used to calculate the GOR is the gas coming from both the gas and oil wells.
Of particular interest will be the charts which plot oil production vs GOR for a county to see if a particular characteristic develops that indicates the field is close to entering or in the bubble point phase. While the GOR metric is best suited for characterizing individual wells, counties with closely spaced horizontal wells may display a behaviour similar to individual wells due to pressure cross talking . For further information on the bubble point and GOR, there are a few good thoughts on the intricacies of the GOR in an earlier POB comment and here. Also check this EIA topic on GOR.
New Mexico Permian
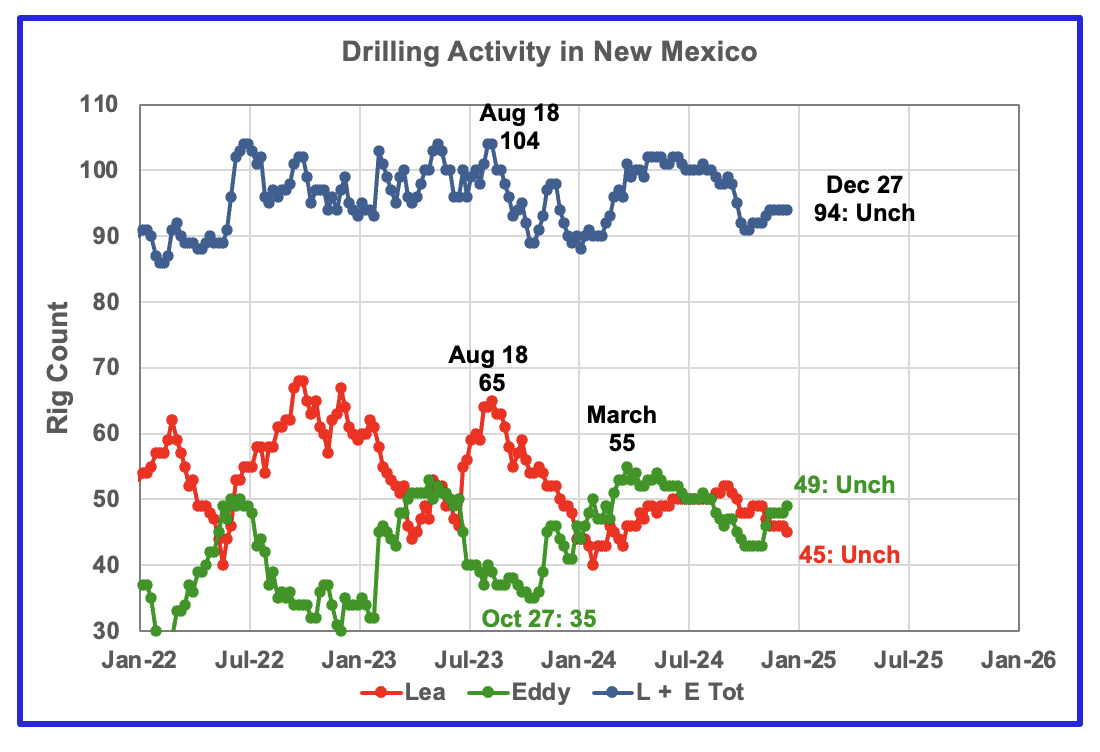
The total rig count in Lea and Eddy counties in the week ending December 27 is down 6 to 94 from the July count of 100 and has held steady for 6 weeks
Lea county rigs have declined from 50 in July to 45 in December.
The Eddy county rig count has increased by 6 from 43 in October to 49 in December. The rise in the Eddy rig count from 35 in October 2023 to 55 in March 2024 is now resulting in increasing production since June 2024. See further down.
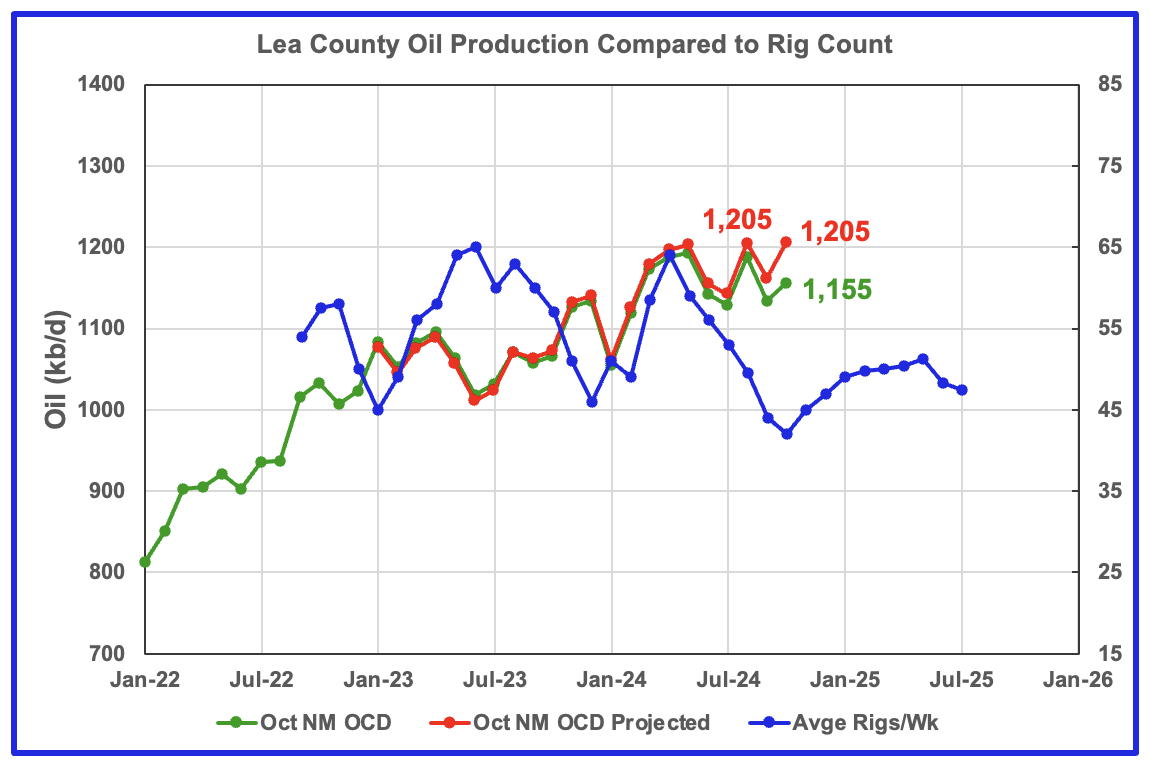
Lea County’s oil production appears to have entered a plateau phase in May at 1,203 kb/d and produced slightly more in August and October at 1,205 kb/d.
Preliminary October data from New Mexico’s Oil Conservation Division (OCD) indicates Lea County’s oil production increased by 21 kb/d to 1,155 kb/d. A projection for October’s final production estimates it will be closer to 1,205 kb/d, an increase of 41 kb/d from September.
The blue graph shows the average number of weekly rigs operating during a given month as taken from the weekly rig chart. The rig graph has been shifted forward by 8 months. So the 64 Rigs/wk operating in August 2023 have been time shifted forward to April 2024 to show the possible correlation and time delay between rig count, completion and oil production. If the oil production were to follow the rig count going forward, oil production in Lea County should start to drop in a few month before recovering in November/December.
Note that rig counts are being used to project production as opposed to completions because very few extra DUCs are being completed at this time.
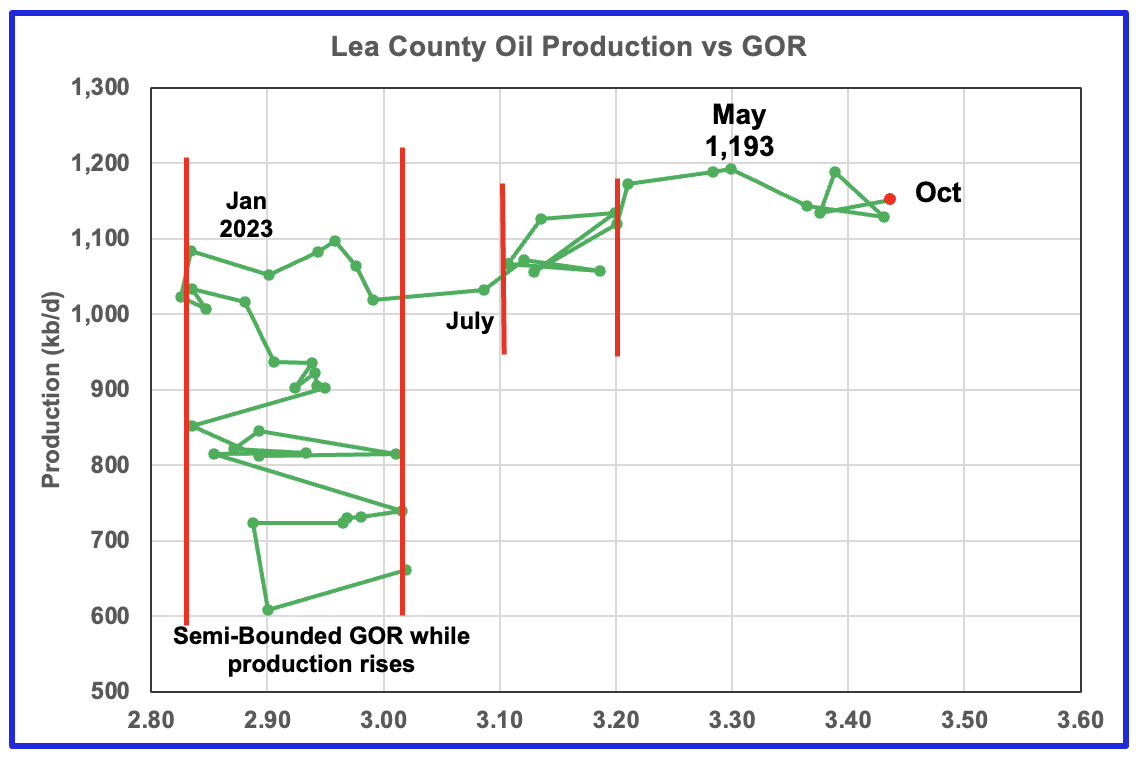
After much zigging and zagging, oil production in Lea county stabilized just below 1,100 kb/d in early 2023. Once production reached a new high in January 2023, production appeared to be on a plateau while the GOR started to increase rapidly to the right and entered the bubble point phase in July 2023.
Since July 2023 the Lea County GOR has continued to increase as production increased within a second semi-bounded GOR. This may indicate that the recent additional production is coming from a new bench/field since the GOR’s behaviour since August 2023 to March 2024 time frame appears once again to be in a semi bounded GOR phase accompanied with rising production.
The GOR moved out of the second semi-bounded GOR region in April and has continued to increase and production appears to be in a plateau phase. The GOR hit a new high of 3.45 in October and this is another indicator that Lea County may be close to peak production.
This zigging and zagging GOR pattern within a semi-bounded GOR while oil production increases to some stable level and then moves out to a higher GOR to the right has shown up in a number of counties. See a few additional cases below.
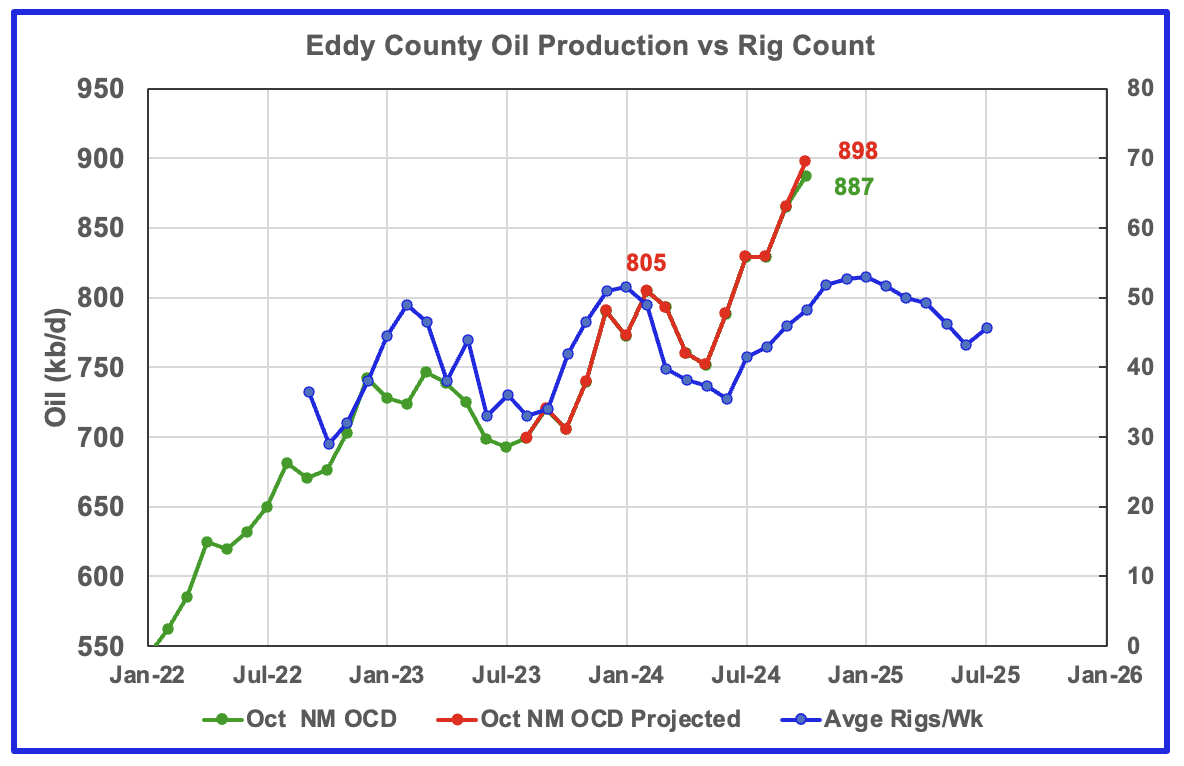
Eddy County’s oil production first peaked in February 2024 at 805 kb/d. After dropping for three months, the number of rigs and associated wells increased and so did oil production. In October the projected oil production increased by 32 kb/d to a new high of 898 kb/d.
From May to October production rose by 146 kb/d. Over that same time shifted rig period, 13 rigs were added to Eddy County. Was a new Tier 1 area/shelf discovered?
The blue graph shows the average number of weekly rigs operating during a given month as taken from the above weekly drilling chart. The rig graph has been shifted forward by 8 months to roughly coincide with the increase in the production graph starting in October 2023.
If production were to follow the rig count trend going forward, production should continue to rise for the next few months and begin to roll over closer to November/December, provided it continues to track the rig count.
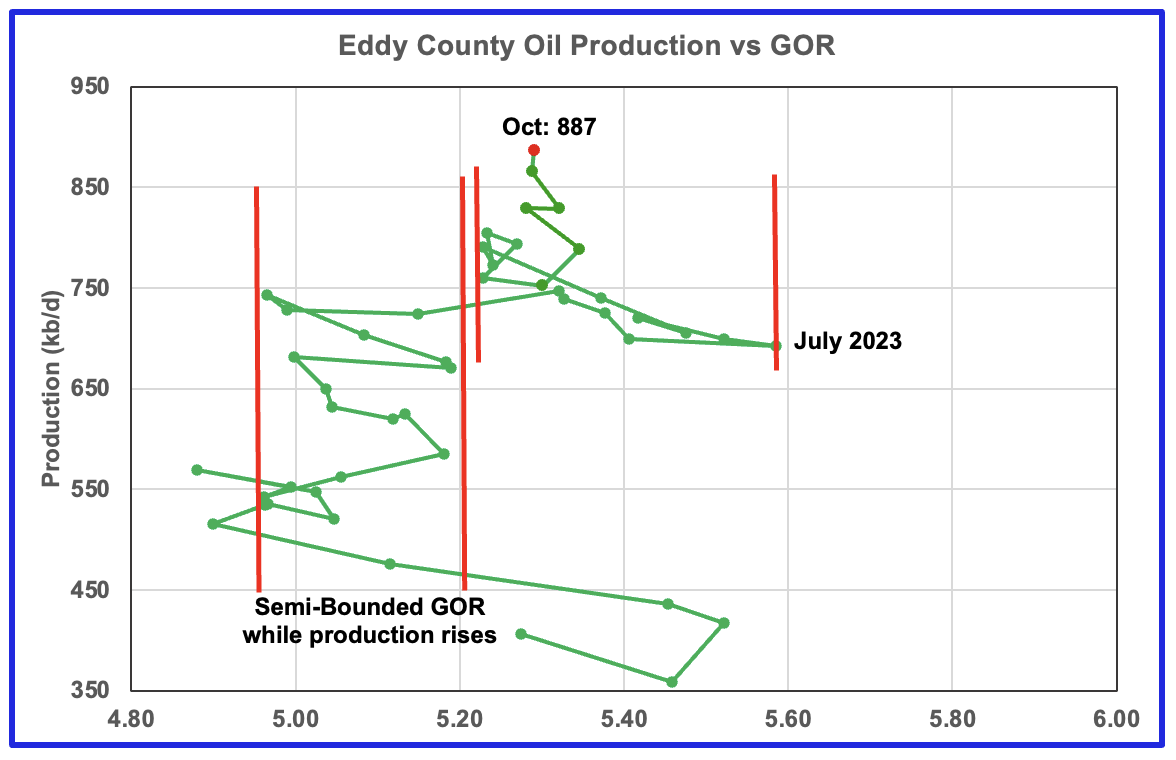
The Eddy county GOR pattern is similar to Lea county except that Eddy broke out from the semi bounded range earlier and for a longer time and then added a second semi bounded GOR phase. For October production continued to increase and stayed within the second semi-bounded region.
The right hand red bar could possibly be placed closer to a GOR 5.35 which may better define the second semi Bounded GOR region.
Texas Permian
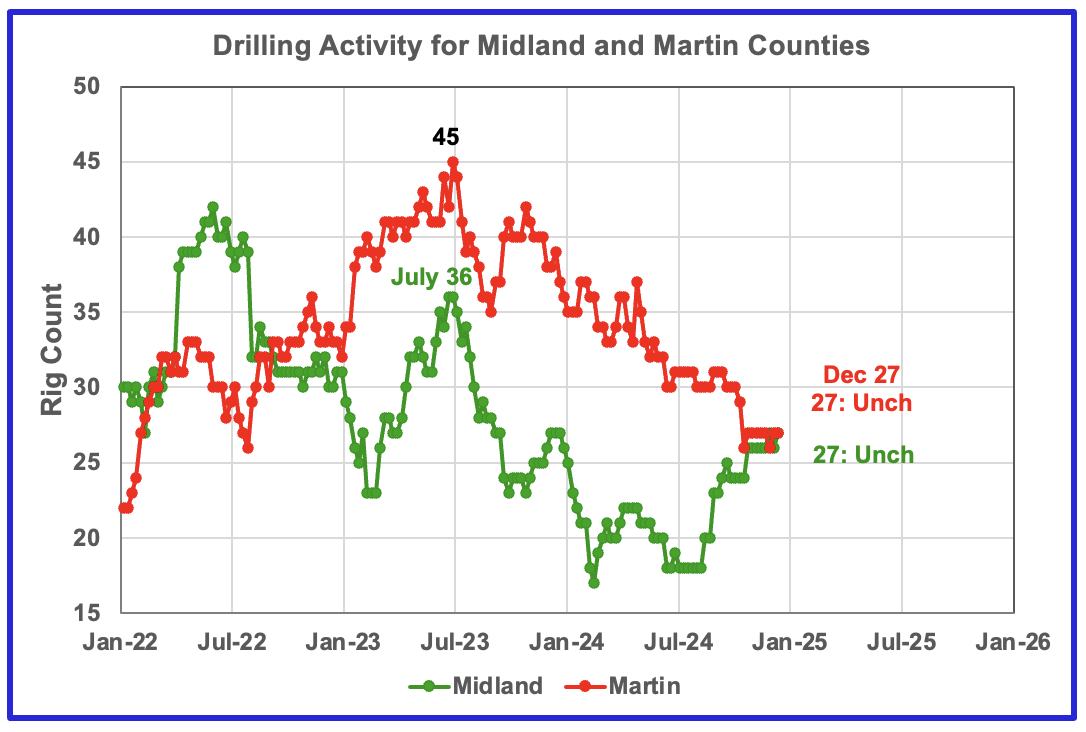
The Midland county rig count has been rising since July and is up 9 to 27 in December. The opposite is true for Martin county. On December 27, 27 rigs were operational, down from 45 in July 2023.
Texas County Oil Production
The Texas RRC made significant revisions to its production data in their September report and those revisions now continue to affect the October projections in this update but to a lesser degree. The projections for this Texas update are almost back to being reasonable. However in a few cases the projections are still questionable.
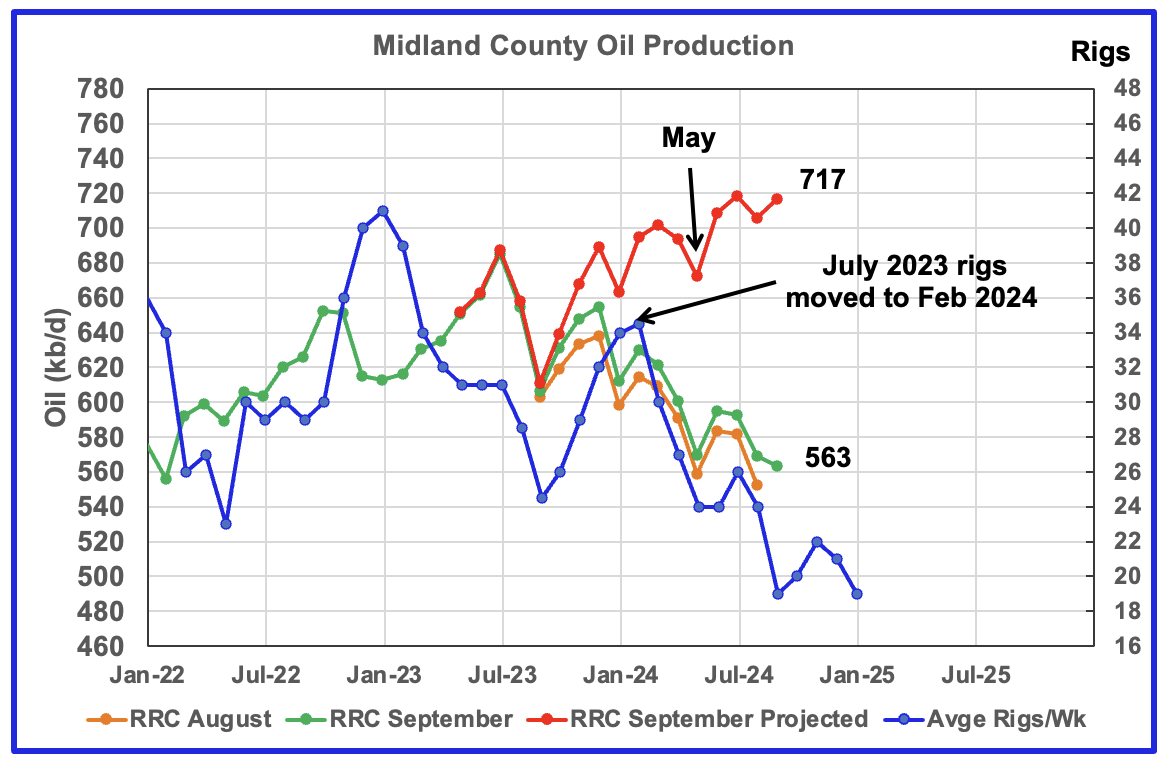
Midland September oil production chart for comparison with October chart below.
For many months in previous posts Midland county’s oil production had been declining. The revisions in the RRC September update have turned the decline into rising production in this chart and the next chart which I don’t think is correct.

The orange and green graphs show the production as reported by the Texas RRC for September and October. The red graph uses the September and October data to project production as it would look after being updated over many months.
I think the increase in the projected production after May is related to the under reporting of production in the September data, especially after July. A partial production update was made by the Texas RRC up to May and can be seen in the current chart by comparing it with May production in the previous comparison chart. In the previous chart, May’s projected production was slightly under 680 kb/d. In the latest October chart, May’s projected production has dropped to 622 kb/d.
The post May production projection is not real and credible and hopefully will correct itself in the next data release. Considering that oil production from July 2023 to May 2024 followed the rig count graph, it is not unreasonable to question whether the production rise after May is believable.
The blue graph shows the average number of weekly rigs operating during a given month as taken from the weekly drilling chart. The rig graph has been shifted forward by seven months. So the average 34.5 Rigs/wk operating in July 2023 have been moved forward to February 2024 to show the possible correlation and time delay between rig count, completions and oil production. If the seven month shift in the rig count is approximately correct in that oil production can be tied to the rig count, oil production in Midland county should increase for a month or two before resuming its decline.
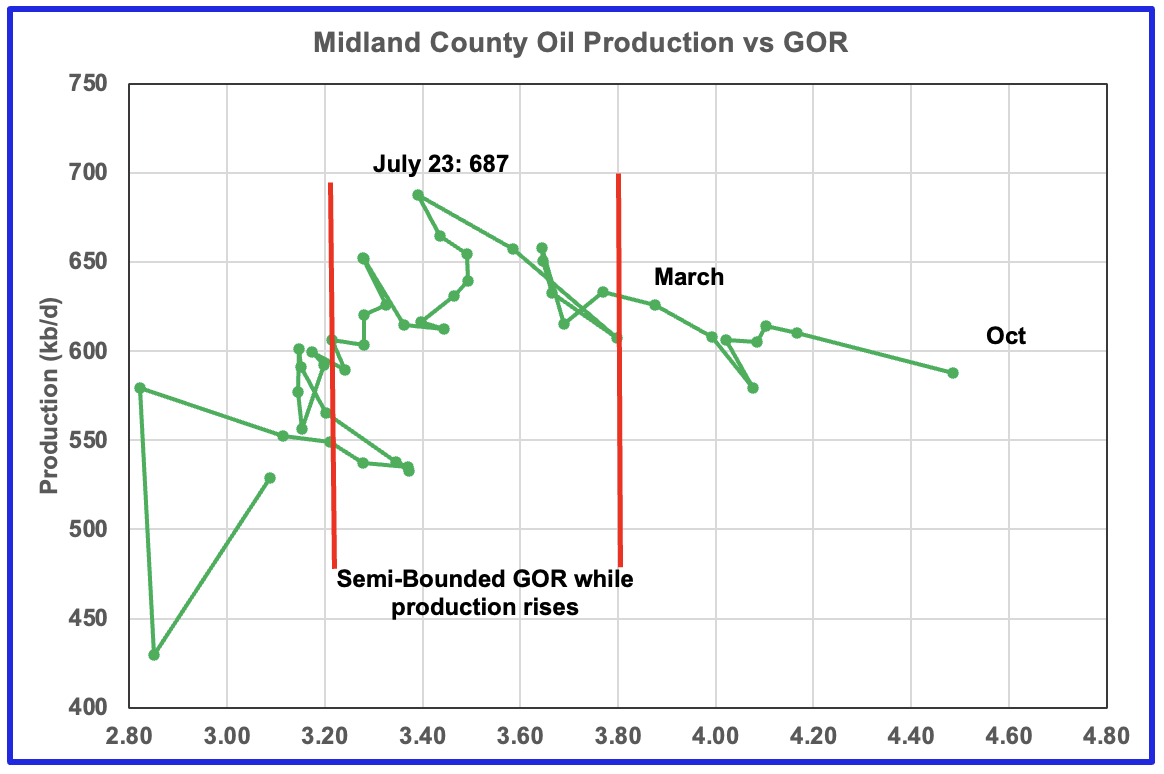
The production revisions do not affect the GOR. For October the GOR ratio continued to increase to a new high of 4.49.
With Midland county deep into the bubble point phase, oil production dropped steadily from July 2023 as the GOR continued to increase. The oil production and GOR shown in this chart is based on the RRC’s October production report. Note that while the last few months are subject to revisions, the July 2023 production has been steady for a number of months.

Above is the Martin county oil production chart posted in June. It was the second month that was hinting at a production peak for Martin county. Also it was the first month in which the GOR moved out of the semi-bounded GOR region. The subsequent July and August charts were affected by significant revisions to the earlier production data and as a result the projected results were not credible. This chart has been posted to compare with the October oil production chart below which appears to confirm that Martin county has entered a plateau phase or possibly a declining phase.
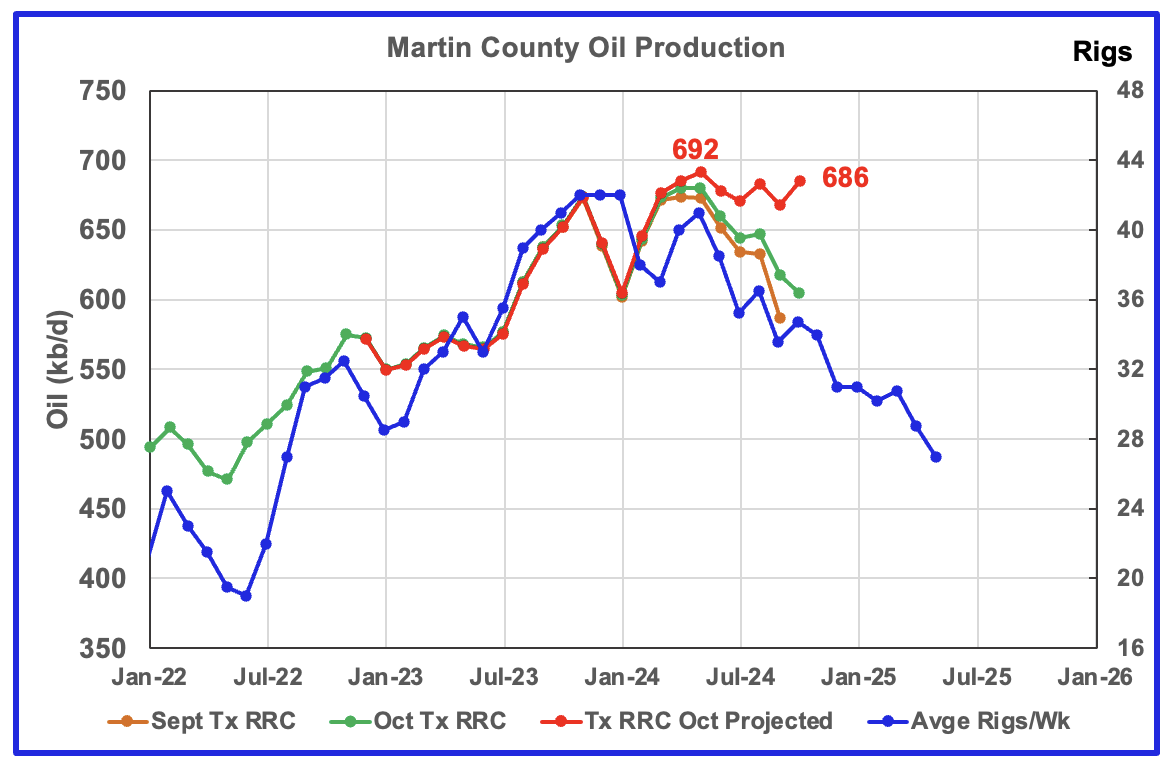
The orange and green graphs show the production for Martin County as reported by the Texas RRC for September and October. The red graph is a projection for oil production as it would look after being updated over many months.
Martin county’s projected October oil production increased by 18 kb/d and is 6 kb/d lower than the peak rate achieved five months ago.
Texas’ RRC oil production for Martin County was showing initial signs of peaking in November 2023 but was then followed by declining production into January 2024. Production since June has been on a plateau while the rig count has been dropping.
The red graph is a production forecast which the Texas RRC could be reporting for Martin county about one year from now as the Texas RRC reports additional updated production information. This projection is based on a methodology that used September and October production. The green graph shows oil production reported by the Texas RRC for October.
The blue chart shifts the rig count ahead by 6 months. Note the three flat spots in the November, December and January rig count and similar flat spots in production a few months later.
A few more months of good data is required to confirm that Martin county oil production is in decline.
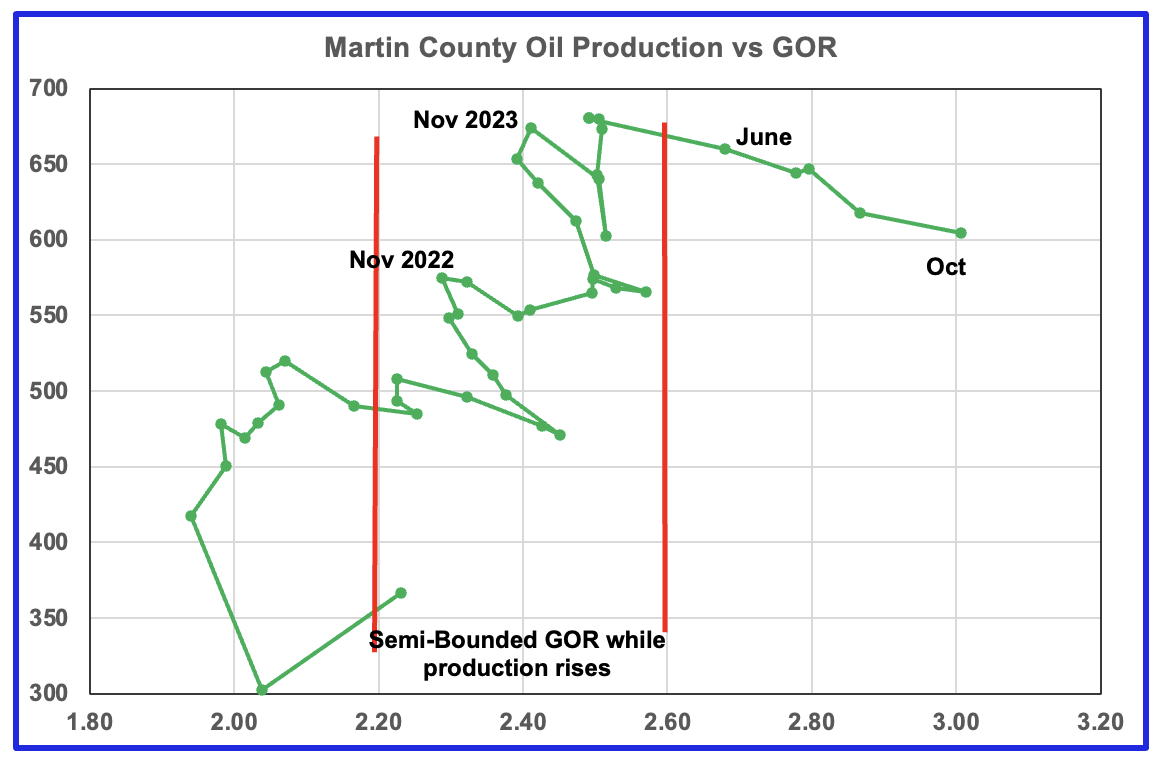
Martin county’s oil production after November 2022 increased and at the same time drifted to slightly higher GORs within the semi bounded range. However the June 2024 GOR saw its first move out of the semi bounded region. October’s preliminary oil production was lower than November 2023 and June 2023. In October the GOR reached a new high of 3.01, which is consistent with falling oil production.
Martin county has the lowest semi-bounded GOR of the four counties at a GOR of close to 2.60 but for October it has jumped to 3.01 and is clearly out of the semi-bounded region. Martin County has now entered the bubble point phase that should result in a dropping oil production trend.
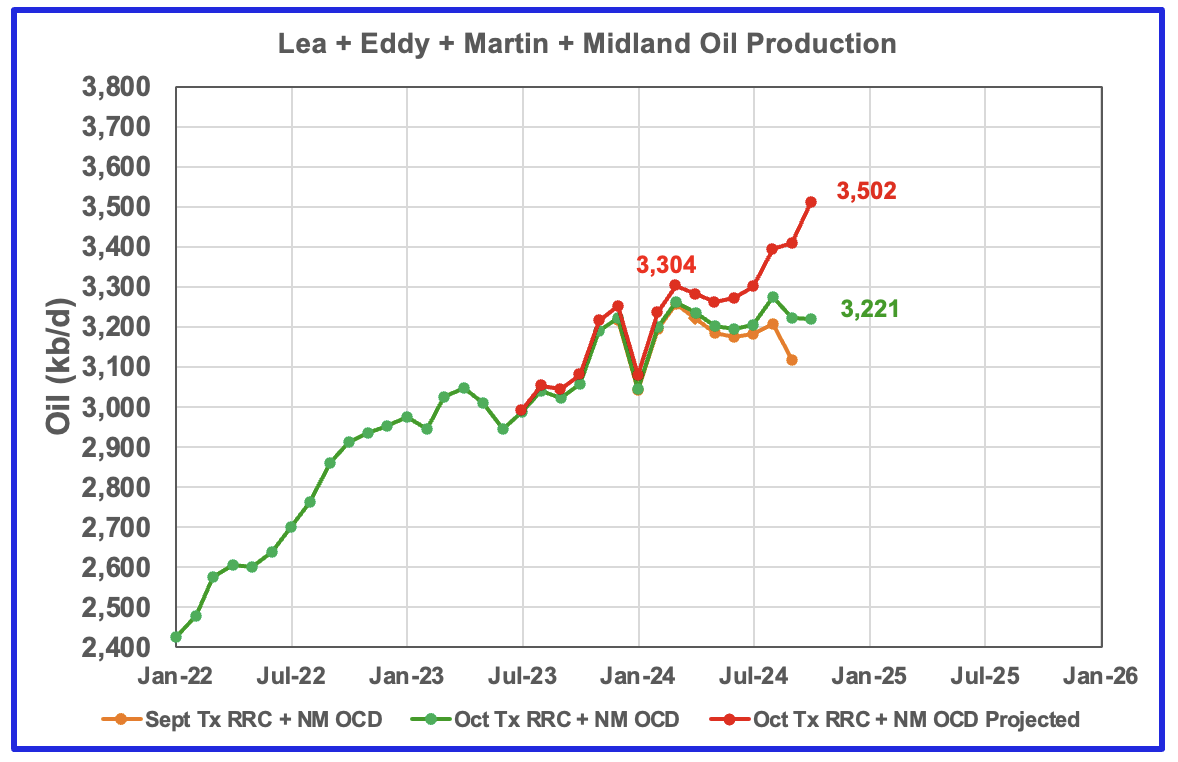
This chart shows the total oil production from the above four largest Permian counties. Assuming that current October Permian production is close to 6,400 kb/d, these four counties account for close to 50% of the total.
The projected production after July is a combination of a real production increase from Eddy county and a revision to earlier Midland production that results in an over estimation for its post July oil production. Hopefully the post July forecast production will be corrected when production is reported for November.
The September and October initial production data is shown in the orange and green graphs respectively. The red graph uses the September and October data to project an estimate for the final October production.
Findings
– Lea county may have peaked in May 2024 and oil production is following the rig count graph
– Eddy County oil production initially peaked in February 2024 but has now started a new increasing phase as it follows the uptrend in the rig count and it has exceeded its previous February peak
– Midland county peaked in July 2023
– Martin County may have also peaked in May 2024 and could have entered a plateau phase.
– Three of the four largest Permian oil producing counties are now in their post peak phase, assuming that drilling does not start to increase. It will take a few more months to confirm this forecast
A note on assumptions. In the above charts of production vs rig count, the rig count has been shifted forward by 6 to 9 months and the assumption is made that production follows rig count. The underlying assumption for doing that is that no more or very few DUCs are being used. Also implicit in making the above calls is that the drillers and frackers are using the latest technology, i.e. 3 mile laterals, max proppant and chemicals in new wells and some refracs. I have no basis for assuming that all drillers are using maximum/latest technology.
Texas District 8
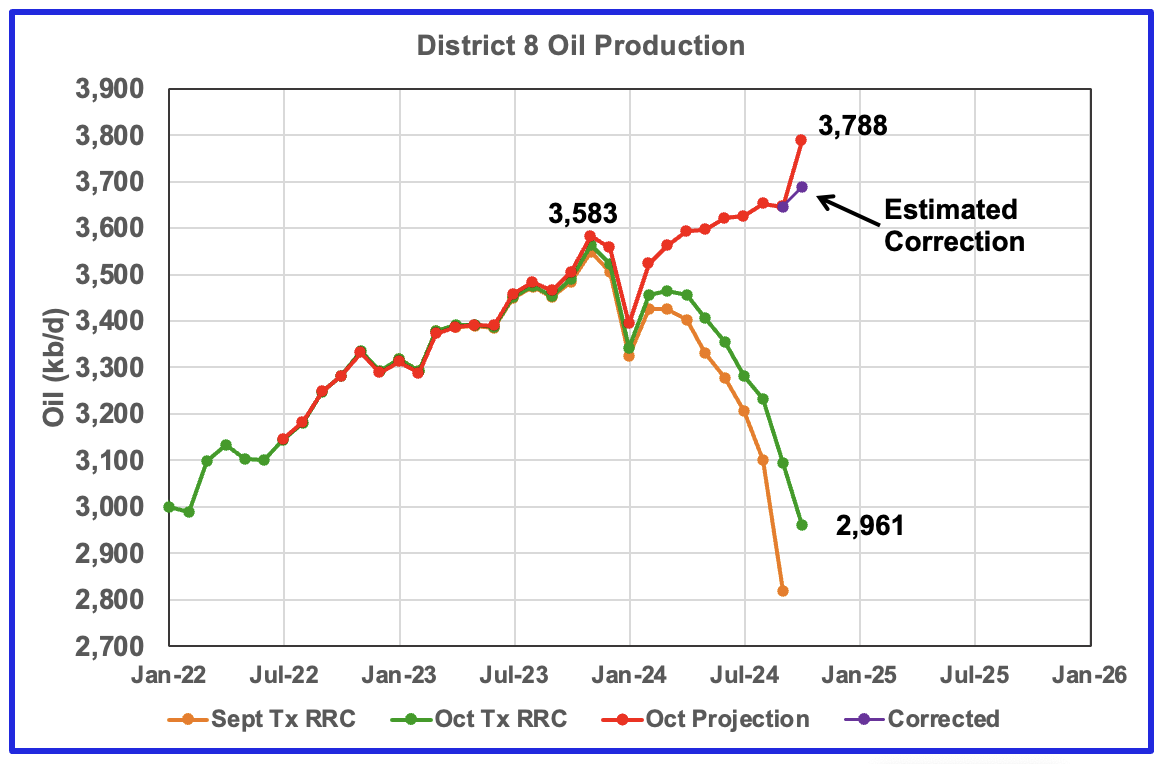
This chart indicates that production is growing in District 8 and that production had a spike increase in the October projection. Unfortunately this spike increase is related to large revisions/updates to older production data.
Texas District 8 contains both the Midland and Martin counties. Combined these two counties produce close to 1,300 kb/d of oil. While these two counties are the two largest oil producers, there are many other counties with smaller production, such as Reeves #3, Loving #4 and Howard #5 that in total produced 3,583 kb/d of oil in November 2023. Essentially the Midland and Martin counties produce close to 1/3 of the District 8 oil.
The orange and green graphs show the production reported by the Texas RRC for September and October. A more realistic projection for October would be the purple markers. It is the result of dropping 100 kb/d from the October RRC data because the typical gap between the last two months is closer to 200 kb/d rather than 100 kb/d. This anomaly should correct itself in the next RRC update.
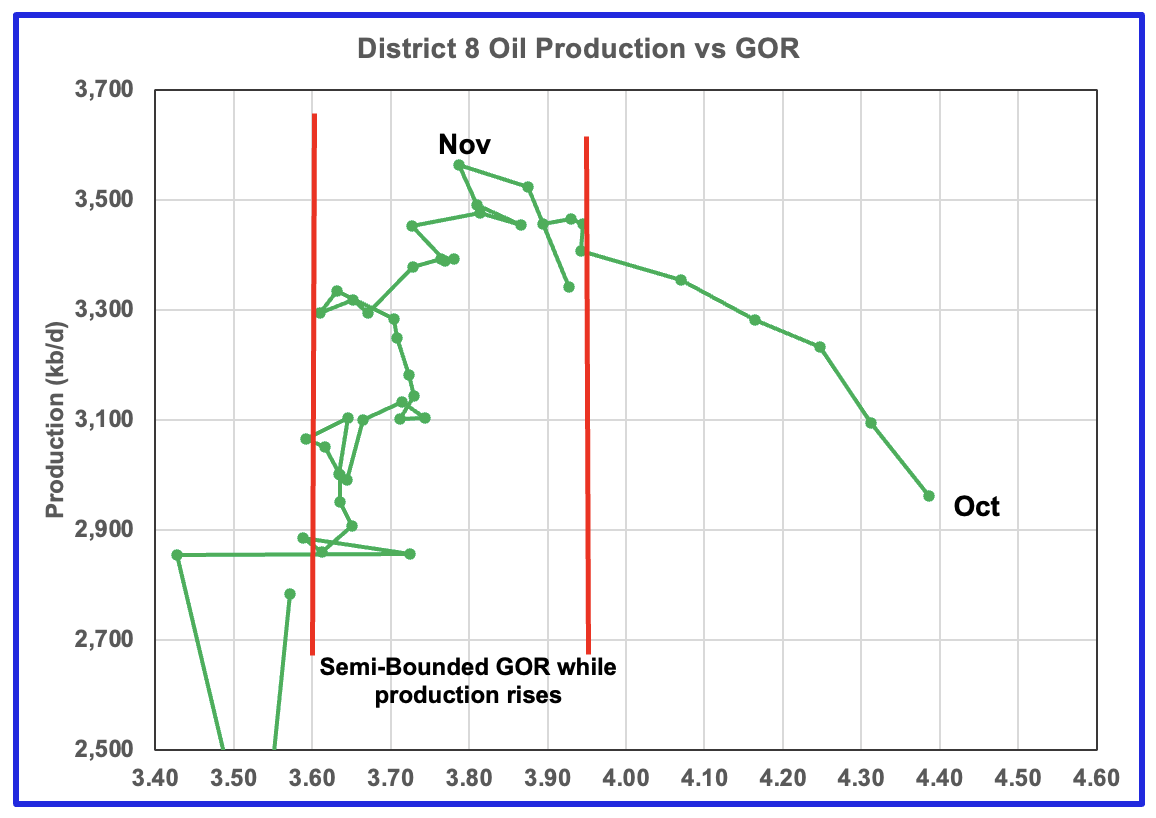
Plotting an oil production vs GOR graph for a district may be a bit of a stretch. Regardless here it is and it seems to indicate many District 8 counties may well be into the bubble point phase.
Oil Production and GOR Charts for Two of the Next Biggest Oil Producing Counties in Texas
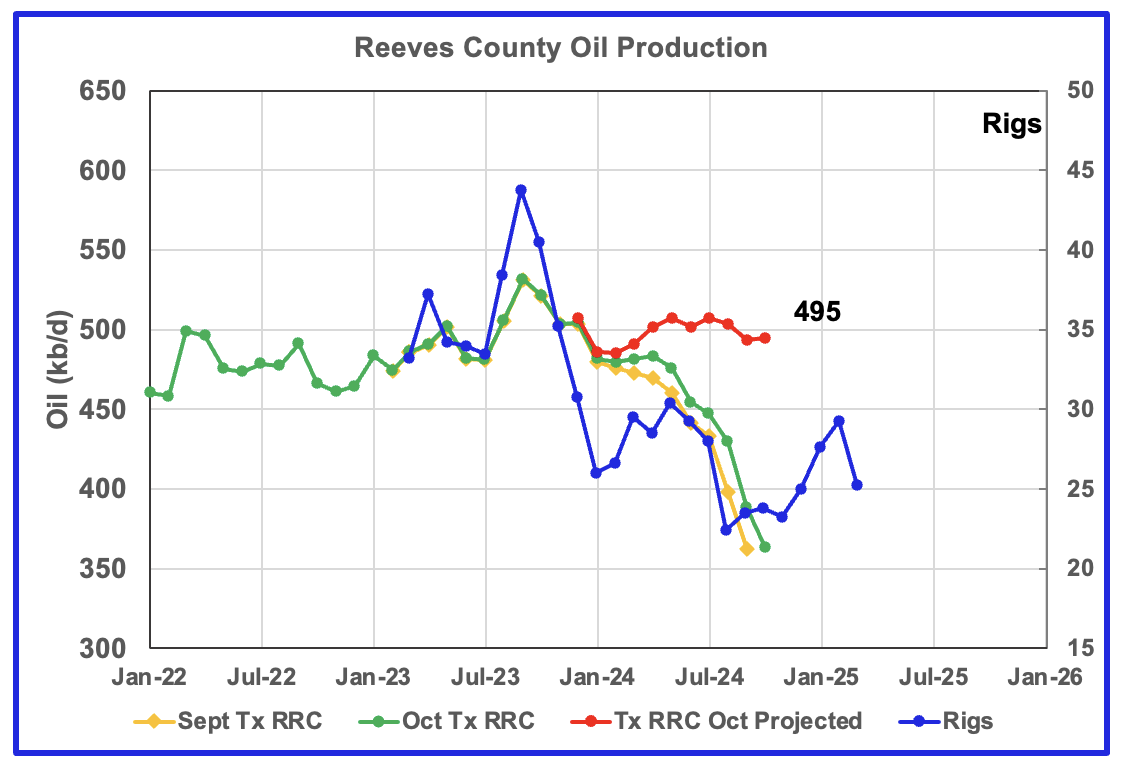
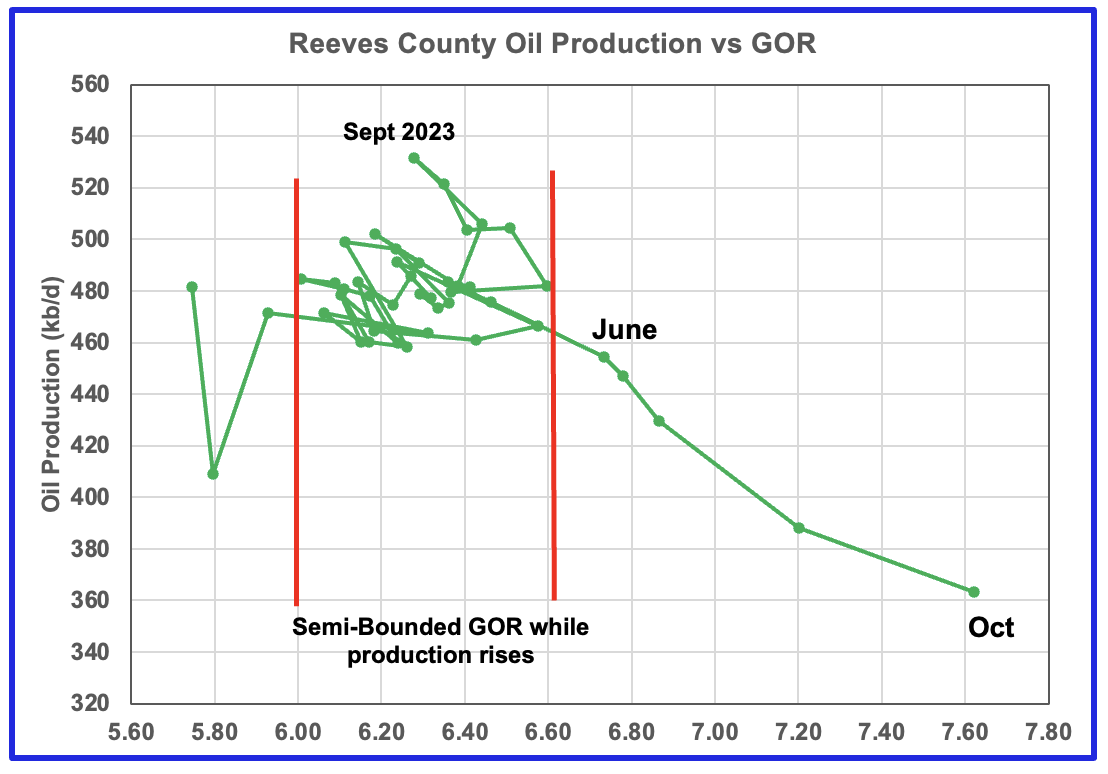
Reeves county peaked in September 2023 at 534 kb/d. Note the rapid movement of the GOR once it broke out of the Semi-Bounded GOR range to higher GORs. While the GOR has risen to new highs, production appears to be on a plateau.
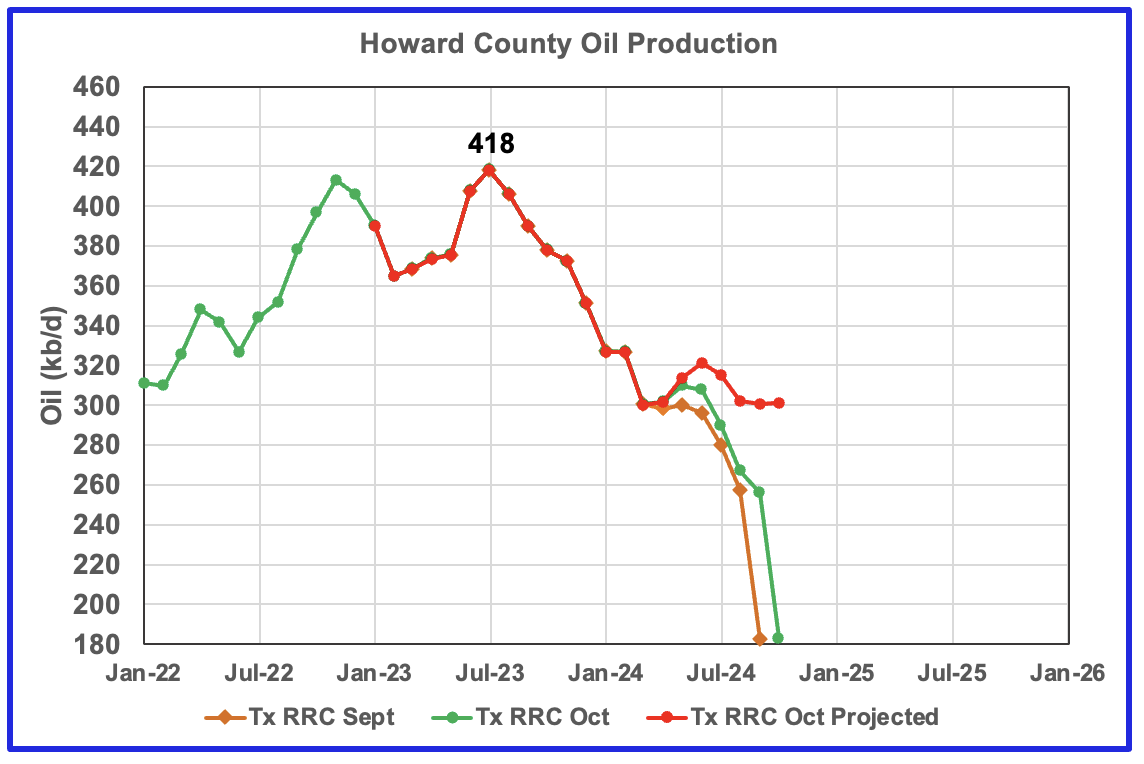
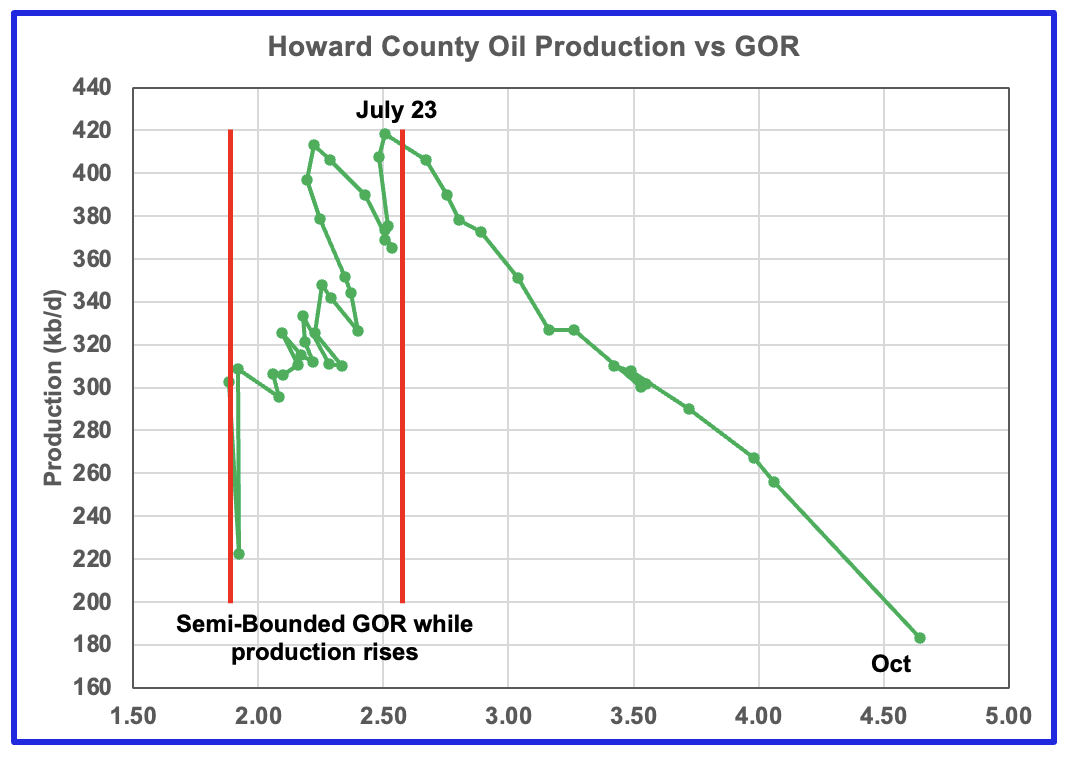
Howard county oil production peaked in July 2023 at 418 kb/d and then the GOR began to increase and along with it, production dropped.
Drilling Productivity Report
The Drilling Productivity Report (DPR) uses recent data on the total number of drilling rigs in operation along with estimates of drilling productivity and estimated changes in production from existing oil wells to provide estimated changes in oil production for the principal tight oil regions. The new DPR report in the STEO provides production up to November 2024. The report also projects output to December 2025. The DUC charts and Drilled Wells charts are also updated to November 2024.
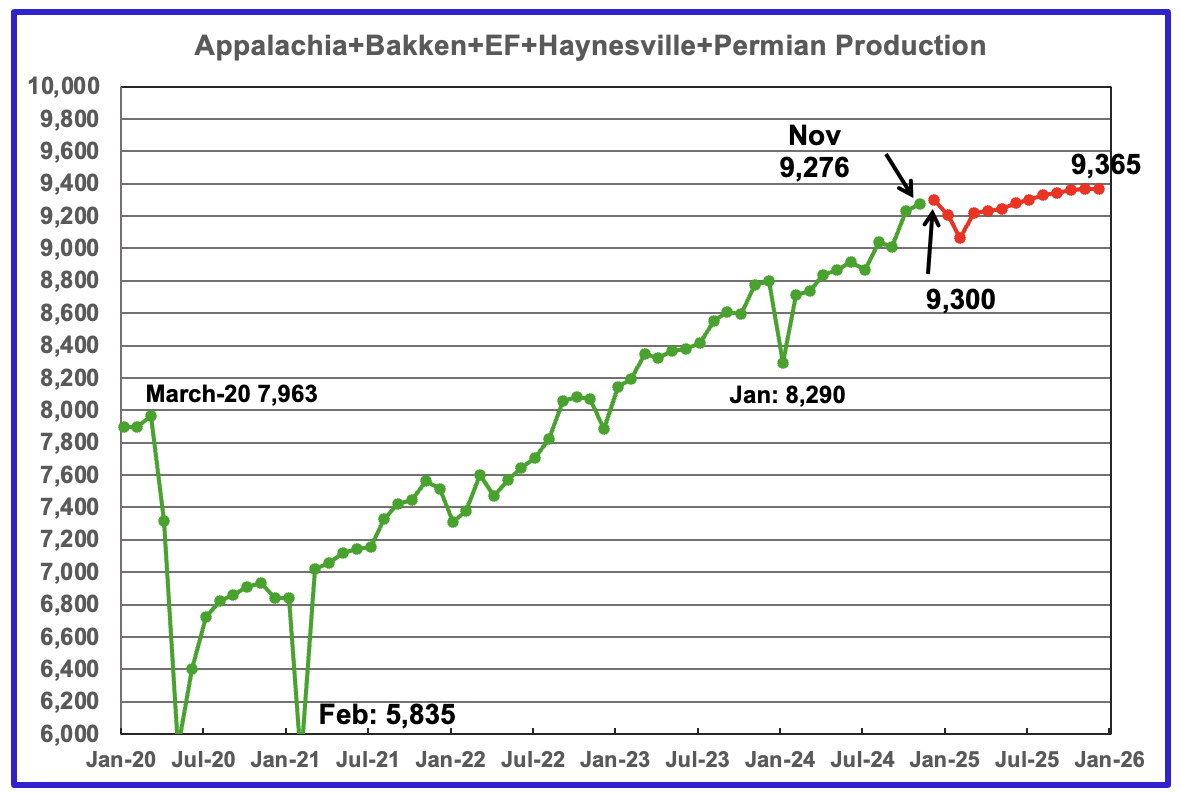
The oil production for the 5 DPR regions tracked by the EIA is shown above. Also a projection by the STEO to December 2025 has been added, red markers. Note DPR production includes both LTO oil and oil from conventional wells. DPR oil production for the Anadarko and Niobrara regions is no longer available.
The November oil output in the five DPR regions increased by 46 kb/d to 9,276 kb/d. Production is expected to grow by 24 kb/d in December to 9,300 kb/d. By December 2025 production is expected to reach 9,365 kb/d.
From December 2024 to December 2025, production is expected to grow by 65 kb/d. Note how production is flat from October 2025 to December 2025. An early indication for an upcoming plateau and possible decline.
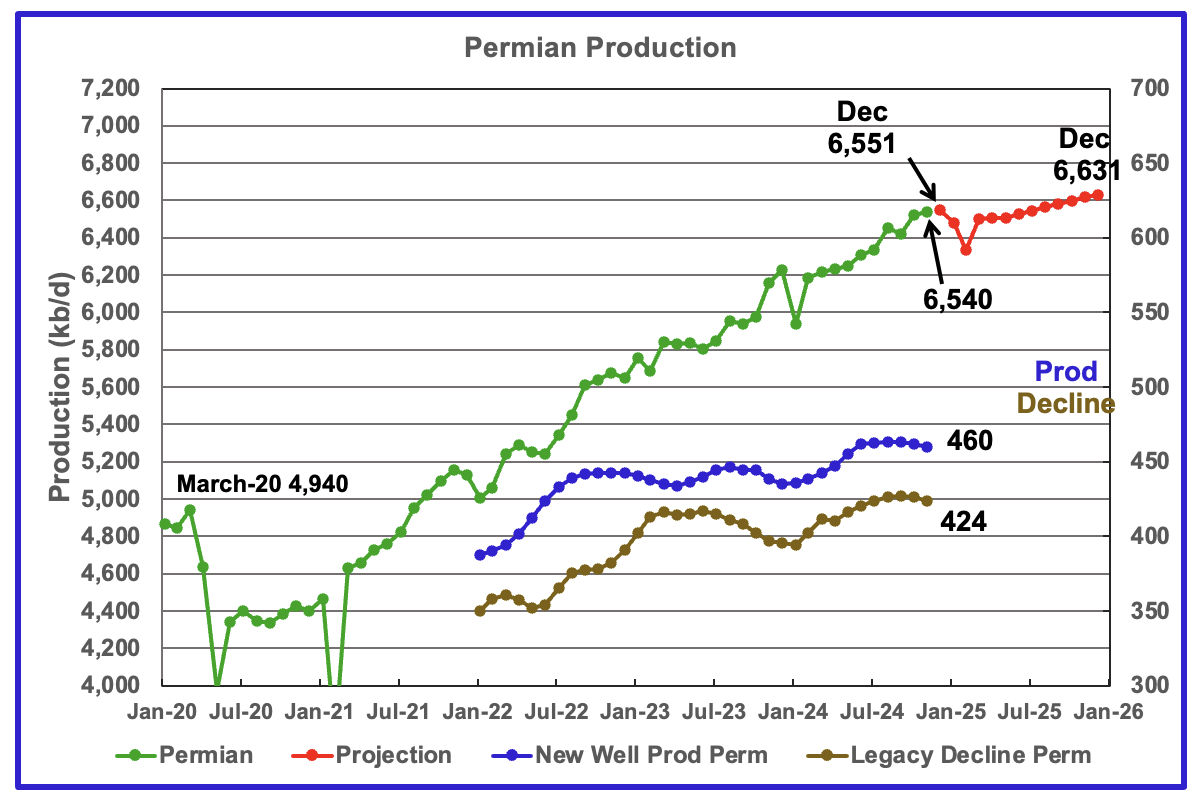
The EIA’s November DPR report shows Permian output increased by 20 kb/d to 6,540 kb/d. By December 2025 output is expected to be 6,631 kb/d.
Production from new wells and legacy decline, right scale, have been added to this chart to show the difference between new production and legacy decline.
According to the new wells and legacy decline graphs November production should have increased by 36 kb/d which is higher than the actual 20 kb/d reported.
From December 2024 to December 2025, Permian oil production is expected to grow by 80 kb/d.
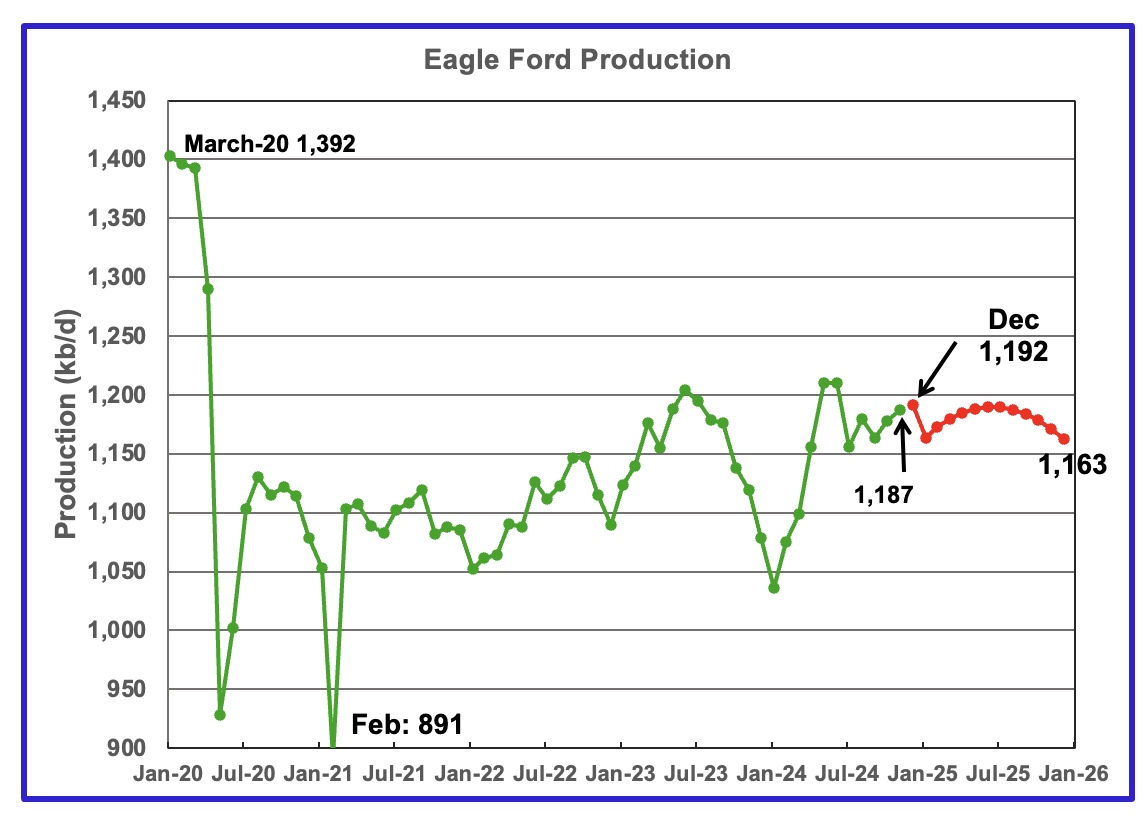
Output in the Eagle Ford basin has been increasing since January 2024 and may have peaked in June 2024. November production rose by 10 kb/d to 1,187 kb/d. Production is projected to be essentially flat going forward.Output in December 2025 expected to be 1,163 kb/d, 24 kb/d lower than November 2924. December production is forecast to increase by 5 kb/d to 1,192 kb/d.
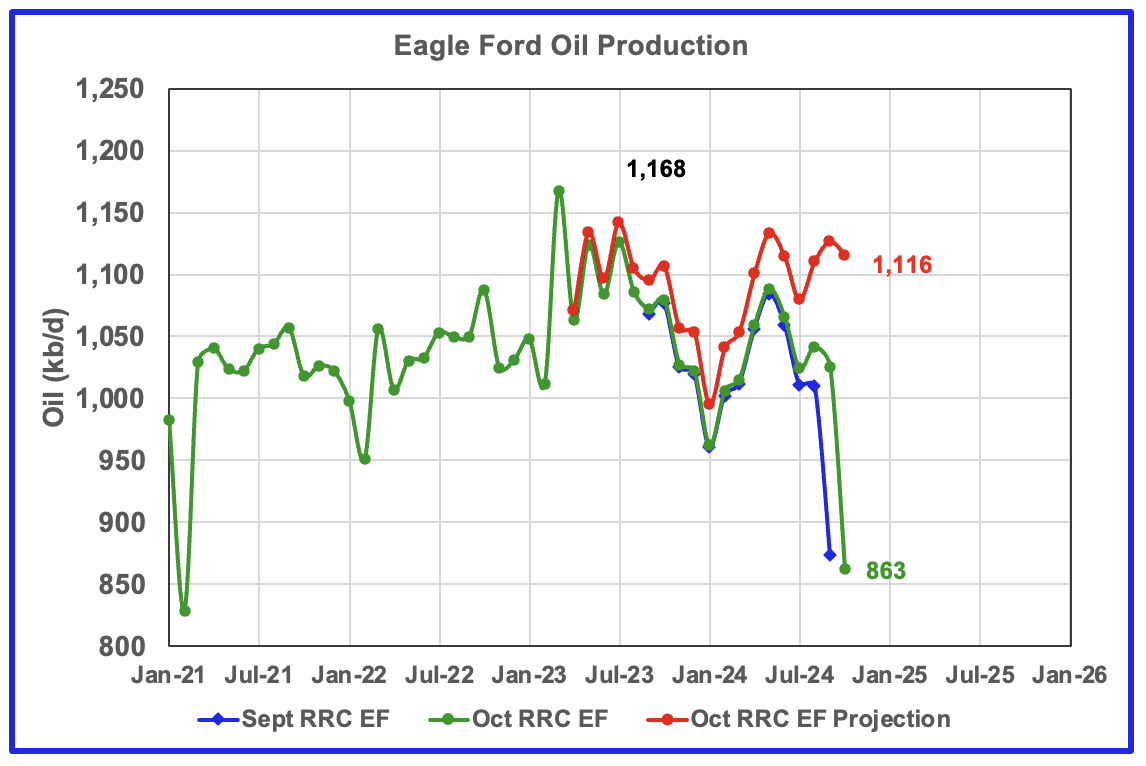
This chart estimates the Eagle Ford production using the sum of the Texas’ RRC production for Districts 1 and 2. These two districts cover most of the Eagle Ford basin. The red graph is a projection based on September and October production. The latest production data indicates that the Eagle Ford basin is in a plateau, similar to the DPR report.
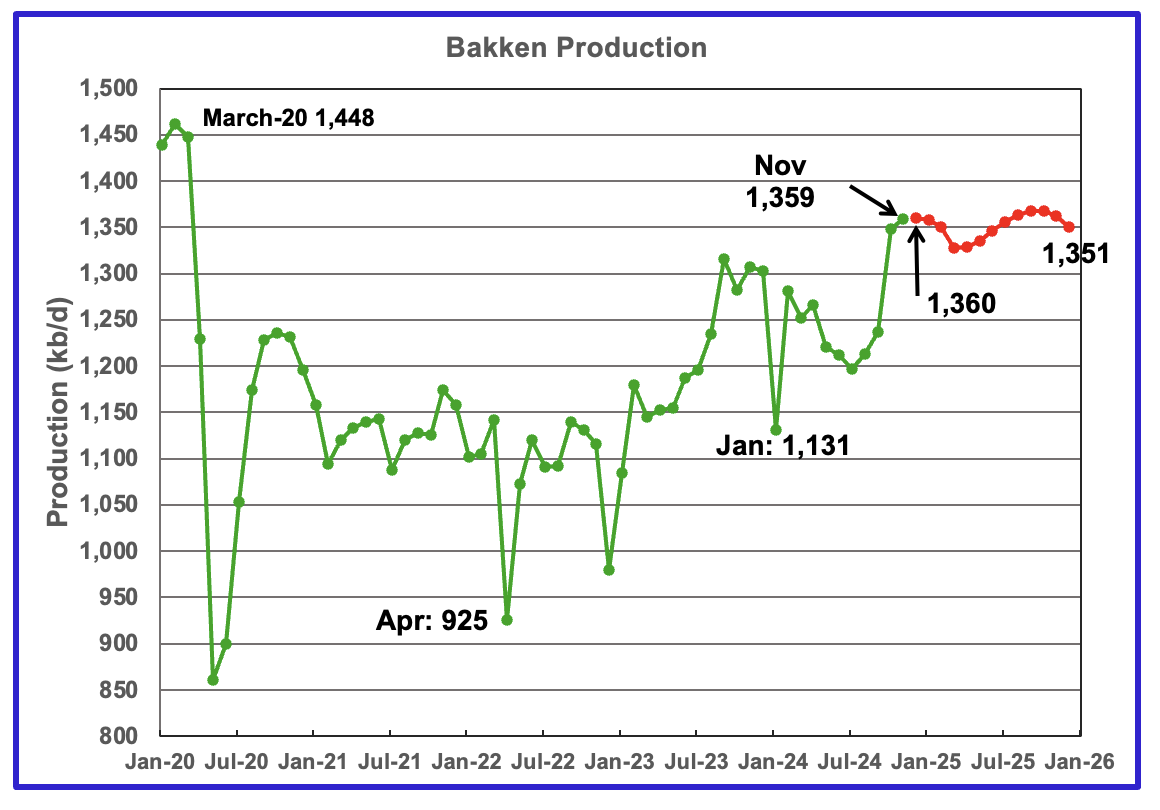
The DPR/STEO reported that Bakken output in November rose by 11 kb/d to 1,359 kb/d. The STEO projection out to December 2025 shows output varying between 1,325 kb/d and 1,370 kb/d over the next 13 months.
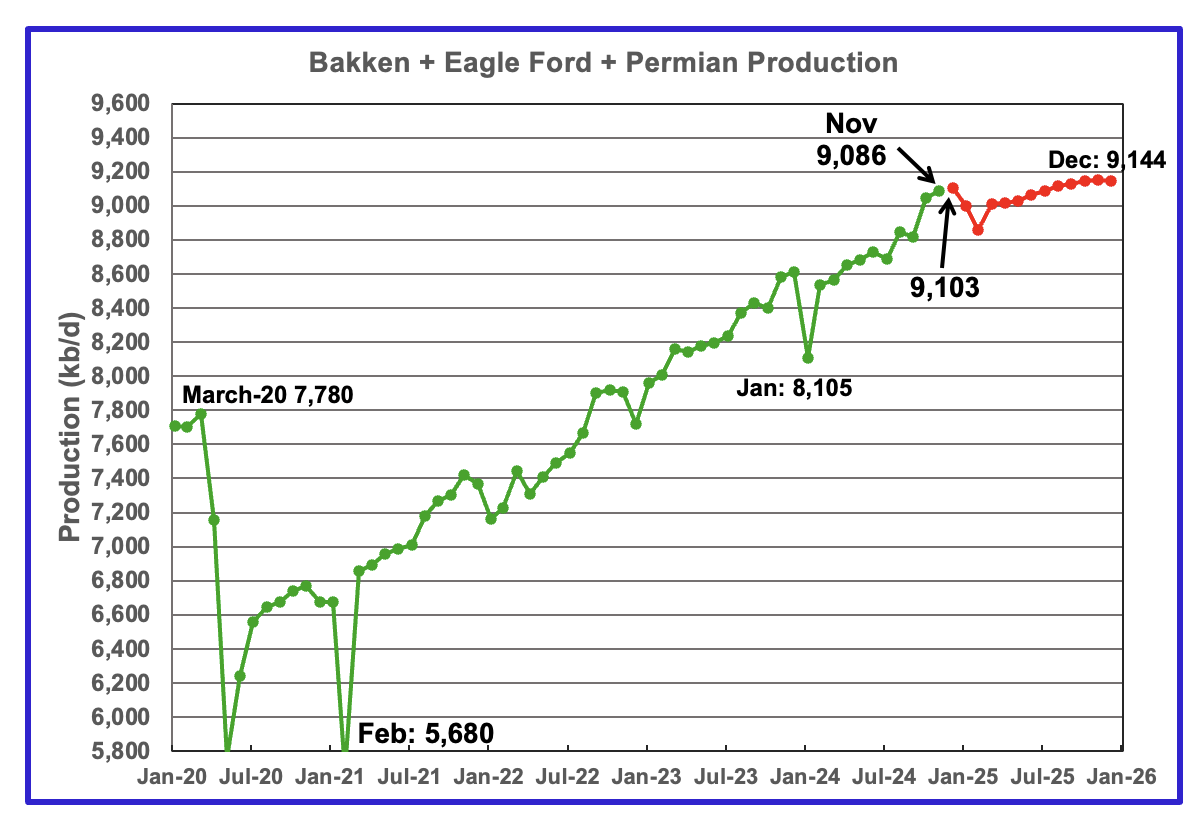
This chart plots the combined production from the three main LTO regions. For November output rose by 41 kb/d to 9,086 kb/d. Production in December 2025 is expected to reach 9,144 kb/d. This is a 46 kb/d production increase than forecast in the previous report.
DUCs and Drilled Wells
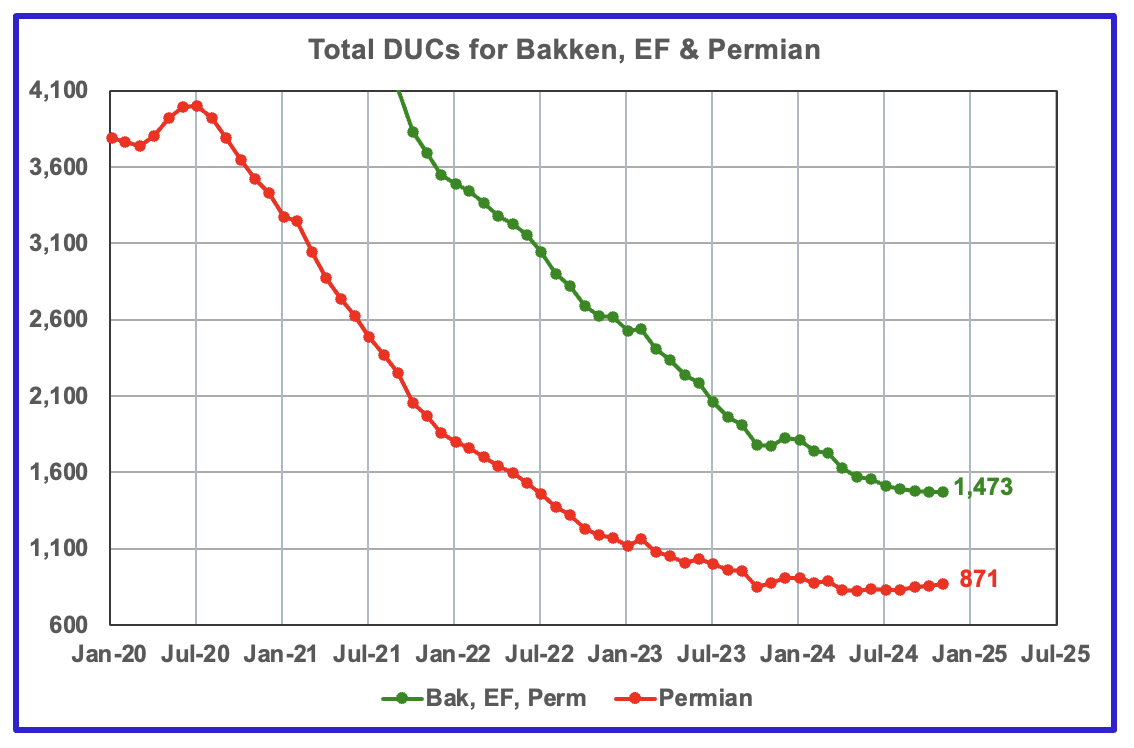
The number of DUCs available for completion in the Permian and the three major DPR regions has fallen every month since July 2020. November DUCs were unchanged at 1,473. However October was revised down from 1,506 to 1,473. In the Permian, the DUC count increased by 13 to 871.
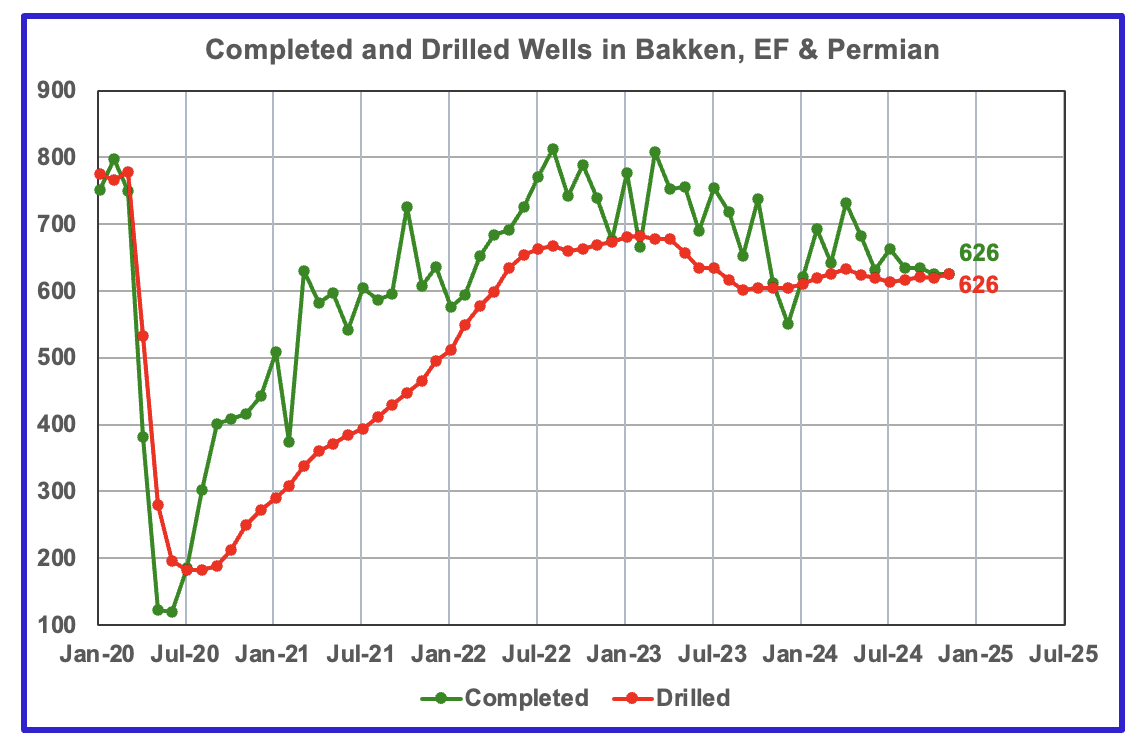
In the three primary regions, 626 wells were completed and 6626 were drilled.
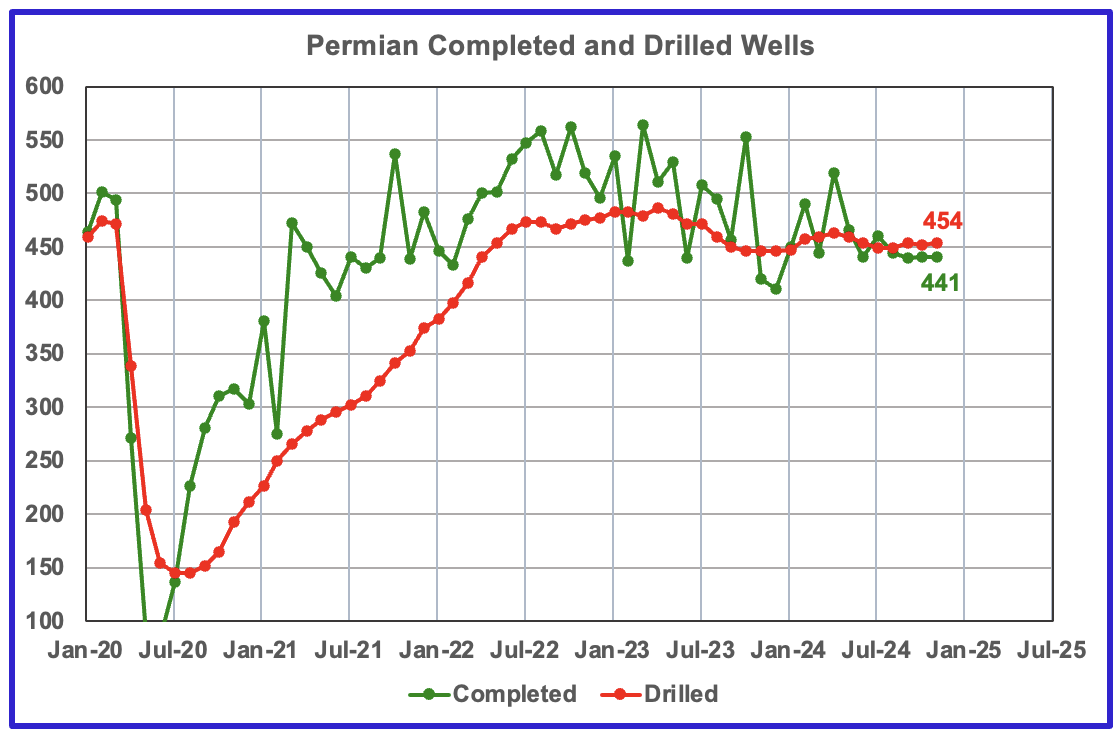
In the Permian, the monthly completion and drilling rates have been both stabilizing in the 440 to 450 range over the last 6 months.
In November 2024, 441 wells were completed while 454 new wells were drilled. This is the fourth month in a row in which the number of wells drilled exceeded the number of completed wells.
On Tuesday of this week I posted a chart showing US October Oil Production shortly after the EIA released the data.
Nony posted his comments and thoughts on why production from a number of states did what it did. I thought it would be worthwhile to repost his thoughts so that you can see them in the light of the charts above.
1. NM close to flat, down slightly. Likely just monthly noise. But we’ll see.
2. ND down significantly, but the result is temporary. Wildfires in OCT led to several pads being shut in. Should be mostly back on line in NOV, except a few that were damaged. (Source, Director’s Cut.)
3. LA was up a bit. That’s just temp hurricane shutins coming back. A microcosm of the GOM dynamic with a drop followed by return.
4. MT up also, but is now just a hair behind LA. But still interesting to see it nose forward.
Segue: Doesn’t change national dynamics or the world price. But just kind of an interesting local play to observe. Presumably because Elm Coulee was developed so early in the shale revolution there is some oil that was left behind by too-small completions or poor in-zone hzes. So, now they are going back and trying to get some of the left behind.
A little bit of this is in play in ND itself, which is still relatively old compared to the EF or Permian. Does not imply that this will happen in the Permian, since its development was later in the revolution. Well…unless 5 or 10 or 20 years from now, we have more gradual improvements in shale development. And…that would never happen right? (Just cornie wishfullnes, until it happens and the naysayers have to adjust.)
I’m teasing a little. My assumption is there will be SOME development/improvement in technology, but not as much as we saw earlier in the shale revolution. So, sort of halfway between the cornies and the naysayers. But still enough to make people like Dennis Coyne need to (once again) shift their goalposts on “when wells start to degrade”. And even more for the more-negative-than-DC types, like G&R, Berman, etc. But still, in general. But also not the crazy, crazy improvements that cornies predict.
5. OH down slightly, but still well ahead of LA and MT and KS.
6. UT down slightly. Not sure if noise or what.
7. WV up 10, but maybe just noise. Lot of up/down in their graph. And they are still nowhere near recent peaks.
8. CO up noticeably. Not sure why.
9. Bunch of other states (e.g. WY) down slightly.
10. Net, net: I think your summary of GOM and TX as most significant tells the story!
Alternative estimate for TX Midland County using the percentage of Midland C plus C to Statewide TX C plus C based on RRC PDQ data multiplied by EIA TX C plus C PSM data.
Alternative TX Martin County C plus C estimate using same methodology as Midland estimate above. Note that the most recent month in both the Midland and Martin County estimates are likely too high as the percentage rose relative to previous months and may be a data artifact due to incomplete data.
If we assume the % of these counties to statewide data remains the same as reported for September, then the October estimate drops to 702 kb/d for Midland and to 711 kb/d for Martin, but any such assumption would be arbitrary.
Dennis
It does not surprise me that you are getting a similar pattern and result for Midland and Martin. I think the issue is with the Texas PDQ data for October. There was a lot of updating/processing of older production data that is distorting the October results.
Attached is the Midland chart that was posted for July to be compared with the current one. Note that the only visible gap in the July Chart between the Orange and Green graphs is in May and June, the last two orange data points. For the months before that the difference is around 1 or 2 kb/d and essentially fall on top of each other and no gap is visible.
Compare that with the current October chart. The visible gap between the Green and Orange graphs starts in April 2024 and is very large for June to September. Those gaps to the October green graph are much larger than normal revisions by the PDQ to previous months.
It is that large gap in the methodolgy being used to project the results that is resulting in the large increase for Midland. Same goes for Martin. Hopefully the November revisions should return to normal and I expect to see Midland in decline not increasing.
Ovi,
My methodology uses current Month data only, so differences to previous months are not part of the process. The EIA 914 data is consistently very good, up to the most recent month the data will be pretty good. I use this same methodology to estimate the Permian using Districts 7C, 8 and 8A for the Permian region in Texas and Lea, Eddy, Chavez and Roosevelt counties for New Mexico Permian,
The percentage of those areas to statewide estimate from RRC and OCD for C plus C are multiplied by the EIA estimate to get the Permian estimate for each state and then they are added together. When the State data for the region is higher than this estimate, the state data is used, after that point in time the estimate methodology is used, through September the estimate is likely to be good, October will be revised.
Chart below compares the Permian region estimate with the STEO estimate.
I will reproduce my estimates for a few months and it may become clear which methodology works more consistently.
Nice work. Thanks.
One added idea: Perhaps some of the large TX jump (50+) is also from rebound in GOM state waters. Similar to the FGOM and LA GOM (presumably) rebounds. Hard to say for sure (not a huge drop SEP to OCT in TX, and there can just be random “noise” in the trend anyways). But would seem to make sense.
Nony,
By my estimate the increase in Texas output was mostly from the Permian Basin region with an increase of about 85 kb/d in October.
Ovi,
You said:
From December 2024 to December 2025, production is expected to grow by 65 kb/d. Note how production is flat from October 2025 to December 2025. An early indication for an upcoming plateau and possible decline.
Note that in the chart for the tight oil and shale gas regions that there is a stair step pattern with slower periods typically from October to March followed by faster growth periods from March to October every year from 2021 to 2024, the forecast is probably just reproducing this historical pattern. It will be interesting to see the next STEO, which may include a forecast for 2026. I doubt they will be forecasting a plateau or decline, we will know in about 11 days (Jan 14, 2024). Of course the forecasts are never correct and often revised.
Here is a comparison of the Dec 2023 STEO with the Dec 2024 STEO for US L48 excluding GOM for Nov 2023 to October 2024, the October 2024 estimate for the Dec 2023 STEO was 422 kb/d too low compared to the nost recent STEO. The STEO didn’t start breaking out the shale and tight oil regions until the June 2024 STEO, prior to this we only have the L48 excluding GOM estimate for US C plus C.
Dennis
I am not clear on the source for the Dec 24 graph. Below is a screen shot of the December 2024 STEO and it shows September and October production for L48 W/O GOM to be 11.4 Mb/d and then falling off.
Hi Ovi,
You are showing Sep to Dec 2025, my chart ends in Oct 2024.
December 2023 STEO has last data point as December 2024, the first 2025 STEO forecast came out in Jan 2024.
I used the link below
https://www.eia.gov/outlooks/steo/data/browser/#/?v=9&f=M&s=0&start=202309&end=202410&map=&ctype=linechart&maptype=0&linechart=PAPR48NGOM
Screen shot with October 2024 estimate for December STEO below and link to Dec 2023 STEO spreadsheet below (see tab4a)
https://www.eia.gov/outlooks/steo/archives/dec23_base.xlsx
Also see link following for Dec 2024 STEO https://www.eia.gov/outlooks/steo/xls/STEO_m.xlsx
Ovi,
You seem to be showing 2025 rather than 2024 on your screenshot.
Screenshot for Dec 2023 STEO, click on it to make it bigger.
Ovi,
Here is a screen shot for Dec 2024 STEO. Click on screenshot to enlarge.
Dennis
Yes I was showing Dec 2025 from the Dec 2024 STEO. In your comment above you quoted:”From December 2024 to December 2025, production is expected to grow by 65 kb/d. Note how production is flat from October 2025 to December 2025. An early indication for an upcoming plateau and possible decline.”
I misunderstood your comment to mean that the Dec STEO rolling over in October 2025 had some link to another piece of data you had.
The Dec 23 and Dec 24 legend at the bottom of you chart implied to me you were comparing the change between the December 2023 STEO and December 2024 STEO.
Ovi,
Sorry, I was not very clear. My point was to show how the EIA STEO has changed in the past 12 months. We cannot compare the STEO from Dec 2023 beyond Dec 2024 (as that was the final month of the Dec 2023 forecast). As shown in my chart October 2024 from the December 2024 STEO (this is probably pretty close to correct, though future revisions are possible) is 422 kb/d higher than the October 2024 forecast from the December 2023 STEO. Perhaps the most recent STEO (Dec 2024) is also 422 kb/d too low for October 2025, though this is obviously speculation, we will have to wait about 12 months to find out. People often think the STEO is too high, but at least for US output the Dec 2023 forecast proved too low in 2024.
I looked back at my own scenarios from Dec 2023, those were also far too low. Chart below compares my December 2023 and December 2024 US tight oil scenarios.
Ovi,
The chart was comparing the L48 excluding GOM estimate from the Dec 2023 STEO and the December 2024 STEO for the November 2023 to October 2024 period. Sorry for not being very clear.
The point was to indicate how much the STEO gets revised over time and comparison to actual data (which we have for November 2023 to October 2024). The data is also sometimes revised, especially the most recent couple of months (September and October 2024 in this case).
Here is a comparison of US L48 excluding GOM C plus C STEO in December 2023 and December 2024 from Jan 2023 to December 2024.
Data from table 4a from Dec 2023 and Dec 2024 at https://www.eia.gov/outlooks/steo/outlook.php
The difference between the Dec 2024 and Dec 2023 estimate can be moved forward by 12 months to guess at how the Dec 2025 STEO might look 12 months from now, this is called the “Modified forecast” in chart below. So the difference between the 2024 and 2023 forecast in Dec 2024 is added to the Dec 2025 forecast of the Dec 2024 STEO and likewise for every month from Jan 2023 to Dec 2025 for the modified forecast. Clearly this speculative.
I saw some chatter (sorry don’t have link now) that there’s some concern about another polar vortex in mid JAN. Lot of uncertainty if it happens or not (it’s weather). But if we get an abnormally cold/long snap in TX, that could impact production. The wells are just not as well protected as in ND, PA, etc., since this sort of freeze danger is rarer. (Similar to why Atlanta doesn’t have a lot of snow plows.)
Of course even if this happens, it would not be noticed until end of MAR, when JAN production is reported. No impact on the NOV, DEC numbers still to drop.
Nony
Attached is a possible source hinting at a January Polar Vortex hitting Texas.
According to the National Weather Service, a cold front will arrive Sunday night in Central Texas. Anticipate widespread freezes for several mornings, with the possibility of wintry precipitation between Wednesday morning and Friday night, depending on how quickly the disturbance moves.
https://www.yahoo.com/news/nws-widespread-freeze-likely-arctic-153308367.html
There’s also some chatter (can google, was a Bloomberg story), that the outgoing Biden administration is planning on putting some restrictions on oil and gas development (some related to coastal development are apparently not reversible).
https://www.bloomberg.com/news/articles/2025-01-02/biden-to-block-more-offshore-oil-drilling-before-trump-arrives
https://archive.is/W0lxb (archived to get past paywall)
Kind of shows the political versus ideological dimension, if you think pre/post election. Democrats (in general, in general) are anti oil/gas development in their core/base. But also don’t like getting blamed for gasoline prices. See this also with Harris, and even Biden briefly, making no fracking comments when talking to base audiences, but reversing them in general audience remarks.
I guess depending on your point of view, you can decide if this is glass half full (not anti oil/gas enough as left wing wants) or half empty (indulging in some anti oil/gas actions). But it’s definitely not “full”, if you want to unleash production most strongly.
Companies looking at mega projects, lease bids, infrastructure, etc. factor political risk into their calculus. It doesn’t stop all development (except with hard corps bans like the Democrats did in NY and MD), but it does increase the hurdle rate and make companies less likely to invest in borderline projects.
Nony,
For those willing to take these risks there may also be less of a problem with overproduction which could mean higher prices which would be good for those willing to take this risk.
It would be GREAT if Mr. Biden went ahead with his ban. Later on, when we begin to see a scarcity of oil, those outer continental shelf regions will be a good place to produce. At that point it’ll be easy to reverse the ban: simply invoke the National Emergency Act used in wars and national calamities. That’s a stroke of the pen, though of course the reason has to be ratified by Congress at some point.
Actually, with the frenzied development of Permian Tier-1, producing a natural gas glut and suppressing the oil price to bare breakeven levels, this may be the only way to introduce a measure of restraint. Most of that outer shelf oil has an API gravity of ~35, which is perfect for the ancient refinery network as is. Put it on ice until we really need it.
And when you get down to brass tacks, in California outer shelf waters there is lots of oil, but the state would almost certainly ban it from coming ashore. The other controversial area is off the tip of Forida. The Gulfstream is only about three miles off-shore and sometimes it bears almost straight in toward shore. Mr. Biden would be doing Mr. Trump a favor to go ahead with his ban. Win-Win.
The Rig Report for the Week Ending Jan 3
– US Hz oil rigs were down 1 to 440. They are down 19 rigs from April 19 and are up 13 relative to their recent lowest count of 427 on July 24th. The rig count has remained in a very tight range between 427 and 442 since July.
– In New Mexico and Texas the Permian rigs were unchanged at 94 and 193 respectively.
– In New Mexico, Lea was up by 1 to 46 while Eddy was down 1 to 48.
– In Texas, Midland and Martin were both were unchanged at 27 rigs.
– Eagle Ford was unchanged at 38.
– NG Hz rigs added 1 to 86.
The rig count seems to have settled into a very static situation.
Frac Spread Report for the Week Ending January 3
The frac spread count was unchanged at 201. It is also down 35 from one year ago and down by 71 spreads since March 8.
Launching the 2025 WTI Oil Price Challenge
Time to have some fun with real data we can see and will be accountable for at the end of this year. Let the Guesses begin.
You will need to make 2 Guesses
1) Closing price for WTI on December 31, 2025
2) Average price for WTI for 2024
The Dec 31 price and yearly average will be calculated from the EIA’s weekly PSM page.
https://www.eia.gov/petroleum/supply/weekly
Select the xls file for item 11 further down the page on the weekly PSM.
The WTI price in Item 11 is given in tab “Data 1” and is “Cushing, OK WTI Spot Price FOB (Dollars per Barrel)”
To keep this fair here are my non-exclusive guesses.
1) Closing Price $85/b
2) Yearly Average $75/b
All replies must be in by Jan 17. I will repost another reminder in the World update next week.
Close: $69
Average: $71
Here are my guesses:
1) Closing price for WTI on December 31, 2025 = $100
2) Average price for WTI for 2025 = $90
Hopefully I’ll do better this time around.
Happy New Year!
Ovi,
My guess is $74/b for average WTI spot price at Cushing for 2025 and $72.50/b for WTI closing spot price on Dec 31, 2025.
Thanks Ovi and Dennis for a fun 2024 contest and for repeating again. Nice job to those who were only a few bucks off. I was too optimistic!
For 2025, I will remain optimistic again and go with $82.50 for the 2025 average and ending with upside at $87.50.
Thanks again for running the contest and all the input you post here.
2025 Closing price $95 WTI, average 2025 price $85 WTI thanks OVI
1) 117.37 Closing
2) 100.01 Average
Trump attacks Iran after putting a HIT on his life before the election.
Permian Peak.
https://edition.cnn.com/2024/07/16/politics/iran-plot-assassinate-trump-secret-service/index.html
Trump has said he wants the UK to “clear the North Sea of windmills”. Presumably he thinks we could drill for more oil.
Here’s the link to the Reuters article that gives some facts about what’s happening in the North Sea:
https://www.reuters.com/world/uk/fall-uk-north-sea-oil-rise-offshore-wind-2025-01-03/
Where do Trump’s nonsensical ideas come from?
Donald Trump’s Aberdeenshire golf resort must pay the Scottish government’s legal costs following a court battle over a major North Sea wind power development.
https://www.bbc.com/news/uk-scotland-north-east-orkney-shetland-47400641.amp
Ovi, please consider doing a stacked area graph on the Texas oil counties.
David
Is your request for the four TX counties reported above in the post or for all TX counties?
David,
You can download the data from the RRC and present it. There are 254 counties in Texas so it is a big ask. We look forward to seeing it.
Data at https://webapps2.rrc.texas.gov/EWA/ewaPdqMain.do
Here are my guesses:
1) Closing price for WTI on December 31, 2025 = $75
2) Average price for WTI for 2025 = $70
Happy New Year!
Closing price $73
Average price $76
Happy New Year!
David,
Here is an area chart for Texas Permian, other Permian Counties are those except Midland and Martin counties. In September 2024 Martin and Midland county C plus C output was about 32% of Texas Permian Basin C plus C output.
Chart for all of Permian including both Texas and New Mexico with “other counties” being those counties in the Permian Basin that are not Lea, Eddy, Midland, or Martin Counties. In September 2024 the largest producing counties in the Permian Basin (Lea, Eddy, Midland, and Martin) produced about 53% of Permian output. Also since 2021 about 75% of the increase in Permian basin output has come from the 4 largest producing counties (about 1500 kb/d of 2000 kb/d).
For reference, here is the full Texas counties production ranking sorted by crude for Sept 2024:
https://www.rrc.texas.gov/media/1d0ne3hw/2024-09-monthly-production-county-oil.pdf
Thanks Gunga,
Interesting how much condensate from Reeves. Loving and Ward Counties in the Texas Delaware sub-basin of Permian. A ton of gas from Reeves relative to crude. We often look at C plus C, but the crude is more valuable, so the higher proportion of crude from Loving(60% crude) relative to Reeves (40% crude) is interesting. Note that I focus on the Permian where of the top 11 counties all are from Permian except Karnes (Eagle Ford core county).
I know you know this, others may be less familiar with the Texas counties.
Here’s the link to the page to pick ranking by Crude, NG or condensate:
https://www.rrc.texas.gov/oil-and-gas/research-and-statistics/production-data/texas-monthly-oil-gas-production-by-county-ranking/
Permian top 8 counties as of October 2023 were Lea and Eddy of New Mexico, and Martin, Midland, Reeves, Loving, Howard, and Upton counties in Texas. In September 2024 these 8 counties produced about 77% of all Permian Basin C plus C output. The “Permian other counties” for this chart are those that are not any of the top 8 counties mentioned earlier in the comment. Since Dec 2020 Permian Basin C plus C output has increased by 2126 kb/d and the top 8 producing counties increased their C plus C output by 1739 kb/d (about 82% of the total increase).
Chart below by David Archibald for top 11 Texas counties, no adjustment is made for incomplete RRC data, as I do for my estimates (I use % of county output to statewide output multiplied by EIA PSM which is a more complete estimate of Texas output for the most recent 18 months (April 2023 to October 2024).
10 of these 11 counties are Permian Basin counties, only Karnes is not (that is the core of the Eagle Ford).
Also this chart might not include condensate, which is usually included in US output, but is broken out in Texas RRC data. For New Mexico OCD, they combine crude and condensate and simply call it produced oil. In my area chart “oil”= C plus C.
Original chart can be found at link below
https://www.oilystuff.com/forumstuff/forum-stuff/the-top-11-oil-producing-counties-in-texas
Interesting posts on this at oilystuff (link in previous comment).
Spreadsheet with my estimates combining RRC and OCD data with EIA PSM estimates for Texas and New Mexico at link below
https://drive.google.com/file/d/1TiLgWpA-KDTXoGz0eB8Yj0B0LWgllXwn/view?usp=sharing
Chart with top 6 increasing counties from Oct 2021 to Oct 2024 and rest of Permian (excluding those 6 counties which are Lea, Eddy, Martin, Midland, Upton, and Loving counties).
Howard County
Howard, Reagan and Reeves have Wolfcamps at the shallower depths, i.e. lower reservoir pressure, and yet higher original GOR (decided by maturity), and they are actually higher initial maturity and GOR than deeper part of Permain, i.e. Lea,Loving, Midland and Martin.
The maturity-depth in Permain Wolfcamp is reversed in the 2 subbasins.
Sheng Wu,
Howard County is in the Midland Basin along with Martin, Midland, and Upton Counties. Reeves and Loving are in the Delaware Basin along with Lea and Eddy Counties in New Mexico.
Reagan is also in Midland sub-basin.
Permian Basin past 13 months (Oct 2023 to October 2024).
Any opinions here on low inventory levels at cushings secondary to TML diverting more Canadian supply to their west coast. Seems to have perhaps interfered with the heuristics. How’s this gonna shake out over the next few years? Asking for a friend.
Survivalist
Not sure I fully understand your question. I am surprised that TMPL crude is heading for California. According to the attached article, the EIA states that 50% of the TMPL crude goes to California.
The reason this is surprising is because California has mandated a Low Carbon Fuel Standard. It has recently been made more strict. The intent is to reduce the carbon content of the fuel. The hook is that the fuel’s carbon content is measured by tracking the carbon emitted from birth, oil coming out of the ground, to death, combusted in an engine. Since the oil sands are considered to be high carbon fuels, I am unclear how the Cdn oil helps California refiners. One advantage is that it is inexpensive, $12 to $15 lower than WTI and very good for making diesel, compared to oil from other sources.
https://www.eia.gov/todayinenergy/detail.php?id=63564
“Carbon intensity for the LCFS program is measured through lifecycle analysis of a fuel which includes all steps from extraction, transport, and production.
Compliance with the LCFS began in 2011. The program is designed to lower the carbon intensity in fuels by assessing each step in their production, from extraction to combustion.”
https://enginetechforum.org/policy-insider-blog/posts/cutting-carbon-in-california-thanks-internal-combustion-engines-and-renewable-fuels
“If the price differentials remain near current levels through the end of the year, it may suggest that the added TMX capacity has helped to insulate Canada’s crude oil producers from the operational decisions of refiners in the U.S. Midwest.”
Bingo!
Thanks Ovi. Great info. Perhaps WCS will uncouple from WTI as it’s benchmark.
The other point is that Canadians may have double thoughts about divert more of their oil through the TMPL. They have perhaps in head the threats of Donald of raising the tariffs of 25% with Canada. The capacity of the TMPL has been increased from 300 kb/d to 980 kb/d.
Why would they have second thoughts about TMPL? I don’t follow.
Trump wants to raise the tariffs with Canada. That could impede oil exports of Canada in USA. So, instead sending their oil to USA, they could send their oil toward Asia, for example.
Jean
Canada exports over 4Mb/d to the US. That is more than 4X what TMX can carry.
I know that, Ovi. That’s why when Trump is threatening with raising tariffs, the oil men of Canada are bound hand and foot in face of the decisions of USA because all their system of pipeline is oriented toward US. I emit the hypothesis that they increased the capacity of the TMPL in order to go around this issue, just to have a few more customers.
Jean
Definitely helps to be able to send an extra 600 k barrels to Asia.
It also reduced the price differential to WTI by close to $5/b.
Ovi,
Has the oil been going to Asia or West Coast US?
On Geopolitics; Pipelineistan.
Now that Russia and Assad are out of the way in Syria, the Qatar–Turkey pipeline begins to look more feasible. The transit fees will rebuild Syria. It will perhaps relieve Europe of much reliance on natural gas from Russia, which is nice.
https://en.m.wikipedia.org/wiki/Qatar–Turkey_pipeline
https://www.aa.com.tr/en/energy/energy-diplomacy/turkiye-qatar-natural-gas-pipeline-could-be-revived-says-turkish-energy-minister/46164
Here’s a simple map of the route
http://iraqieconomists.net/en/wp-content/uploads/sites/3/2016/06/Qatar-Turkey-Pipeline-image.jpg
This one won’t happen.
https://en.m.wikipedia.org/wiki/Iran–Iraq–Syria_pipeline
This is a positive development for a Europe wanting to get off of Russian energy, and not wanting to accommodate Iran and Assad. Putin scuttled Nabucco, but now he’s kinda f*cked.
https://en.m.wikipedia.org/wiki/Nabucco_pipeline
Post by Art Berman from about a year ago.
https://www.artberman.com/blog/beginning-of-the-end-for-the-permian/
graphic below from that piece.
My estimates for oil EUR for Permian wells are
2018 – 384 kbo
2019 – 427 kbo
2020 – 441 kbo
2021 – 465 kbo
2022 – 443 kbo
It is too early to make a judgement on 2023 wells with the data I have from April 2024 from Novi labs.
I don’t think Berman has done a very good job with his estimates. I assume a terminal decline rate that is exponential at 12.5% per year after about 90 months of hyperbolic decline, I assume wells are shut in at about 14 bo/d.
Dennis Coyne: “I assume wells are shut in at about 14 bo/d.”
Hmmm. There are going to be 50,000 such wells, thereabouts, in the Permian. All in terminal decline. At 14 blls/d, that’s 21,000,000 blls/month. Considering an energy shortage partly due to oil scarcity, one-hundred-dollar oil would make the monthly income stream $2.1B. Sure, they’re all going to be dead wells some day but P & A seals them for good. According to current considerations, one of ten will eventually be refrack candidates, probably using expandable 3.5″ tubular systems and sequential plug and perf from the toe to the heel. Some of the others will doubtless be considered candidates for EOR using supercritical Carbon Dioxide, at the end of which they’ll serve as carbon sequestration caverns. I’m not being a pollyanna here but as oil becomes scarce–and I think it will–then more interventions will be used to get at the last few barrels where a big infrastructure exists. Therein lies the rub: most of the OOIP still lies within the source rock, but maybe not forever.
Gerry,
An oil pro suggested about 15 bopd for shut in, the point is simply that the EUR estimates of mine may be conservative.
What shutin rate of production makes sense to you? I had used 10 bopd and was told by an oil pro that was too low, so I adjusted based on that input. I can use any rate, even 2 bopd. Just looking for something realistic.
Gerry,
I do agree this 14 bopd cutoff seems too high. The assumption is based on oil prices remaining at about $70/bo in 2024 US$ long term or lower. Note that at 15 bopd shutin EUR=442 kbo, at 10 bopd shutin EUR=455 kbo, at 5 bopd EUR=468 kbopd, and at 3.5 bopd EUR=474 kbo for the average 2022 Permian well (first flow in 2022). So about an extra 30 kbo potentially from 120k total wells to be drilled which would be a total of 3.6 Gb, if it is profitable to continue producing down to 3.5 bopd for a horizontal fracced well. Much will depend on future oil prices and future demand for oil.
Dennis Coyne: “Much will depend on future oil prices and future demand for oil.”
That’s the catch. That and what might possibly be done with these dying wells. In the past your value of 14 bopd was certainly valid, and it may continue to be, but we are moving along fairly rapidly toward tightening of the global oil market.
While the picture that keeps getting painted is one of decreasing global oil demand, I think it possible to paint, in reality, just the opposite. And while Big Oil (and sellers of companies) have talked up domestic oil independence, I think just the opposite might occur here, too.
I see a world embracing AI to the point almost of a new type of industrial revolution–as a means of survival. As AI really sweeps the world the need for electricity is going to absolutely skyrocket, and that is going to siphon off all the NG.
So in my futuristic scenario we’re down to oil, and the Permian is going into deeper decline. Just as a way to get at the source rock oil was taken to a new level by Mr. Mitchell in the late nineties, a way to get at the 90% of it still remaining will likely appear. We’ll never get it all, of course, but maybe another 3%?
I realize you’re much more optimistic about green energy transition and also EV’s than I, and this note is in no way a put-down of that concept, I just have a different way of looking at it. I think that by the time the “Great Wave” of terminal decline hits the Permian 50,000 wells secondary recovery methods will be flourishing. And because of that, I have a feeling that these old wells are going to be kept going as long as the TRRC will let them stay alive. The secondary recovery phase will likely be quite a show.
Gerry,
Perhaps you are correct, many different future scenarios can be imagined, not possible to know in advance which guesses are correct. Unclear if the secondary recovery of tight oil will be able to compete with imported oil from Canada, Guyana, Brazil, Argentina, and OPEC. We will know more in a few years. I am certain that I am not correct in my guesses about the future.
Gerry,
Are you thinking that oil would be used to generate electricity? For better or worse, if skyrocketing electricity demand strains NG supply (and PV & wind), wouldn’t the “swing” producer/backup for electrical generation be coal, not oil?
Gerry,
You mention 50 thousand Permian wells, I think there are roughly that number of wells now and expect there will be another 70 thousand wells completed in the future in the Permian which would bring us to about 120 thousand wells. Did you mean 50 thousand future wells completed in the Permian, or do you anticipate no future wells will be completed? The 50 thousand number of wells you suggest confuses me. Just trying to understand your point of view.
Dennis.
To chime in here, much depends on amount of produced water.
14 BOPD doesn’t work if 500 BWPD has to be trucked.
2 BOPD works if there is no produced water and the well pumps so slowly and intermittently that down hole failures are measured in decades.
Whether the well pumps off of produced gas, electricity or propane also is a big consideration.
Shallow sand,
Yes water will make a difference, I am doing basin averages, there are a lot of horizontal wells producing oil in the Permian that produce 14 bopd or less, so I am guessing that for those wells it is profitable to continue producing. I imagine all the wells produce some water, I no longer have access to any data for Permian from Novi labs. In 2023 about 900 million barrels of water per month on average were disposed in Texas (data from RRC) or about 30 Mb/d. Oil output was only about 6 Mb/d so about WOR of about 5 on average. A lot of the water from New Mexico is disposed in Texas so if we include that oil (2 Mb/d) the WOR drops to around 4.
Shallow sand,
Many of the large operators might have pipelines set up for water disposal? In any case if most operators are near the average, a 14 BOPD well might result in 50 to 60 BWPD of water disposal and perhaps less as I imagine a lot of the water disposed is from initial frac water (though I speculate). New Mexico has about 3.5 BW per BO for 2023 average according to state data from OCD.
Shallow Sand,
Can we roughly estimate the cost per barrel to dispose of produced water?
$1 per barrel in the Permian back in 2019.
I’d guess it’s more now?
We pay about $1 to have our water hauled. But we have our own disposal nearby?
I found a disposal well for sale in Martin County. Net monthly income of $224k on 682k BW disposed.
So between trucking and disposal fees, could be $1.50 to $2.00 per BW?
Thanks Shallow sand,
So if my guess of about 4 barrels of water per barrel of oil on average is correct and your cost estimate is about right, this would be about $8 of water disposal costs per barrel of oil produced in Texas and New Mexico on average. Clearly it would vary greatly from well to well.
Truck hauling water and disposing of it in commercial salt water disposal wells is expensive.
I’m taking a stab at guessing the cost in the Permian Basin.
Hopefully there is someone reading who knows the actual cost.
Shallow sand,
I appreciate you making the attempt to estimate these costs, I was taking the high side of your estimate $2/BW and multiplting by my assumed average of 4 BW per BO for Texas and New Mexico based on RRC and OCD (NM) data for 2023 for Texas and New Mexico. Your estimate is far better than anything I could do as you know how the real oil field operates in your Basin.
I found this presentation
https://producedwatersociety.com/wp-content/uploads/2021/07/00130_Solaris-Midstream-Presentation.pdf
where it suggests the water oil ratio (WOR) for Permian averages about 6 BW per BO, so if water disposal is $2/bW this would imply water disposal costs of about $12/BO. By contrast the Eagle Ford has a WOR that is about 6 times lower than the Permian Basin average.
A 2018 article on water disposal in Permian
https://jpt.spe.org/rising-tide-produced-water-could-pinch-permian-growth
The article notes significant differences between water cuts in wet and dry areas of Midland and Delaware sub-basins and that generally the Delaware basin has higher amounts of water per barrel of oil than the Midland.
Produced water.
https://www.texastribune.org/2023/08/17/texas-oilfield-wastewater-rivers-tceq-fracking/
Art must be making up some dramatized data, i.e. jack up 2018 and 2019, and lower 2022~2023 to show the decline in EUR in the past 2~3 years, i.e. 2022~2023.
He also did similar thing for Haynesville.
For those who missed the launch of the Oil Price Challenge above
Launching the 2025 WTI Oil Price Challenge
Time to have some fun with real data we can see and will be accountable for at the end of this year. Let the Guesses begin.
You will need to make 2 Guesses
1) Closing price for WTI on December 31, 2025
2) Average price for WTI for 2024
The Dec 31 price and yearly average will be calculated from the EIA’s weekly PSM page.
https://www.eia.gov/petroleum/supply/weekly
Select the xls file for item 11 further down the page on the weekly PSM.
The WTI price in Item 11 is given in tab “Data 1” and is “Cushing, OK WTI Spot Price FOB (Dollars per Barrel)”
To keep this fair here are my non-exclusive guesses.
1) Closing Price $85/b
2) Yearly Average $75/b
All replies must be in by Jan 17. I will repost another reminder in the World update next week.
@OVI
Hmm. I shall assume that the Ukraine war ends this year and that Trump manages to reverse at least some of the recent Biden embargo on US offshore drilling.
Both of which will tend to depress prices over the coming months.
So my guesses are:
WTI on 31st Dec 2025: $70
WTI average for 2025: $75
Thanks OVI,
Jonathan
December 9, 2024 piece on Permian frac operations.
https://pboilandgasmagazine.com/the-art-of-the-frac/
Here are mine:
Average price for WTI for 2025 = $73
Closing price for WTI on December 31, 2025 = $72
My guess:
2025 average of $80
Closing price of $95
More cuts: https://worldoil.com/news/2025/1/6/opec-production-dips-in-december-as-uae-implements-supply-cutbacks/
For 6 key producers, currently declining by 1 mb/d annually
US no longer able to offset
2022- 33 mb/d
2023- 32 mb/d
2024- 31 mb/d
Kengeo,
Which producers are the 6 key producers?
3 year average (32 mb/d):
Saudi’s – 9.7 mb/d (exporter #1)
Russia – 9.5 mb/d (exporter #2)
Iraq – 4.3 mb/d (exporter #5)
UAE – 3.0 mb/d (exporter #6)
Iran – 2.9 mb/d
Kuwait – 2.6 mb/d (exporter #9)
Kengeo,
4 of these producers have spare capacity on the order of 2 to 2.5 Mb/d. They are holding back output so that oil market is not oversupplied. Russia and Iran might be at capacity due to international sanctions.
Currently OPEC spare capacity is about 2.5 Mb/d, the decline you speak of is voluntary if you are talking about the top 6 OPEC producers.
All EIA sites were down yesterday and are still down today. Must be the weather.
As I was walking up the stair
I met a man who wasn’t there
He wasn’t there again today
Oh, how I wish he would go away
Just a little poem to lighten the load ☺️
EIA is back up, World data for September is up.
The September Non-OPEC and World Oil Production Report will be posted on Saturday January 11.
Response to Nick G:
Yes, I think that coal will play a large backup role in global supply of electricity for AI. Oil, not so much. As you know, oil and gas (and coal) are inelastic commodities, so a mere tightening of supply would raise prices substantially, which would bring to light the possible conundrum of inadequate hydrocarbons. I’m like everyone else hoping this all goes smoothly.
I wonder if oil and gas would follow the same price curve.
A lot of gas in the US is associated with oil, and in part for that reason gas seems to be relatively cheap right now. OTOH, if demand for gas were to rise sharply, that would increase revenue from O&G wells whose economics are now marginal. That would suggest higher output of oil (and NGL) than would be the case otherwise, which would tend to depress oil prices a bit compared to the status quo.
So, I’m thinking that a sharp rise in electricity consumption would raise the consumption (and price) of gas and coal, but not of oil. That would accelerate investment in and production of everything (gas, associated oil, coal, wind and solar), and perhaps reduce the price of oil a bit.
To Dennis:
Basically I was referring to the roughly 50,000 current horizontal wells in the Permian. Soon they will begin their “death march,” held irretrievably by the depletion of terminal decline. Back from them is the current crop, and still farther are the soon-to-be-drilled and the last-to-be-drilled wells, however many that will be.
If there truly is validity to the peak oil concept–and I think there is–then somewhere along the way the realization will hit that we are at last, truly and unequivocally, going to run out of oil in the great American shale basins. That seed was recently planted by the nice article, “The Depletion Paradox.” However, it’s still conjecture, as the price of oil–the most inelastic of inelastic commodities–is trading as though we are grotesquely and will be forever oversupplied.
But somewhere along the path forward, as 50,000 expensive, highly publicized horizontal wells start to die, and a $250,000 P&A operation is contemplated, I believe there will be a continuous “Hmmm” followed by the question, “Is there anything left in these?” Maybe I’m dreaming (as I write this it does sound pretty foolish), but if Goehring and Rozencraijg are right, and the halfway point of depletion is actually where decline of the field sets in, then a great number of people are going to start to get nervous at one time. I believe there will be a vetting process to determine what can be done to get more yield from these old wells.
Gerry,
Based on a well known oil pro’s remarks, it seems doubtful that the EUR can be boosted much, I agree however that high oil and natural gas prices could change things, just not sure if the high oil prices I have been expecting since they dropped in 2015 will ever return, usually oil prices do the opposite of what I think they will do.
Gerry,
Thank you for the clarification on the 50,000 wells, we seem to be on the same page on the number of horizontal wells in the Permian. Wells completed in the past years have been about 5000, so about 50,000 wells per decade if that rate continues (it probably will be less in my view) and perhaps 25000 wells per decade over the following decade as completion rate will likely decrease over time after 2033. The scenario below is a bit optimistic with total Permian horizontal wells completed at 141 thousand by Feb 2045 (month with last well completed for scenario). URR is 56 Gb and peak is late 2030 at 6433 kb/d of Permian tight oil output. Current output is about 6000 kb/d in October 2024.
Correction:
I said:
“Wells completed in the past years have been about 5000, so about 50,000 wells per decade”
I should have said:
Wells completed in the past year have been about 5000, so about 50,000 wells per decade
The scenario above assumes about 5760 wells per year are completed from 2025 to 2032, roughly the level of 2024 Q3 and Q4. It is also assumed that new well EUR decreases at 1% per year starting in 2025 (that is likely to be an optimistic estimate, in my opinion.)
The Rig Report for the Week Ending Jan 10
– US Hz oil rigs were down 2 to 438. They are down 21 rigs from April 19 and are up 11 relative to their recent lowest count of 427 on July 24th. The rig count has remained in a very tight range between 427 and 442 since July.
– In New Mexico and Texas the Permian rigs were unchanged at 94 and 193 respectively.
– In New Mexico, Lea and Eddy were unchanged at 46 and 48 respectively.
– In Texas, Midland and Martin were both unchanged at 27 rigs each.
– Eagle Ford was unchanged 38.
– NG Hz rigs dropped 3 to 83.
Frac Spread Report for the Week Ending Jan 10
Fracs Dropped below 200
The frac spread count dropped by 6 to 195. It is also down 39 from one year ago and down by 77 spreads since March 8.
https://www.youtube.com/watch?v=3zLWAhxkG7g
5 minutes
California heading for an energy crisis?
Peter is not up to date.
“About 305,000 b/d of mostly heavy sour Canadian crude has loaded at the Westridge terminal in Vancouver in the six months since the pipeline made its debut, according to analytics firm Vortexa, hitting a record of nearly 415,000 b/d in October (see graph). US west coast refiners received just over 150,000 b/d during this period, up from less than 40,000 b/d a year earlier, and deliveries rose to a high of nearly 205,000 b/d last month (see graph). Most TMX crude destined for the US west coast has gone to Californian refiners, with Marathon, Chevron and Phillips 66 emerging as consistent buyers.
Proximity to Vancouver and cheaper prices are attracting west coast buyers to TMX grades. The voyage time to California takes four days, compared with 10-14 days for Ecuadorean grades and over a month for Saudi crude.”
https://www.argusmedia.com/en/news-and-insights/latest-market-news/2629805-us-west-coast-refiners-boost-canadian-tmx-intake
An update to Non-OPEC and World Oil Production has been posted.
https://peakoilbarrel.com/september-non-opec-and-world-oil-production-drops/
A new Open Thread Non-Petroleum has been posted.
https://peakoilbarrel.com/open-thread-non-petroleum-january-11-2025/