By Ovi
The focus of this post is an overview of World oil production along with a more detailed review of the top 11 Non-OPEC oil producing countries. OPEC production is covered in a separate post.
Below are a number of Crude plus Condensate (C + C) production charts, usually shortened to “oil”, for oil producing countries. The charts are created from data provided by the EIA’s International Energy Statistics and are updated to February 2024. This is the latest and most detailed/complete World Oil production information available. Information from other sources such as OPEC, the STEO and country specific sites such as Brazil, Norway and China is used to provide a short term outlook.
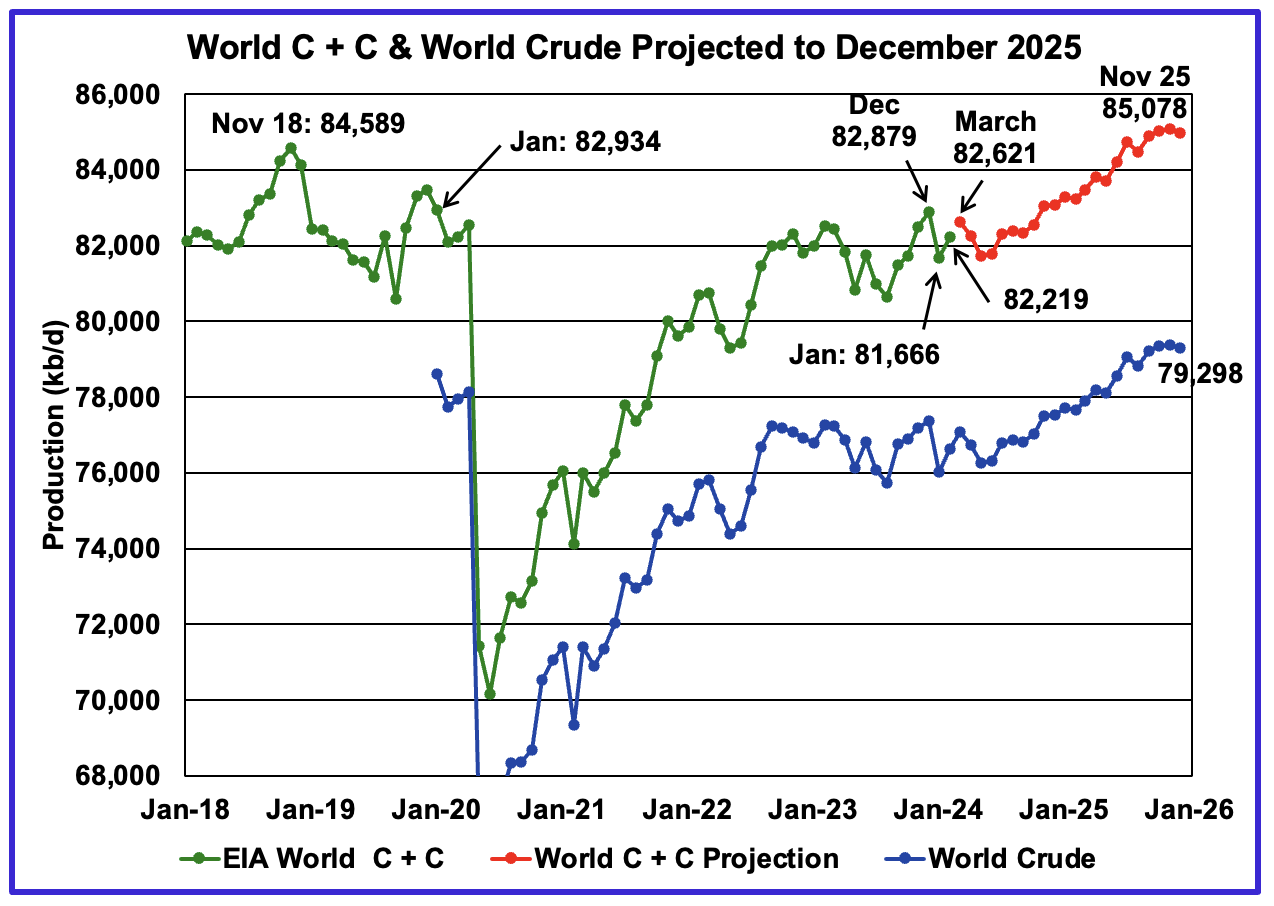
World oil production increased by 553 kb/d in February to 82,219 kb/d, green graph. The largest increase came from the U.S., 578 kb/d. March’s World oil production is projected to rise by 402 kb/d to 82,621 kb/d. As a check on the estimate for February 2024 that was made in the previous forecast, it was 82,204 kb/d, low by 15 kb/d.
This chart also projects World C + C production out to December 2025. It uses the June 2024 STEO report along with the International Energy Statistics to make the projection. The red graph forecasts World oil (C + C) production out to December 2025 using the STEO’s crude oil report.
From December 2023 to December 2025, World oil production is estimated to increase by 2,199 kb/d while crude output is forecast to rise by 1,930 kb/d.
For December 2025, production is expected to be 84,988 kb/d. It is preceded by a November 2025 peak that slightly exceeds 85,000 kb/d. The December 2025 forecast is 384 kb/d higher than reported in the previous World update and is also higher than the November 2018 peak.
A note of caution. The June STEO is now reporting/forecasting only Crude production which is also shown in the chart. As a result the red C+C graph is a projection based on the crude graph.
There is a significant change in the ratio (C + C)/C over the last four months of reported crude production relative to the previous four months. The average (C + C)/C ratio for the latest 4 months is 16% higher than the previous four months This difference makes a significant change to the projection. The red graph uses the average for last four months of data to make the forecast.
The issue is why are the last four month ratios higher than the previous four months. In the latest four months Iranian condensate production increases by 15% to 20% over the previous four months.
A few more months of data will be required to determine the best way to project C + C production from crude production.
The STEO completed its forecast for this month’s report on June 6th. On June 2, OPEC + announced that eight of its members would begin to unwind their 2,200 kb/d cutback starting in October 2024. The question is whether that announcement affected the current STEO report. Comparing the previous STEO report with the current one, it appears that output in December 2025 was increased by 160 kb/d, a minimal change. A reasonable conclusion would be that the OPEC + announcement had minimal impact on the June report. That is not to say that the STEO already had foreseen part of that increase in its previous reports.
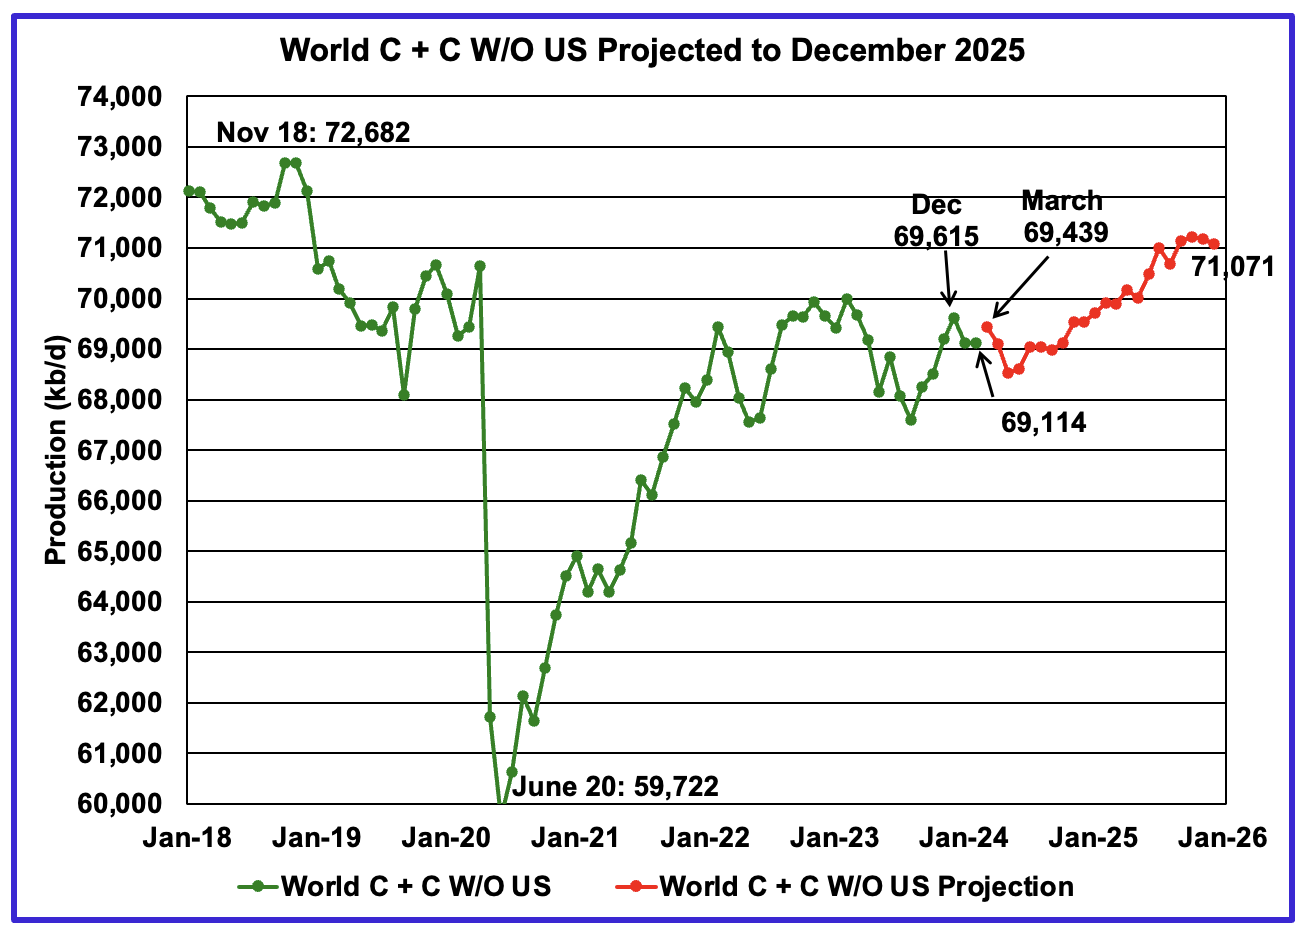
World without US February oil output uncreased by 1 kb/d to 69,114 kb/d. March production is expected to increase by 325 kb/d to 69,439 kb/d.
Note that December 2025 output of 71,071 kb/d is 1,611 kb/d lower than the November 2018 peak of 72,682 kb/d.
World oil production W/O the U.S. from December 2023 to December 2025 is forecast to increase by a total of 1,456 kb/d.
A Different Perspective on World Oil Production
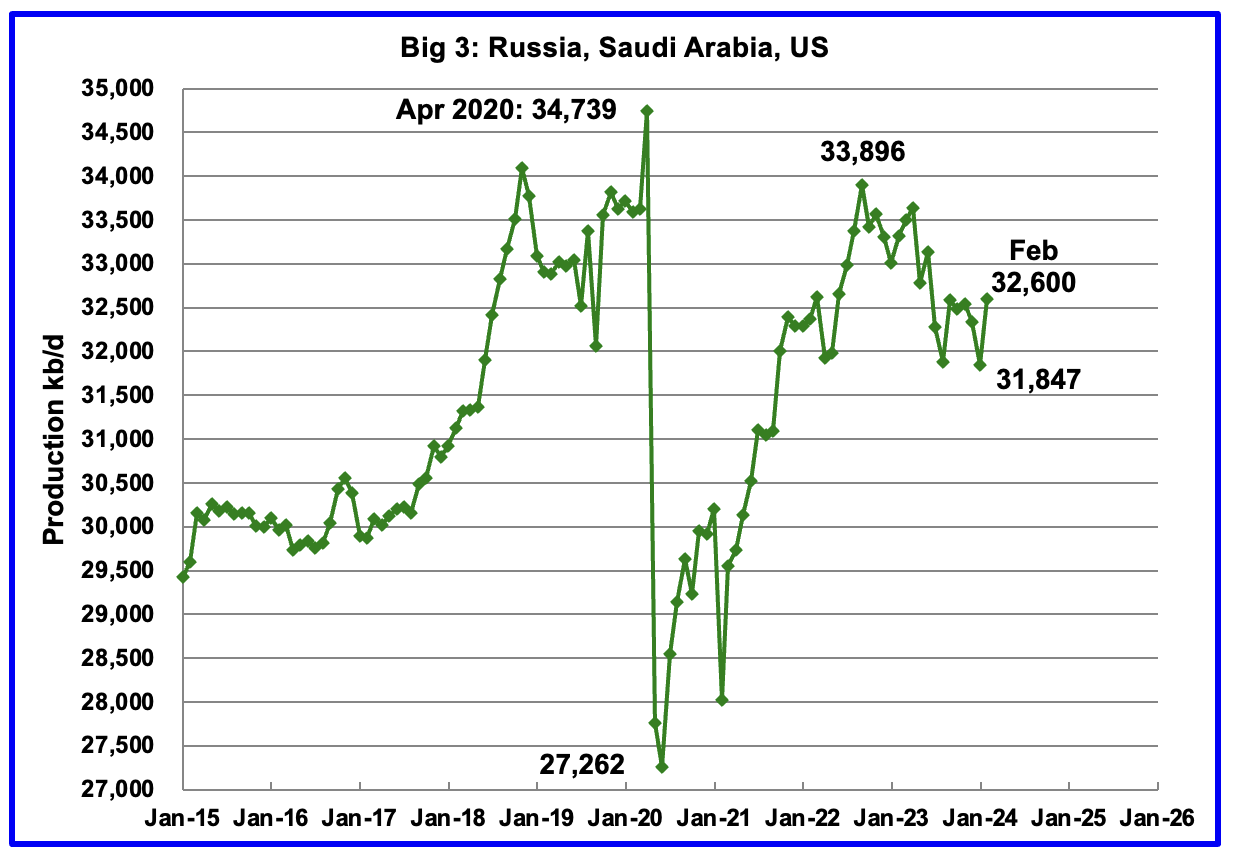
Peak production in the Big 3 occurred in April 2020 at a rate of 34,739 kb/d. The peak was associated with a large production increase from Saudi Arabia. Post covid, production peaked at 33,896 kb/d in September 2022. The production drop since then is primarily due to cutbacks in Russia and Saudi Arabia.
February’s Big 3 oil production increased by 753 kb/d to 32,600 kb/d. The main contributors to the increase were the US, 578 kb/d and Saudi Arabia, 250 kb/d. February’s production is 1,296 kb/d lower than the September2022 post pandemic high of 33,896 kb/d.
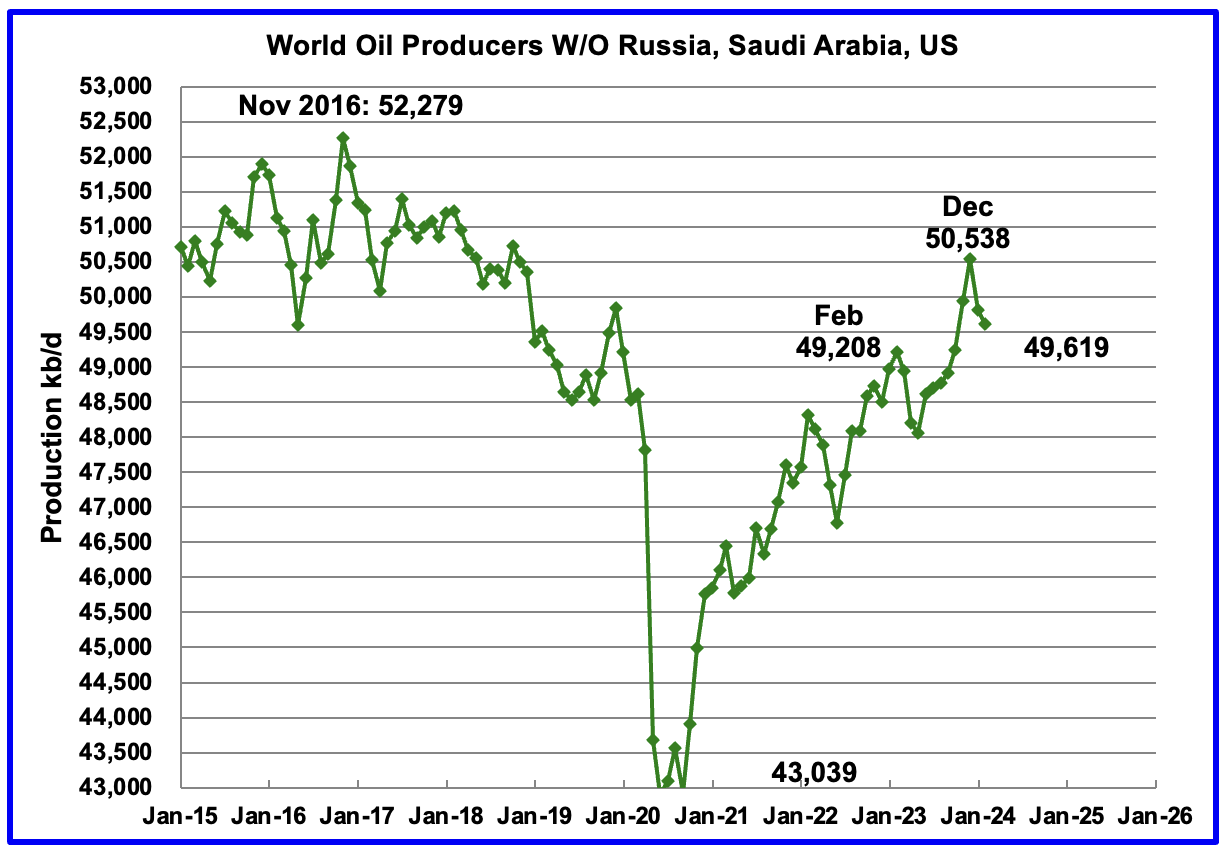
Production in the Rest had been slowly increasing since the low of September 2020 at 43,039 kb/d. Output in December 2023 reached 50,538 kb/d, a new post covid high. However January and February production reversed the increasing trend and production dropped by 919 kb/d over those two months to 49,619 kb/d.
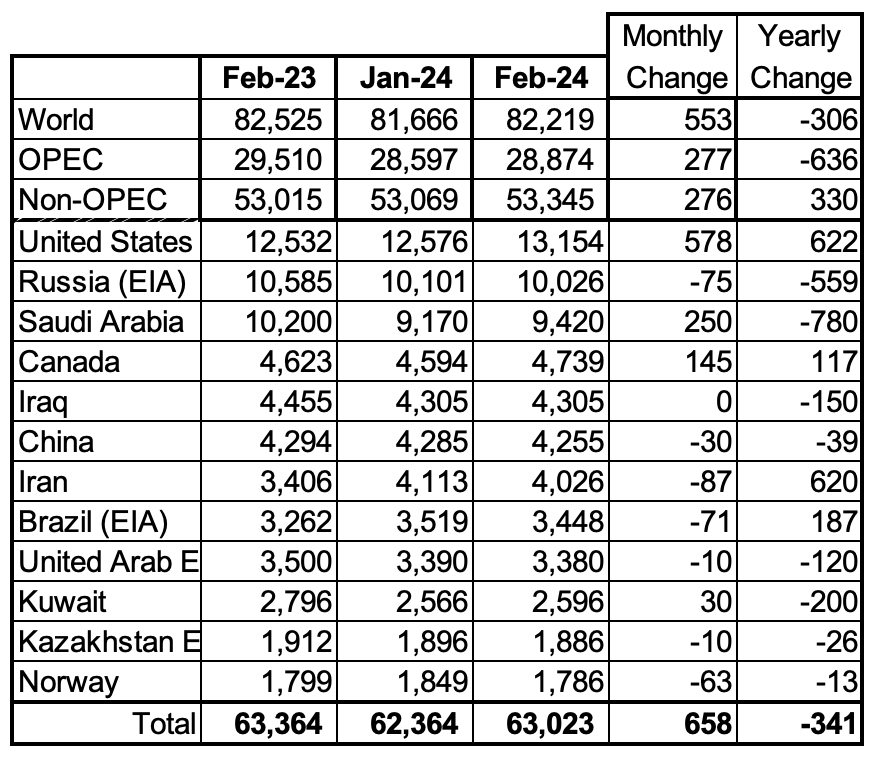
Above are listed the World’s 12th largest oil producing countries. In February 2024, these 12 countries produced 76.7% of the World’s oil. On a MoM basis, these 12 countries increased production by 658 kb/d while on a YOY basis, production dropped by 341 kb/d.
Note the large YoY increase in Iranian oil production vs the large Saudi Arabian drop. While the US and Iranian YoY increases are similar in size, the US increase is a rebound from a severe winter storm back to a more typical monthly output.
February Non-OPEC Oil Production
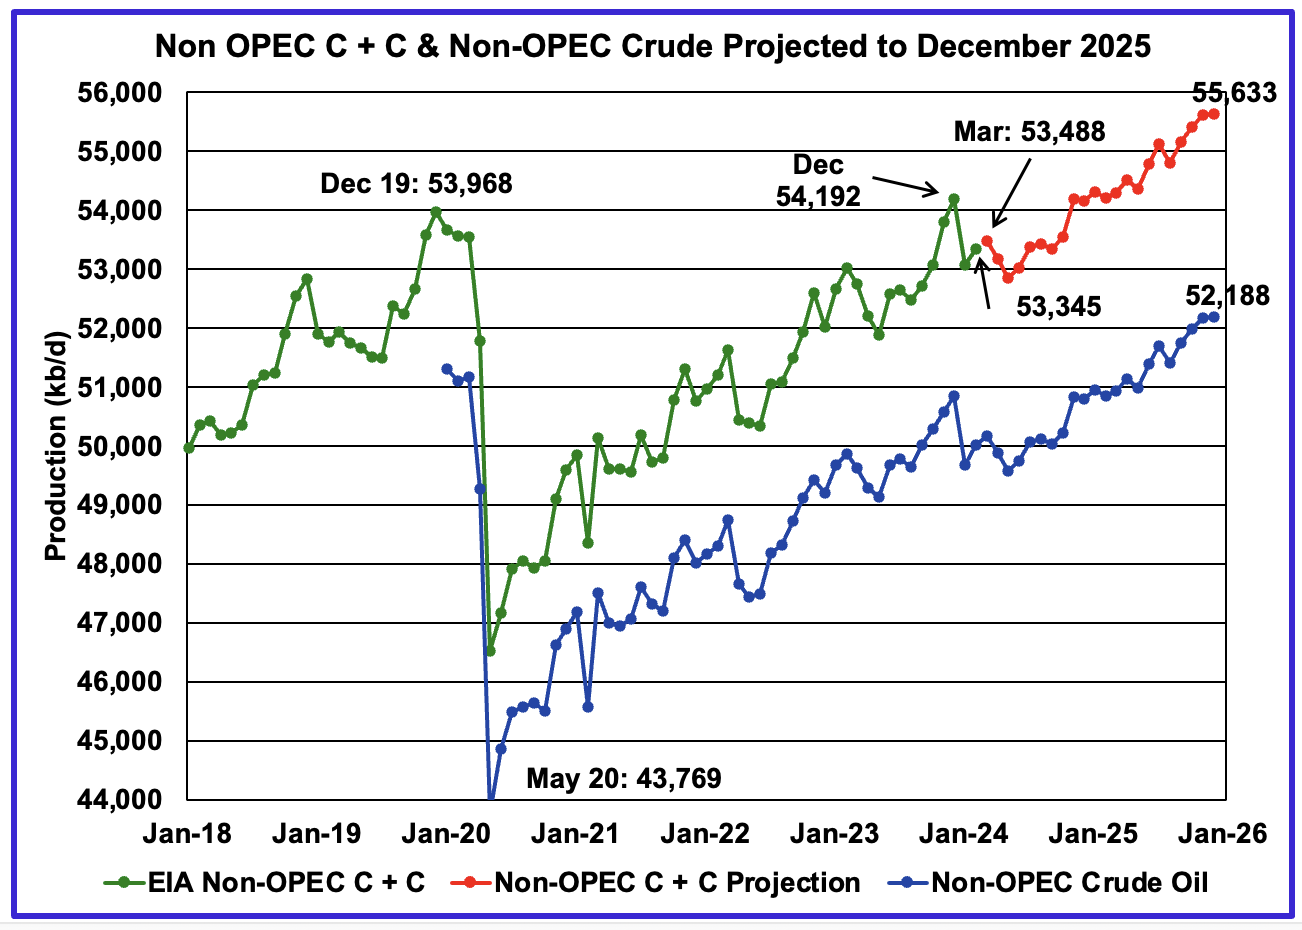
February Non-OPEC oil production increased by 276 kb/d to 53,345 kb/d. The largest increase came from the US. Note that Non-OPEC production now includes Angola.
Using data from the June 2023 STEO, a projection for Non-OPEC oil output was made for the period March 2023 to December 2025. (Red graph). Output is expected to reach 55,633 kb/d in December 2025, which is 1,665 kb/d higher than the December 2019 peak of 53,968 kb/d.
The same caution as noted for the World chart comments above apply to this chart.
From December 2023 to December 2025, oil production in Non-OPEC countries is expected to increase by 1,441 kb/d. According to the STEO, the major contributors to the increase are expected to be the US and Guyana.

February Non-OPEC W/O US production decreased by 276 kb/d to 40,240 kb/d. March’s production is projected to rise by 66 kb/d from February.
From December 2023 to December 2025, production in Non-OPEC countries W/O the US is expected to increase by 100 kb/d, essentially unchanged.
Over a longer time frame, Non-OPEC W/O US production has bumped up against a 41,000 kb/d barrier. In January 2016, production peaked at 41,170 kb/d. December 2025’s estimated production is 546 kb/d higher than January 2016. From December 2019 to December 2025, production is projected to increase by 550 kb/d or an average of 91.7 kb/d/yr, a very slow yearly increase for Non-OPEC W/O US oil producing countries.
Non-OPEC Oil Countries Ranked by Production
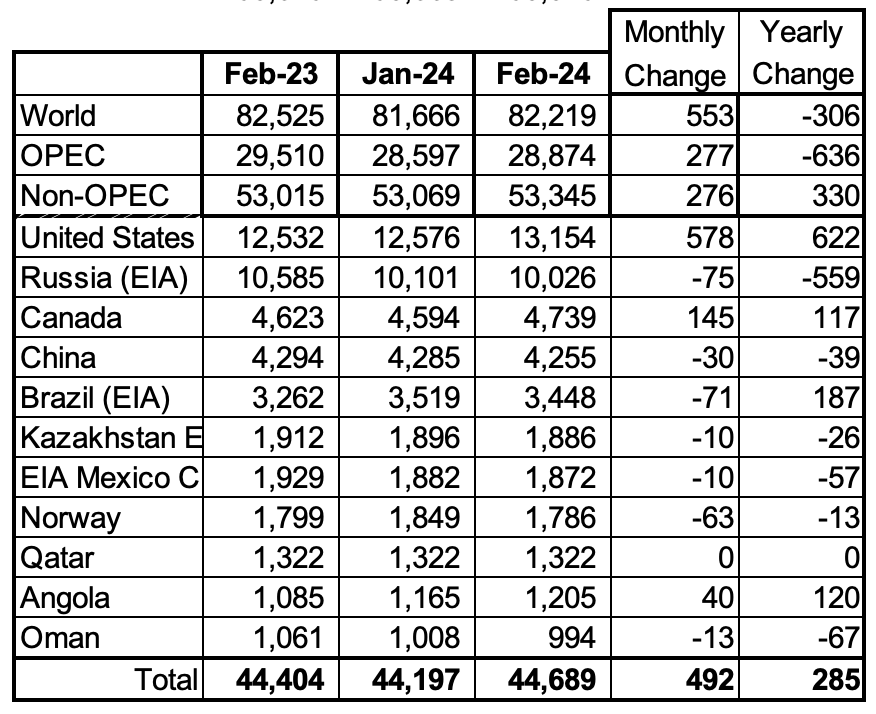
Listed above are the World’s 11 largest Non-OPEC producers. The criteria for inclusion in the table is that all of the countries produce more than 1,000 kb/d. Note that Angola has been added to this table since it left OPEC.
February’s production increase for these eleven Non-OPEC countries was 492 kb/d while as a whole the Non-OPEC countries saw a production increase of 285 kb/d.
In February 2023, these 11 countries produced 83.8% of all Non-OPEC oil production.
OPEC’s C + C production increased by 277 kb/d MoM while YoY it decreased by 636 kb/d. World MoM production increased by 553 kb/d while YoY output decreased by 306 kb/d.
Non-OPEC Country Oil Production Charts
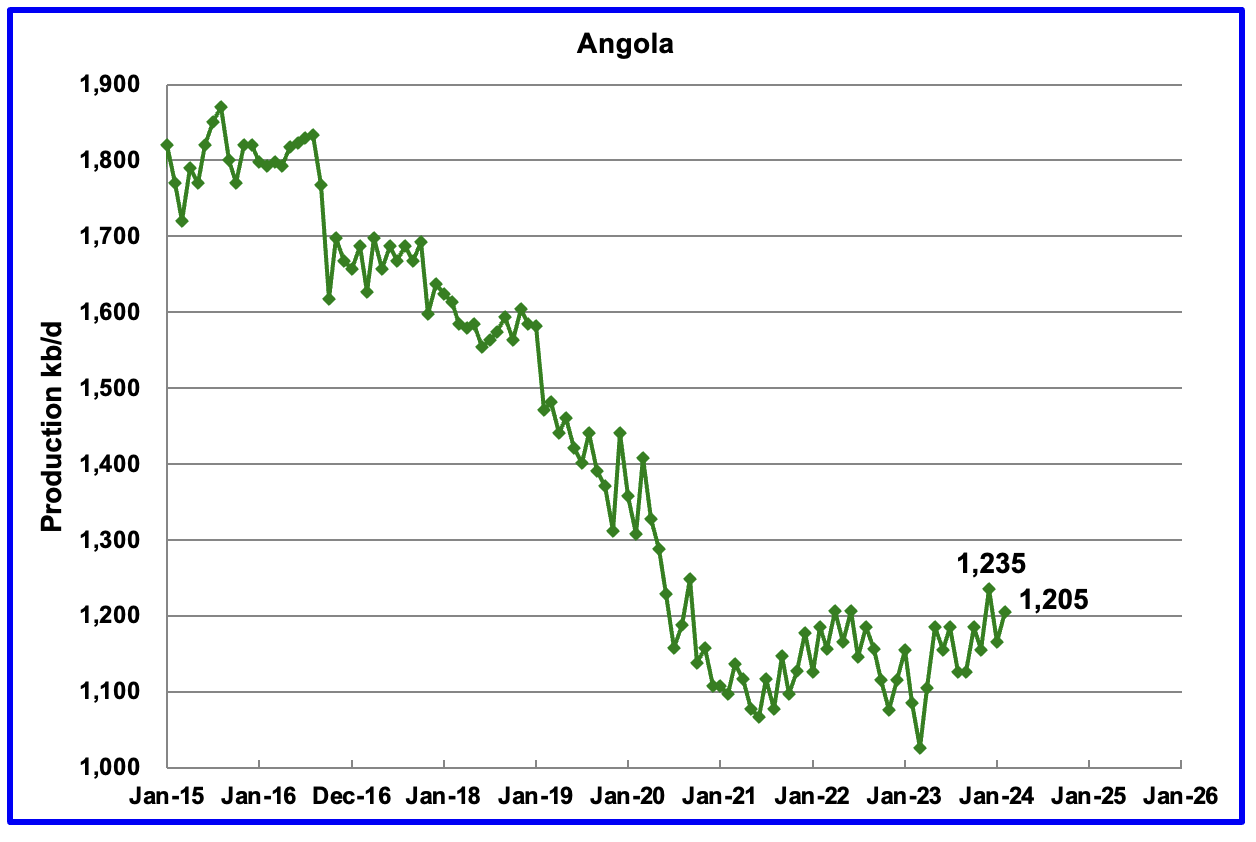
Angola has been added to the Non-OPEC producing countries since they have resigned from OPEC.
Angola’s February production increased by 40 kb/d to 1,205 kb/d. Angola’s production since early 2022 appears to have settled into a plateau phase.
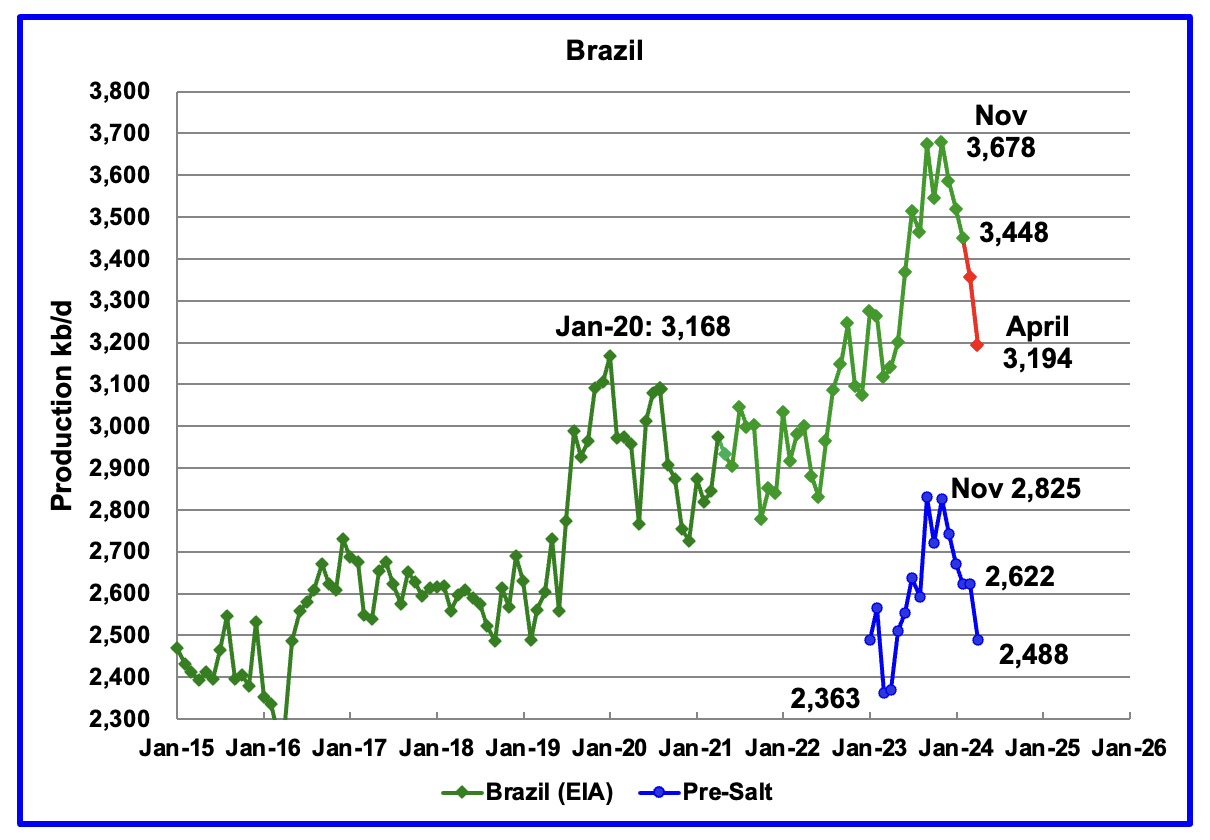
The EIA reported that Brazil’s February production decreased by 71 kb/d to 3,448 kb/d.
Brazil’s National Petroleum Association (BNPA) reported that output dropped in both March and April, red markers. April’s production dropped by 162 kb/d to 3,194 kb/d. It is also down by 484 kb/d from the November 2023 high.
Production from Brazil’s off-shore pre-salt region has been added to this chart. April’s pre-salt oil production dropped by 134 lb/d to 2,488 kb/d. The drop in the pre-salt region accounts for 83% of Brazil’s overall drop of 162 kb/d. The OPEC MOMR states that maintenance and natural decline affected production during March. Probably the same applies to April.
From March 2023 to November 2023, production increased by 563 kb/d. A similar rise in production is not expected in 2024. For 2024 the OPEC MOMR is expecting a smaller increase, closer to 120 kb/d while the EIA is forecasting essentially flat output.
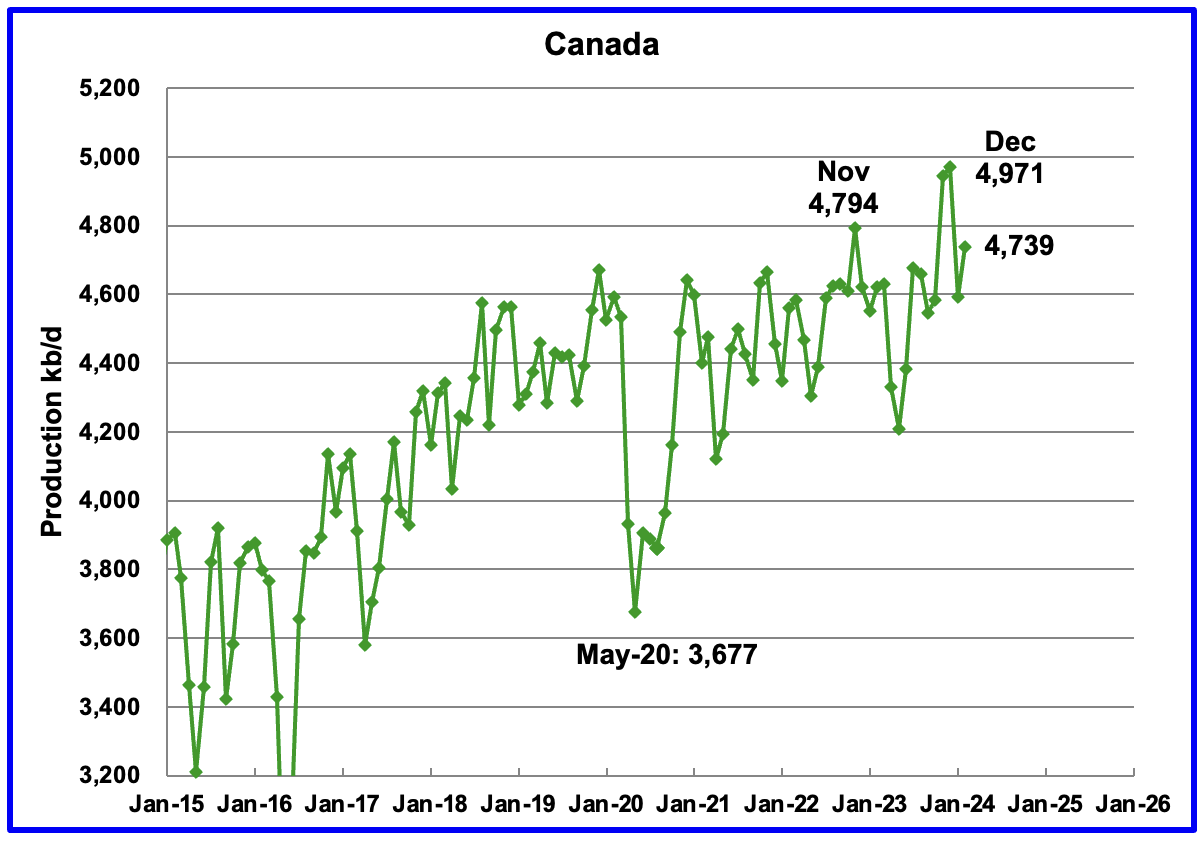
Canada’s production increased by 145 kb/d in February to 4,739 kb/d.
The TMX pipeline received final approval to operate on May 1, 2024. The line is currently operational and the first ships have left Vancouver.
“More oil coming from Canada will shake up markets for similar world oil streams including from Russia, Ecuador, and Iraq, according to analysts with Rystad Energy and Argus Media.”
Here are two sources for what is happening with TMX Line 2 and the type of oil it transports. Source 1 Source 2
Interestingly, there is Concern with the crude specification the Line 2 can carry. Chevron, Suncor and Canadian Natural Resources have written the Canadian government expressing their concerns. Chevron claims California’s vapour pressure limits will prevent it from bringing TMX Line 2 oil into California. One of the original preferred destinations for TMX oil was California.
“Chevron, a buyer of crude off the line, said in a letter filed with the Canada Energy Regulator Friday that the vapor pressure limit exceeds U.S. Environmental Protection Agency caps on storage tanks at California refineries. Chevron operates two refineries in the Golden State, and a failure to amend the pressure and acid limits may prevent it from purchasing or processing crude from Trans Mountain for those facilities.
Oilsands giant Suncor said in a regulatory filing that the high vapor pressure limit means companies will blend lower value hydrocarbons with the crude that is injected into Trans Mountain, reducing the value of the oil shipped on the line.”
What is not clear is whether the speculations for TMX Line 1 and TMX Line 2 are the same or different? If they are the same, why is this issue being raised now? If they are different, why are they different?
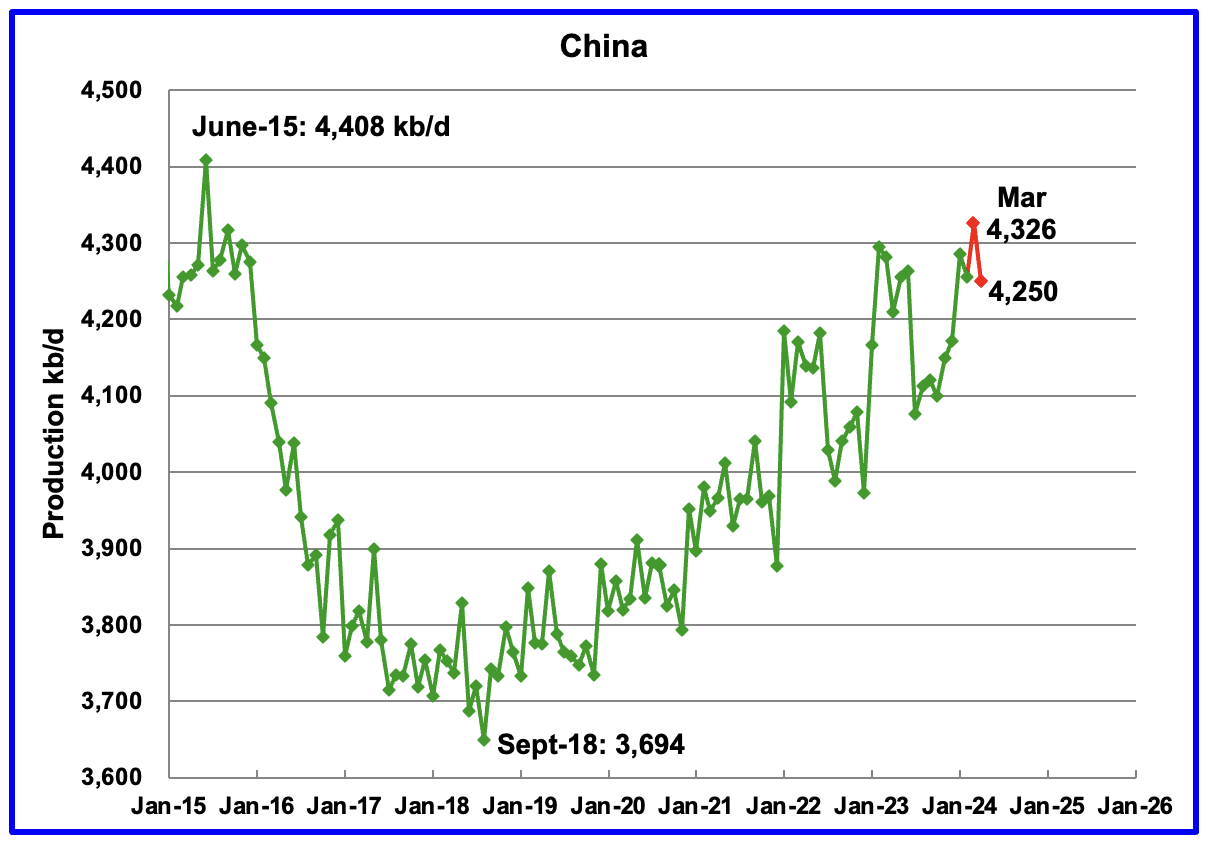
The EIA reported China’s oil output in February decreased by 30 kb/d to 4,255 kb/d.
The China National Bureau of Statistics reported production for March and April. March rose to a new high of 4,326 kb/d before dropping by 76 kb/d to 4,250 kb/d in April.
While China’s production growth has risen steadily since 2018, it may be approaching its post pandemic high since the YoY increase for 2024 was 32 kb/d vs the 102 kb/d increase in 2023. The OPEC MOMR states: “For 2024, China’s liquids production is expected to rise by about 15 tb/d, y-o-y”
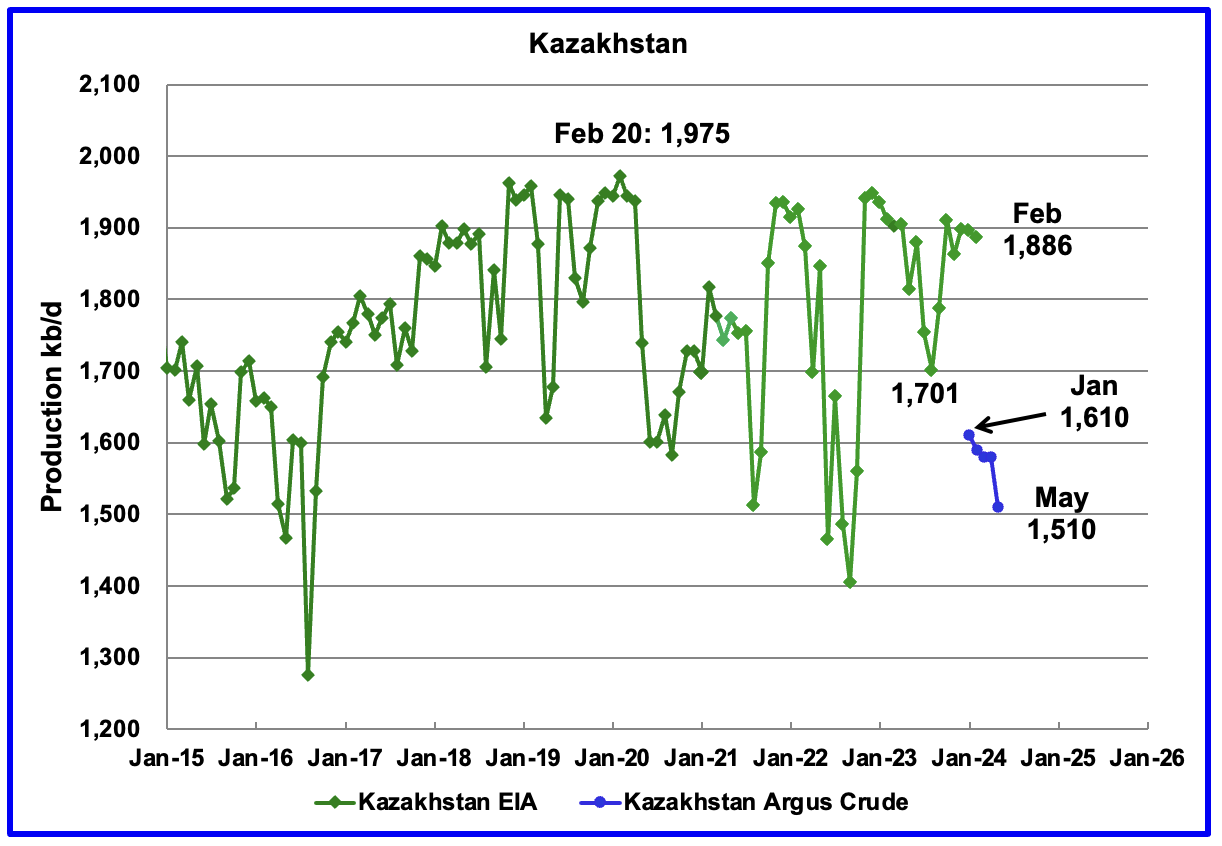
According to the EIA, Kazakhstan’s oil output decreased by 10 kb/d in February to 1,886 kb/d. Kazakhstan’s recent crude oil production, as reported by Argus, has been added to the chart. In May crude production dropped by 70 kb/d to 1,510 kb/d.
Kazakhstan and Iraq have been under pressure to reduce their production to comply with the OPEC + targets since oil inventories have not been falling as fast as expected. According to this source both countries will reduce their output.
“OPEC + said following an online meeting on Friday that Iraq exceeded its quota by pumping 602,000 barrels per day in total in the first three months of 2024, while Kazakhstan exceeded its quota by pumping 389,000 barrels per day.
On June 2, 2024, OPEC + announced its plan to Increase Production Starting in October 2024. In that plan, Kazakhstan is permitted to produce 1,468 kb/d starting in June 2024 to September 2024. May’s production exceeds the June target by 42 kb/d and is down by 100 kb/d from January.
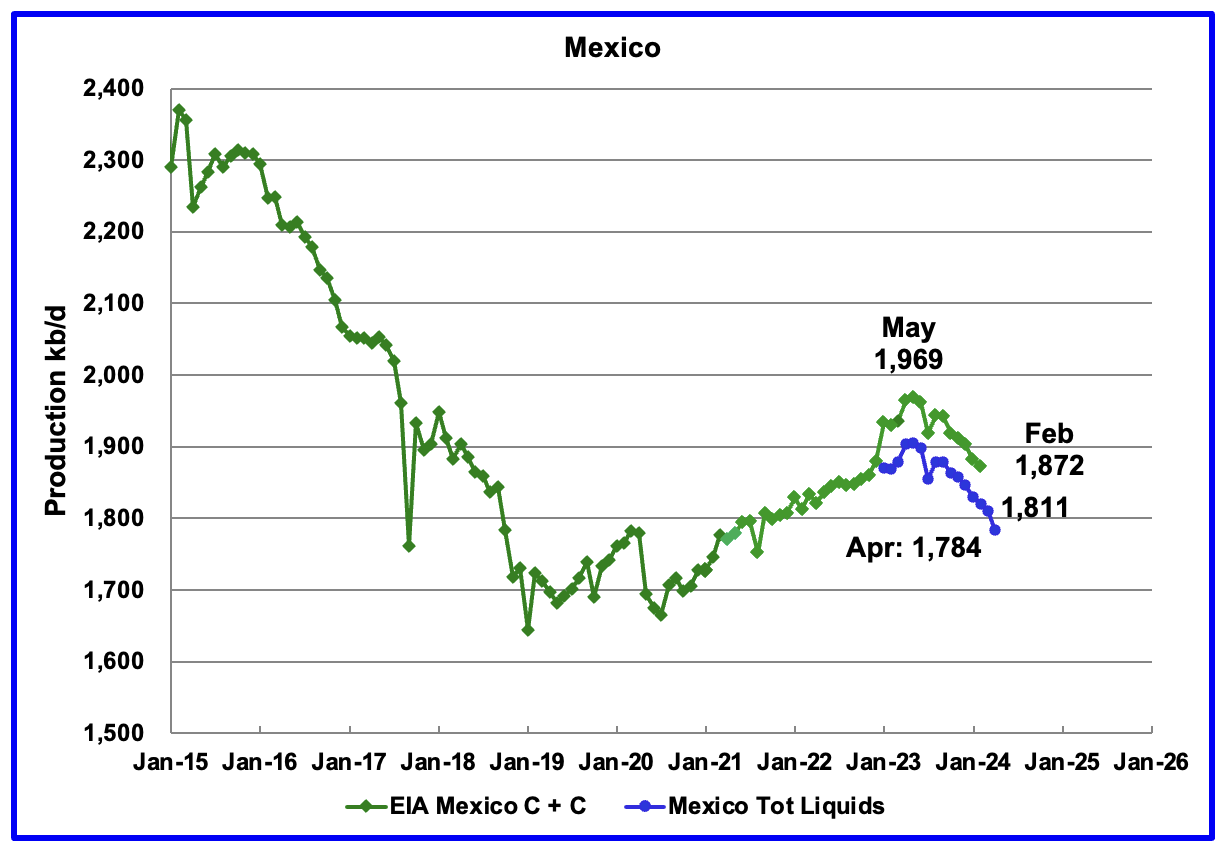
According to the EIA, Mexico’s output decreased by 10 kb/d in February to 1,872 kb/d.
For March, Pemex issued a new and modified oil production report for Heavy, Light and Extra Light oil. It is shown in blue in the chart and it appears that Mexico is not reporting condensate production when compared to the EIA report.
In earlier reports, the EIA would add close to 55 kb/d to the Pemex report. The gap between the EIA report and Pemex on average is 56 kb/d over the last 6 months.
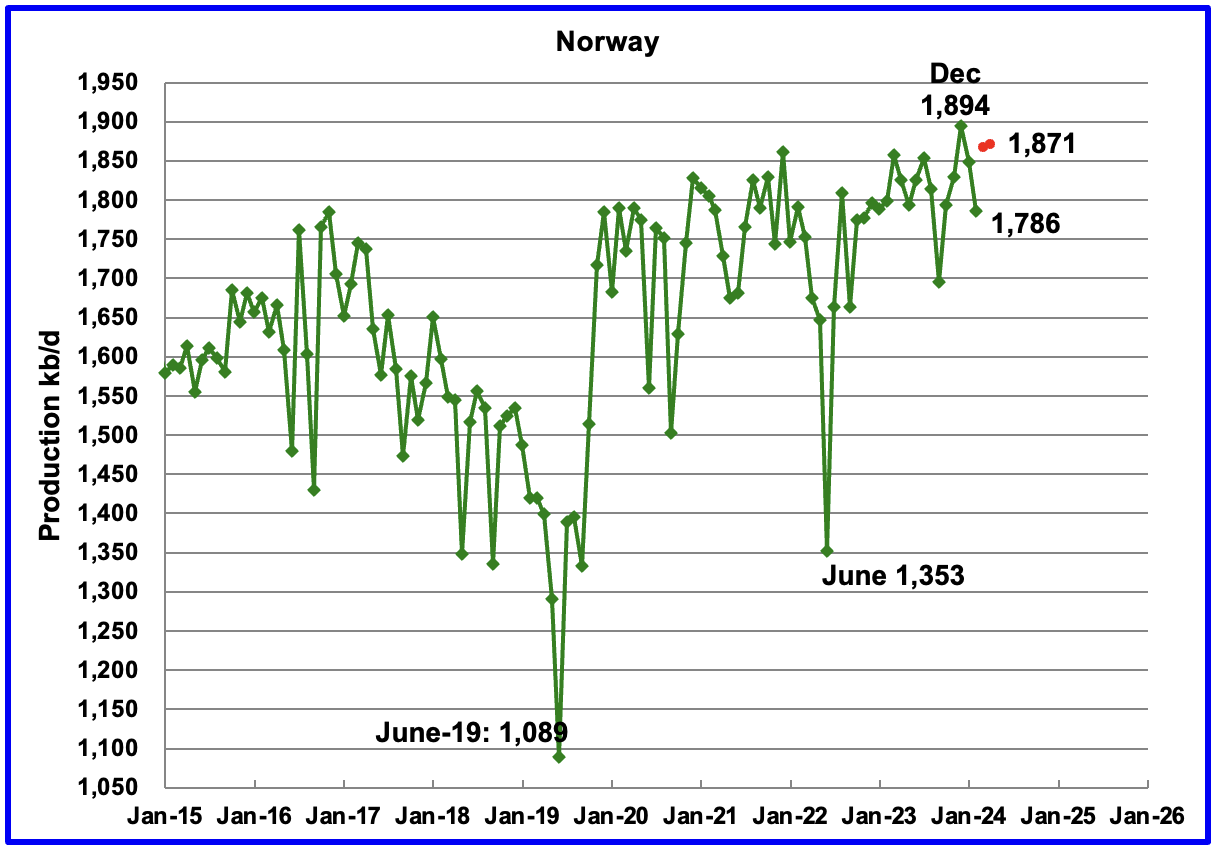
The EIA reported Norway’s February production decreased by 63 kb/d to 1,786 kb/d.
Separately, the Norway Petroleum Directorate (NPD) reported that March’s production increased by 81 kb/d to 1,867 kb/d, red markers. April added 4 kb/d to 1,871 kb/d.
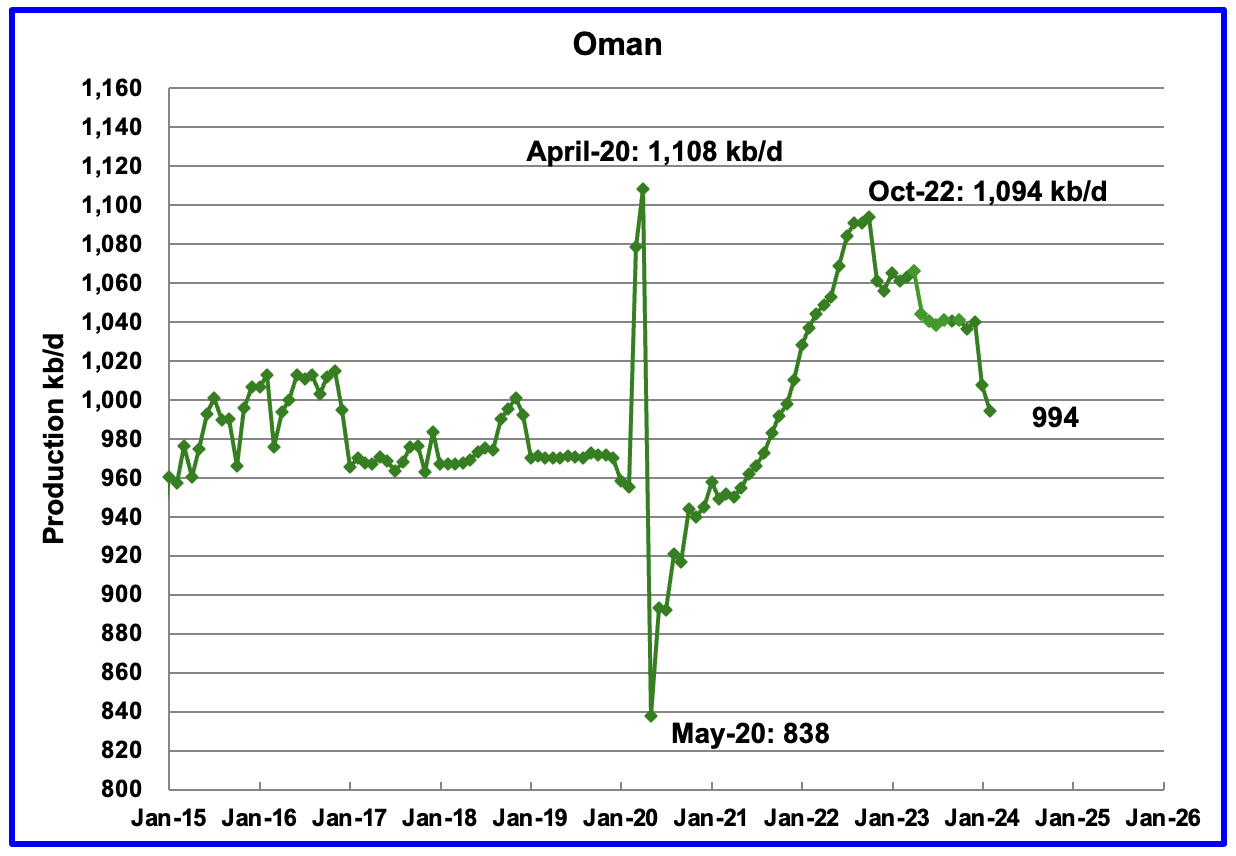
Oman’s production has risen very consistently since the low of May 2020. However production began to drop in November 2022. According to the EIA, February’s output was 994 kb/d, 100 kb/d lower than October 2022.
Oman produces a lot of condensate. The OPEC MOMR reports that crude production in February was 771 kb/d, 223 kb/d lower than the EIA’s C + C.
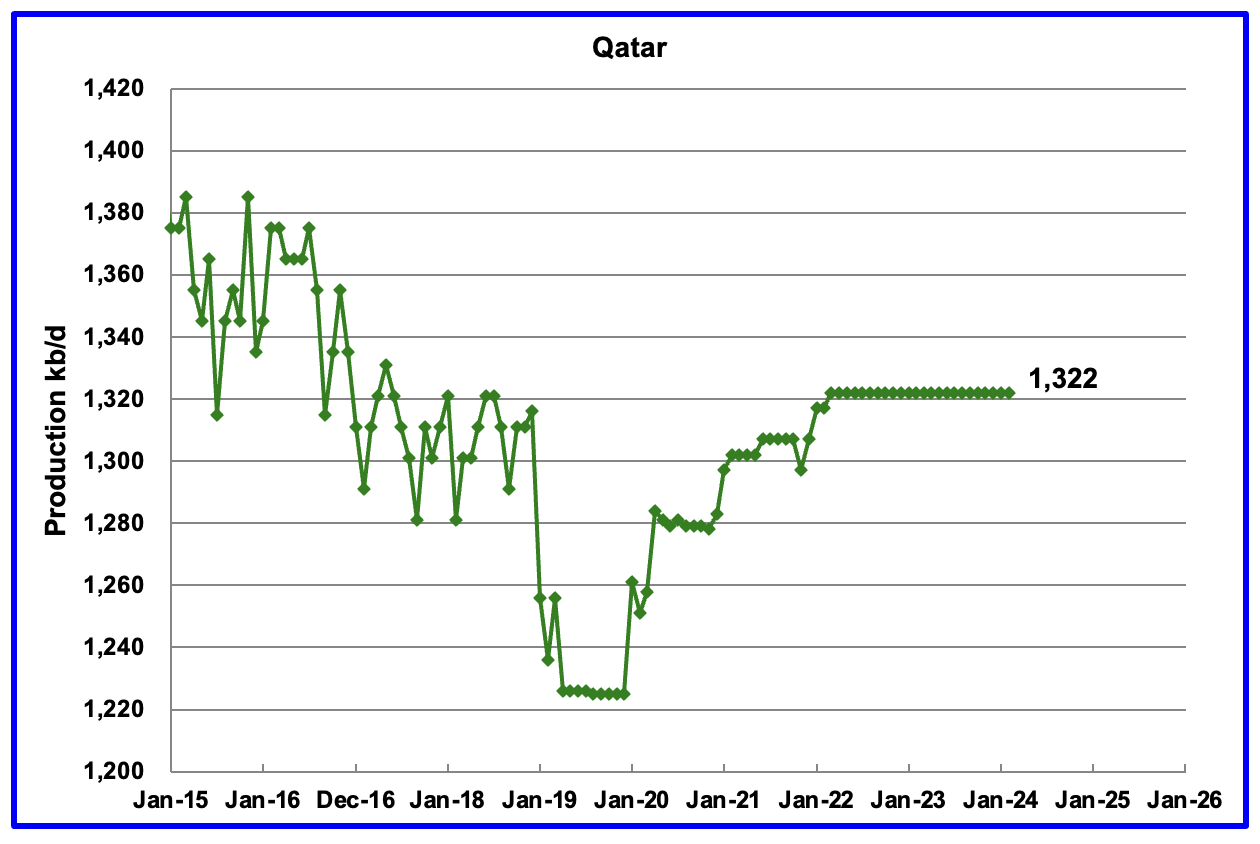
Qatar’s February’s output was unchanged at 1,322 kb/d, possibly due to lack of updated information.
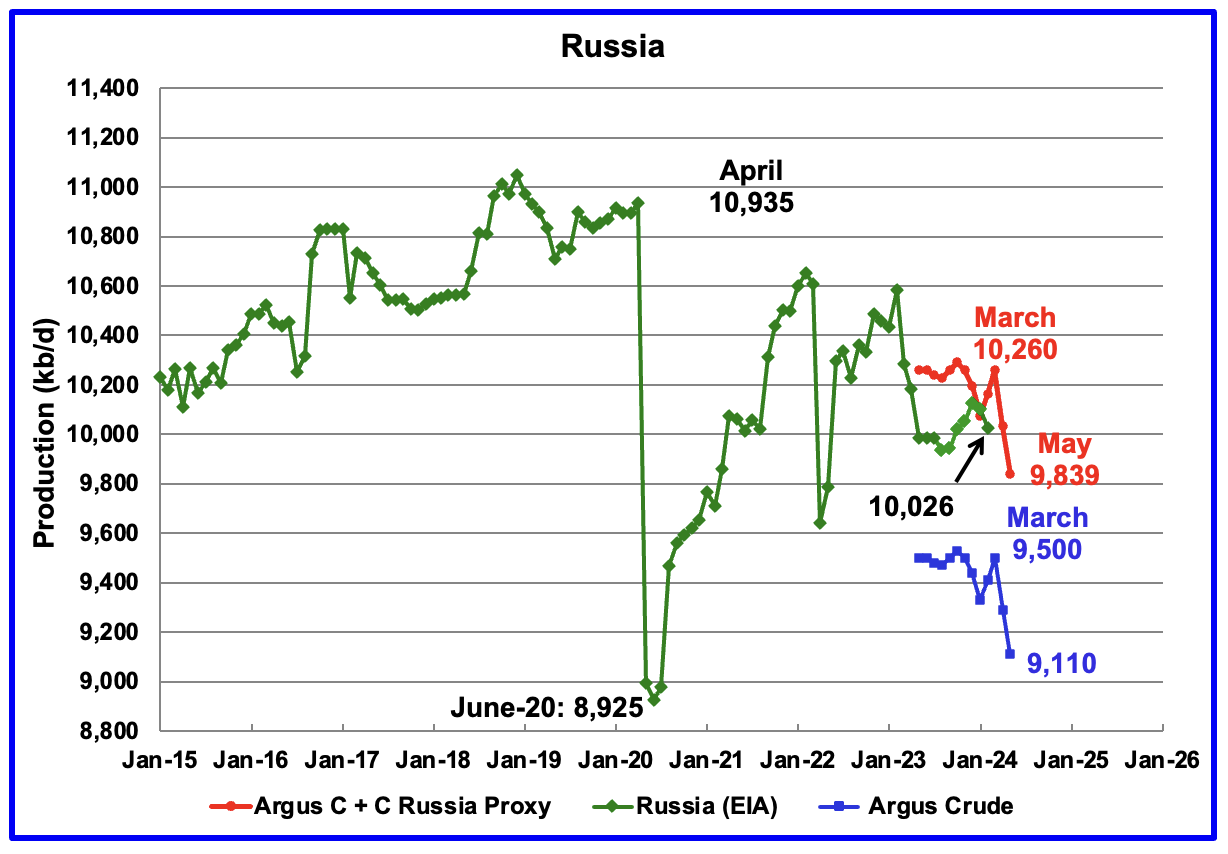
The EIA reported Russia’s February’s C + C production dropped by 75 kb/d to 10,026 kb/d.
Using data from Argus Media reports, Russian crude production is shown from May 2023 to May 2024. For May 2024, Argus reported Russian crude production was 9,110 kb/d, a decrease of 180 kb/d from April, blue markers. Adding 8% to Argus’ May crude production provides a C + C production estimate of 9,839 kb/d, which is a proxy for the Pre-War Russian Ministry estimate, red markers.
S & P Platts reports that Russian May crude production was 9,240 kb/d, down 50 kb/d from April. This is the first time there has been a greater than 100 kb/d crude estimate for a given month for Russia between Argus and S & P Platts.
February is the second recent month that the EIA has shown Russian production dropping.
According to this March 25th Article, Russia ordered companies to cut oil output to meet OPEC+ target.
“Russia’s government has ordered companies to reduce oil output in the second quarter to ensure they meet a production target of 9 million barrels per day (bpd) by the end of June in line with its pledges to OPEC+, three industry sources said on Monday.”
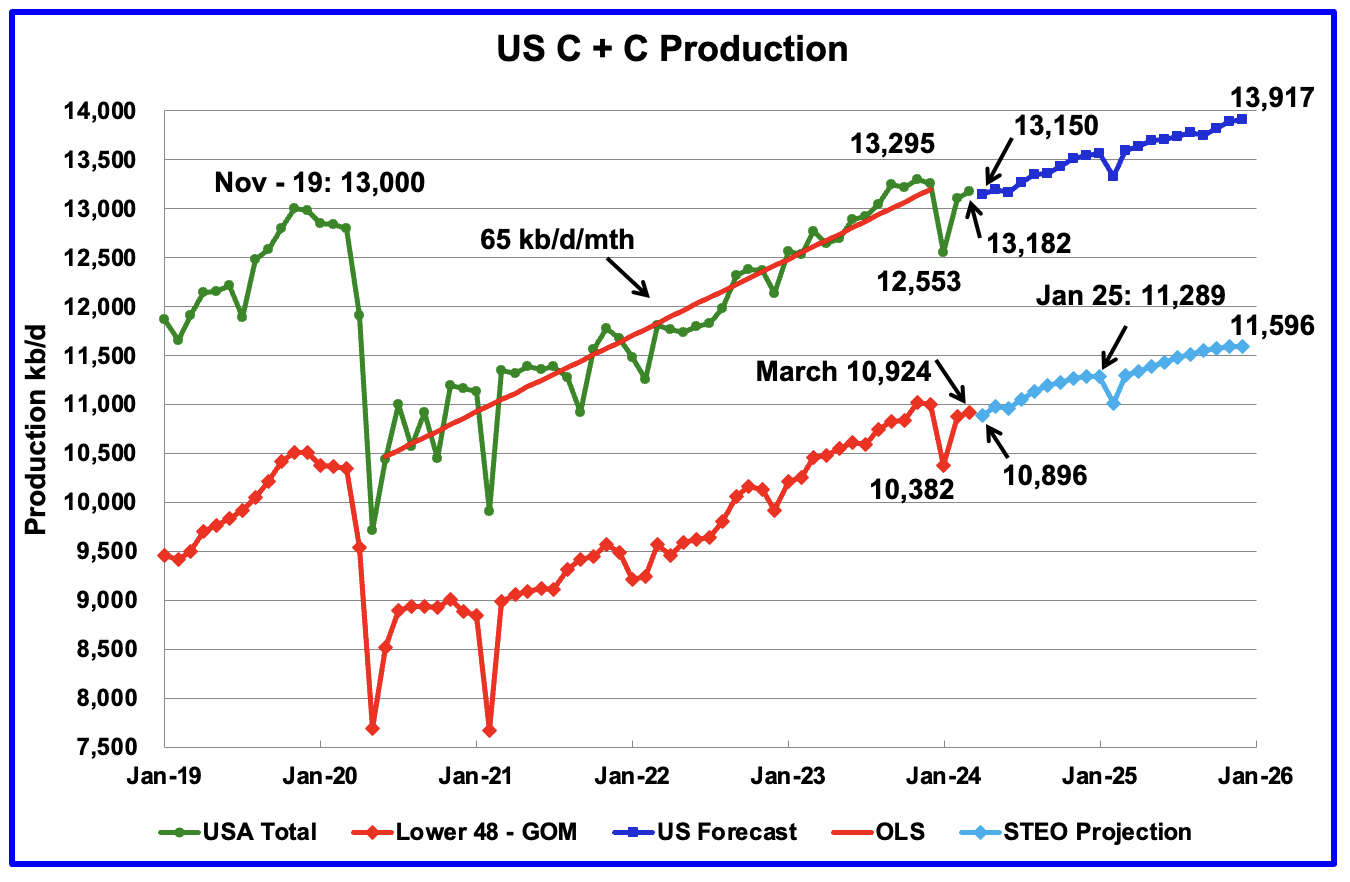
This chart is almost the same as posted in the US March update except that the light and dark blue graphs have been updated using the June STEO. The main difference is that output is now expected to be flat over the next 3 months till June.
It seems that each STEO update increases US production for December 2025, especially the Onshore L48. For the June update, the Onshore L48 increased December 2025 production by 47 kb/d to 11,596. Overall US production in December 2025 increased by 8 kb/d.
The last three months in the L48 – GOM graph continue to be essentially flat and may be hinting at a coming plateau.
136 responses to “February Non-OPEC and World Oil Production Rises”
According to the OPEC MOMR, OPEC+ crude-only is down 391,000 barrels per day between February 2024 and May 2024. If correct, OPEC+ C+C will likely be down more than 400,000 bpd by May from February’s numbers. I don’t think we will test the November 2018 high any time soon.
Ron
The first chart shows production dropping in April and May before it resumes increasing.
I think that one of the reasons the projection is showing a new C + C high is due to the continuing increase in US production that the STEO is projecting over the next two years. I think the US peaks within six months.
I think you are correct, ovi. As to the US peak, I think we have been on the peak plateau for some time now. Saudi has peaked, Russia has peaked, now that the USA has peaked, it’s all over.
The November 2018 peak is not a magic number. If we have a peak above that peak, it means nothing. We are currently on the proverbial peak plateau. That plateau will drop in a few months or a year or two. That makes no difference. We are at the peak right now. That is, we are on the peak plateau right now. End of story.
How the H-E-L-L are we still talking about a future peak????????
If remove the noise, this is US production:
Notice any trend(s)?
Kengeo
Your timeline is missing the slow rollover and the flat last six months
Ron,
The conventional view is that Arab Gulf, US, Canada, Guayana, Brazil will be the drivers. However, I share your skepticism.
A Chart using all of the data (rather than erasing some as Kengeo has done to “remove the noise”). I only make stuff up about the future rather than adjust the past to an alternate reality.
Data from link below and includes only data from Jan 1985 to March 2024
https://www.eia.gov/dnav/pet/hist/LeafHandler.ashx?n=PET&s=MCRFPUS2&f=M
Dennis – Ovi gets it, you may be a lost cause…
I thought you would have been able to grasp the significant transition (to lower energy) that’s been underway for more than 20 years…somehow you just keeping projecting production growth 5-10 years down the road…
Show me the reserve growth to match your future projections, oh that’s right – you can’t!
Kengeo,
Nope not forecasting a lot of growth, basically a plateau at around 82 Mb/d, for US I also expect output is likely flat or down. see comment linked below, for Permian scenario I have peak in Feb 2024.
https://peakoilbarrel.com/march-non-opec-and-world-oil-production-rises/#comment-776897
The chart I posted is not a forecast it is historical output for the US, without dropping “noise” (aka data) as you did in your chart without specifying the manipulation you had done.
Kengeo,
I currently agree with Ovi’s assessment that US output has either reached a plateau or will do so soon (within 6 months of June 2024). This is based on the assumption that oil prices (WTI) will remain at $80/b or less in 2023$ for the foreseeable future.
Hi Ron.
Russia is in their second and last peak. According to ARAMCO IPO information, back in 2018 (if I recall correctly) their costs were above 40$/barrel compared to 17$ for SA (whatever…) anyway, Saudi peaked at least 10 years ago. Since they manipulate, hide and obscure their real output by many means, we will never know exactly when. If you remember the price war they waged against american LTO, they reached a top output of 10.8 or 10.9 mbd and their internal consumption went up to over 4.1 mbd so, pumping flat-out to oversupply the market took them 500 kbd extra.
Several years later, still pushing their spare capacity and voluntary cuts BS like somewhere some moron will gladly believe that crap. Same goes for OPEC+ with just the Iraqui wildcard.
Cheers! and many thanks to Ovi and Dennis for their outstanding work.
Am I mistaken or does it seem to remind me of 2014?
A slightly different estimate of World C plus C based on EIA International data and June STEO, using the average crude to C plus C ratio for OPEC and World less OPEC and US for the March 2021 to February 2024 period. The centered 12 month average is the red dashed line, note how flat this 12 month average is between Jan 2023 and Sept 2024, the average World C plus C output over those 21 months is 81849 kb/d. My expectation is that World output continues at around 82000 kb/d from October 2024 to December 2025 rather than rising to 84469 kb/d in November 2025 as shown in this estimate.
The 12 month average output is 81852 kb/d in 2024 and 83648 kb/d in 2025, but I think the 2025 estimate will be too high by about 1650 kb/d.
In short, I think Mr. Patterson is correct.
Perhaps output has been flat from September 2022 to March 2024 because World demand for C plus C has not been increasing over that period and perhaps this continues in the future. The EIA tends to assume that past long term trends will continue in the future.
Dennis
I will take a look at the forecast and try a different variation. However here is why I think it is a reasonable forecast.
Assuming the EIA’s crude estimate is correct, crude production increases by 2,658 kb/d from February 2024 to December 2025. EIA world C + C for February 2024 is 82,219 kb/d. Adding just the February to December 2025 crude increment to the World C + C gives 84,877 kb/d in December 2025, which is higher than November 2018.
As I wrote to Ron above, one of the reasons the projection is showing a new C + C high is due to the continuing increase in US production that the STEO is projecting over the next two years. I think the US peaks within six months and that could prevent November 2018 from being exceeded.
What is your highest C + C estimate near the end of 2025. It appears to be close to 84,500 kb/d.
Ovi,
For my estimate, the monthly peak is November 2025 at 84469 kb/d, slightly less than the November 2018 monthly peak of 84589 kb/d, the 12 month average peak is 83490 kb/d, exceeding the previous 12 average month peak of about 82958 kb/d (Sept 2018 for centered 12 month average).
I agree US may peak soon, a recent tight oil scenario that assumes low oil prices (under $80/b in 2023 US$) in the future has the CTMA for US tight oil in April 2024 at 8843 kb/d, recent 12 month average in 2023 is roughly 8600 kb/d, the monthly peak for my scenario is 8900 kb/d in Feb 2024, note that I think the EIA estimates for tight oil are low by about 180 kb/d as they are missing output from some formations in the Permian Basin.
The reason the estimates are different is that I do not assume the ratio of crude to C plus C remains fixed at the February 2024 level. I use the average ratio from March 2021 to Feb 2024 as this ratio fluctuates seasonally.
Just a different way of estimating, it is impossible to know the future and any estimate (EIA, me or you) of the future will be wrong.
To me, roughly flat output for World C plus C at about 82 Mb/d from Jan 2023 through Dec 2025 seems a fairly reasonable guess.
What are we going to do if Dennis and Ron start agreeing with each other?!
https://www.youtube.com/watch?v=uXAsWdzLRyI
6 minutes
I thought Venezuela was coming back, but according to this Venezuela and oil industry are headed fo collapse.
Chevron is pulling out.
Lots of juicy info on the tar sands and difficulty producing them.
predicts Venezuela will be an oil importer in ONE YEAR!
That was a good point about their export numbers being inflated by imported dilutant.
I agree!
Does canada need to dilute their tar sands ( I am assuming yes )…..do they produce their own dillutant or import it?
NAPTHA
There are definitely light oil companies in Canada; that said, I think they also import from the US.
The northern part of the Bakken is in Canada. Canada has a number of fields that produce light oils and butane that can be use as diluents.
Attached is an oil article on the reversal of a diluent pipeline that brought diluent into Canada.
https://rbnenergy.com/every-time-i-turn-around-diluent-pipe-reversals-to-help-albertas-crude-takeaway
You know a guy is a technical specialist when he spells “diluents” as “dillutants”. (me)
I’ll tell my grandchildren I knew more about oil prodcution than the average couch potato!!!
Note in the video,
The Russians and Chinese were giving loans to Venezuala for future claims on their oil.
Do you think Putin and China aren’t peak oil aware?
Andre
Yes. The crude shipped on TMX Line 2 has a high vapour pressure because of the higher levels of diluent used to reduce its viscosity.
https://boereport.com/2024/06/12/crude-quality-issues-on-tmx-pipe-may-hamper-flows-from-canada-to-us-west-coast-refiners/
“Vapor pressure limits, which measure the volatility of crude, are “wholly inappropriate” for West Coast refining markets, Valero wrote to the CER last month. It and other West Coast refiners are expected to be top buyers of TMX barrels.
Chevron separately told the CER the vapor pressure limit exceeds the regulatory limit set for storage tanks at both its California refineries. High pressures cause more vapors to leak from tanks into the atmosphere.
The higher vapor limit also means more lower-value light oil could be blended into Trans Mountain crude, reducing its value, wrote oil producer Canadian Natural, a major shipper on the pipeline.”
The IEA is predicting an oil glut by 2030.
https://www.iea.org/news/slowing-demand-growth-and-surging-supply-put-global-oil-markets-on-course-for-major-surplus-this-decade
a surge in global oil production capacity, led by the United States and other producers in the Americas, is expected to outstrip demand growth between now and 2030.
Yep, saw this today and came here. Is it a realisitic prediction?
https://www.ft.com/content/cfb97534-b71b-490f-b626-6dc3487f595d
“IEA predicts more than 8mn b/d of excess capacity by 2030 as producers invest in pumping more crude”
Glut of 8mn b/d sounds like a lot?
Sean,
Over supply is possible if demand wanes due to transition to electric transport, there may be excess capacity, but note that today the IEA claims there is excess capacity of 5 Mb/d (a more realistic estimate at present is perhaps 2.5 to 2.8 Mb/d of extra capacity) perhaps this increases to 5 Mb/d in the future, but I think capacity will decline in some places if excess supply leads to lower oil prices, tight oil, deep water off shore, arctic oil will all see less investment and decreasing capacity due to depletion in a low demand scenario. I don’t see a lot of increase in US output capacity going forward unless we see oil prices spike because the transition to electric transport does not occur or happens very slowly.
Sean,
Correction, the IEA has World spare capacity at close to 6 Mb/d in 2023, much of this spare capacity is in OPEC where they tend to overstate their sustainable output capacity. I base real capacity on the highest average 12 month average output attained in the past 3 years, and for OPEC that number is far lower than what they claim.
Alimbiquated,
The report is interesting, a note of caution to all, in the past the IEA has underestimated the speed that EVs, wind, and solar would ramp up. They tend to take past results and project foward linearly rather than exponentially and they do this consistently (the US EIA makes the same mistake). If anything the future demand for oil is likely to be lower than these IEA estimates rather than higher.
Wind and solar account for less than 2% of primary energy, combined. Not much of a ramp, more like a rounding error.
Ivanislav,
Primary energy is less important than useful energy. About 60% of primary energy that is used in the production of electricity by fossil fuel and about 70% of the primary energy used for transportation is simply waste heat. About 39% of all electricity gross generation comes from non-fossil fuel (11488 TWh of 29165 TWh).
In the decade from 2012 to 2022 World electricity generation increased by 6333 TWh and of this increase 4169 TWh was from non-fossil fuel (66%) and 2795 TWh of the increase was from wind and solar alone (44%). The absolute number is currently small for wind and solar (12% of total gross electricity generation.)
What the fossil fuel industry fails to see is that exponential growth of wind and solar replaces fossil fuel quickly. Scenario below assumes the growth rates of past decade continue for World Electricity generation and wind and solar generation.
Ivanislav —
getting back to the topic of disruption: Disruption is when a new product changes the dynamics of the market.
For example, word processing was inferior to electric typewriters when it was introduced (think dot matrix printers). But word processing allowed companies to get by without typists because it was so easy to correct errors and copy and paste content. Then email killed the business letter completely. Secretary was the most common occupation in America in the seventies, but it has mostly disappeared.
Typewriter salesmen talked in vain about the strengths of their product and the weaknesses of word processing, because word processing changed the rules of the game completely, allowing companies to eliminate a whole class of employees.
Something similar is happening in electricity generation. All the glories of coal fired power plants and weaknesses of renewables don’t change the fact that renewables don’t need fuel. Selling and buying fuel has always been the central economic consideration of electricity generation.
So the coal miners and the gas drillers are facing the same fate as secretaries did a few decades ago — their jobs are simply disappearing because the rules of the electricity market have changed. Arguments about the reliability of coal are about as effective as arguments about the output quality of the IBM Selectric typewriter. Claims that renewables don’t really matter are just wishful thinking.
Also I recommend you avoid the primary energy fallacy. The current system is insanely wasteful.
Alim, I get your disruption discussion direction, but your examples are way too extreme in my opinion.
“All the glories of coal fired power plants and weaknesses of renewables don’t change the fact that renewables don’t need fuel.”
-Respectfully, solar and wind require sunlight and airflow as fuel, and they are intermittent.
“Then email killed the business letter completely. ”
-Maybe for quick business communication, but other mail increased. I get more physical “slick paper” solicitation mail than I have ever before. Real estate agents, gutter cleaners, window cleaners… I bet 20 per week is normal. I need to review the USPS volume numbers to verify, but I do not think email changed a material amount of physical mail volume… but I could eat crow here.
So, my point is that disruption for electricity generation may not be like the cell phone disrupting the landline. It may be more like the OLED flatscreen disrupting the old CRT TV. We are still watching video on a screen, just a better picture. Electricity will be generated by whatever means necessary to produce the picture of life. Wind, Solar, Nat Gas, Coal, Nukes are the team. This will persist for generations in my opinion.
Gungalonga,
Horses are used for transportation still, but the point is that these disruptions make the old form of service used obsolete mostly due to lower cost, yes sun and wind are intermittent, but the use of batteries, hydro and pumped hydro will make a system using these forms of power less expensive than a system using coal and natural gas especially when the costs of climate change are included, take a look at coal production in the US, the World chart will soon look similar and natural gas will follow.
Chart from
https://www.eia.gov/coal/data/browser/#/topic/33?agg=0,2,1&rank=g&geo=vvvvvvvvvvvvo&mntp=g&linechart=COAL.PRODUCTION.TOT-US-TOT.A&columnchart=COAL.PRODUCTION.TOT-US-TOT.A&map=COAL.PRODUCTION.TOT-US-TOT.A&freq=A&start=2001&end=2022&ctype=linechart<ype=pin&rtype=s&maptype=0&rse=0&pin=
Dennis, how does that aggregate coal production jive with the global coal consumption numbers that shows a high plateau above 150 eJ since 2010, without decline?
Hickory,
That chart is US coal, the World will start to decline in coal output soon as wind and solar continue to expand Worldwide.
About coal power plant usage… (Just have a think -channel)
https://youtu.be/DSQ0i4b-5ug?si=lQ9enKBtdMCXf22-
Hickory,
OECD coal consumption has been falling while non-OECD has been rising (mostly China and India) China may level off soon and India is likely to follow.
It looks to me like the global coal burn is on a long plateau.
Won’t be all that much lower by 2040, maybe 10%…
15% if we are lucky.
Hickory,
For OECD coal consumption decreased about 40% over 15 years (2007 to 2022). I would argue that the non-OECD decline will begin soon, led by China who is aggressively building out wind power and solar power, the huge Chinese manufacturing capacity may supply cheap exports for the rest of the non-OECD and drive coal power out of business.
If the OECD continues its linear decrease in coal consumption (20 EJ less in the past 15) then OECD coal consumption might be about 8.5 EJ in 2027 and if non-OECD output falls by 40% over the next 15 years (as OECD coal consumption did over the previous 15 years) then World coal consumption would be about 89 EJ in 2037, about 45% less than in 2022.
From 2016 to 2022 solar power output grew at an annual rate of 28% in China and for Wind power output annual growth was about 19% from 2016 to 2022. For China, wind and solar power output combined grew by 883 TWh form 2016 to 2022 while coal power output grew by 1241 TWh, in 2022 Chinese coal power output grew by 69 TWh while wind and solar combined grew by 208 TWh, the 2023 numbers will be out soon.
When looking at the chart below imagine it was 2007, you might have predicted continued growth in OECD coal use in the future, my claim is that the non-OECD may be near the tipping point in 2022 that the OECD was at in 2007, but you could be right, we will know more as the data comes in over the next few years.
Well yes it will indeed be interesting to watch.
Electricity overall demand will be growing, even as liquid fuel begins to decline.
Hickory,
World electricity use has not been growing very fast (2.4% per year on average from 2012 to 2022), but things could change especially as wind and solar drive electricity costs lower and might lead to more use of electricity. Lower population growth rates in the future will tend to attenuate the rate of growth of energy use.
Electricity demand growing-
big data/ai, electric transport, air conditioning, the approach to 9 billion….
I’ve not yet looked through this report, but it looks worthy of consideration. They project doubling of global electricity demand by 2050
DNV- Electricity, renewables generation,
and grids through to 2050
https://brandcentral.dnv.com/original/gallery/10651/files/original/f5149884-79ab-4a3e-99f2-10e59e36db79.pdf
Hickory,
I assume 2.4% per year growth in electricity demand from 2022 to 2050, that results in demand that is close to double in 2050 (194% of 2022 demand). By 2035 wind and solar might be providing all of it and could easily continue to grow at up to 7% per year if needed beyond 2035 (if the demand for electricity accelerates due to low cost).
OPEC Slams IEA for “Dangerous” Forecast of Peak Oil Demand by 2030
https://oilprice.com/Latest-Energy-News/World-News/OPEC-Slams-IEA-for-Dangerous-Forecast-of-Peak-Oil-Demand-by-2030.html
2030…hmmm.
I would have guessed closer to 2034,
A guess is a little different than a forecast.
Dennis/Ron
Attached is a chart which shows where crude growth will occur from Feb 2024 to December 2025.
OPEC: 641 kb/d
US: 812 kb/d
Non W/O US: 1,205 kb/d
Total. 2,658 kb/d
Clearly if the US component isn’t there, Novemeber 2018 is safe.
Is that 2,658 k/bd figure after all declines have been offset or before? Because the world has to replace at least 5,000 k/bd at the minimum just to stay flat, although I believe it’s higher than that.
Oilstud
The STEO may contain bit of decline. Must account for rapid decline in LTO basins.
Is your 5,000 kb/d/yr gross or net. I believe the net decline is somewhere between 250 kb/d/yr and 750 kb/d/yr.
For Ghawar, the gross annual decline rate is 8%. After allowing for infill drilling, the net is 2%.
Ovi,
I have never heard about net vs gross decline.
Do you define “gross” as decline from producing wells and “net” as decline from producing fields?
It’s an interesting distinction, but very difficult to define and measure.
E.g. how would a secondary flood fit the definition? (or a SAGD stimulation or a refrac?)
What about a dormant stripper that is put back online?
Kdimitrov
I am using those two words to distinguish decline in existing wells and production growth from new wells being drilled.
So I define “gross decline” as the drop in production in all of the producing wells at lets say from the beginning of the month to the end. Check production from new wells at the end of the month. “Net decline” is the difference in production between the beginning of the month and the end which includes new well production.
Attached is a clip from a Permian spreadsheet. The DPR calls gross decline “Legacy decline”. The last column is the difference between Legacy decline and new well production.
In the next picture is the comment regarding decline in Ghawar. They use the phrase “Maintain potential” drilling to drop the net decline rate to 2% from the 8% gross.
So legacy decline is roughly 7% per month, which must be offset monthly by new wells producing some 425 thousand b/d each month in the permian. That is to say that 50% of production must be replaced every 12 months, or 3 million b/d for the permian alone. Just how long can this treadmill continue? I guess OPEC must look at this with wonder and bewilderment. And all for an ultimate recovery of less than 10% of the original oil in place. And now that we are hitting or approaching the bubble point across the entire basin, what is your prognosis Dennis? How fast will the decline be once it all tips over? With falling rig counts are we there now?
C185 pilot,
When I have looked at the EIA drilling producivity report in the past, they haven’t been very good in their modelling, perhaps it has improved over time, but I would take it with a grain of salt.
The scenario below assumes the rig count decreases after May 2024 and DUC inventory is unchanged from current level in the future. I also assume there is a 7 month delay between the start of drilling and start of production of the well on average, so basically rig count in May determines the number of new wells that start producing 7 months later in December 2024.
For this scenario I assume rig count decreases by 1 per month starting in Jan 2025 in the Permian basin up to end of 2032 and also that oil prices under $80/b limits total horizontal oil wells drilled in the permian basin to 93 thousand wells so that faster rig decline occurs after 2032 due to limited drilling locations. Note that through April 2024 about 48.5 thousand horizontal tight oil wells have been completed in the Permian basin (so about 44.5 thousand potential new wells left to drill in this scenario). URR is 35 Gb with 12.9 Gb produced so far and if no wells were completed after April 2024 the URR of existing wells (as of April 30, 2024) would be 19.1 Gb.
Alternatively if we assume that all wells that have started drilling as of May 31, 2024 are eventually completed and start producing, but that no new wells are spud after May 31, 2024 and rigs gradually are reduced to zero as drilling is completed on wells already spud, then we have 52 thousand total wells competed by Dec 31, 2024 with cumulative production on that date of 14.2 Gb and final URR of 20.6 Gb.
As in every case, we cannot predict what will happen in the future, we can only guess.
If we assume no wells are completed after December 2024, we get the following Permian scenario, it is highly unlikely that Permian output will be this low in my view, the previous scenario is far more realistic (though it may also be too low).
Ghawar comment
What is the source of this slide?
For Ghawar, the gross annual decline rate is 8%. After allowing for infill drilling, the net is 2%.
Ovi, I know you realize that infill drilling does not create more oil in the ground. All it does is allow you to pull the limited oil that is there out of the ground at a much faster rate. So, if you have a natural decline rate of 8% but manage to pull it out much faster, giving you only a 2% decline, what does that imply?
I really get tired of repeating this obvious point over and over again over these past four or five years, so I will say no more. I think you get it, Ovi, or at least I hope you do. But this obviously points to a catastrophic collapse in production soon down the road. But I will say no more. Those who cannot comprehend the blatantly obvious now… never will.
Well expressed Ron.
Sum of Gaussians concept by John Peach expresses this mathematically.
Our cleverness is not wisdom.
I don’t know what you mean by those two terms, I was just stating that the general consensus is that the world has to replace at least 5,000 k/bd barrels a year regardless of the fields, that would be the average decline rate. The US decline rate is around 45%, which is close 6000 k/bd based on current production figures, so the global decline rate could be higher than that.
Oilstud
Let’s set aside the US since it is a unique situation. When you say general consensus, I am not sure what that means. On this board, no one has ever posted a reference to any article that says that the yearly decline rate is close to 5,000 kb/d.
When you say replace 5,000 kb/d each year, that sounds like a gross number. If you could provide some reference that states that number, it would appreciated.
According to these reports electric vehicle sale will easily exceed 50% of all sales by 2030.
https://www.visualcapitalist.com/combustion-vehicle-sales-peak/
https://news.exeter.ac.uk/faculty-of-environment-science-and-economy/electric-vehicles-to-pass-two-thirds-of-global-car-sales-by-2030/#:~:text=Global%20electric%20vehicle%20(EV)%20sales,2030%2C%20according%20to%20new%20analysis.
Combustion engine vehicle sales has been falling since 2017 and the number of scrapped combustion engine vehicles will exceed new one built by next year.
Looks like decline in oil production and decline in oil demand will be closely matched and peak oil will not matter very much
Help me see this Tim.
The data shown on your link does show a trend these last few years in China. I’m not seeing that in the global data though. It looks like global ICE sale dropped fairly sharply during the supply chain price spikes during COVID and are steady these last few years.
A car purchase represents a very significant personal investment for most of the world’s drivers, and a new car should be able to last 12-15 years. It doesn’t seem like the “fuel” economics have changed enough to prompt early abandonment of vehicles that still have useful life left in them. I would think that this would make the 12-15 years range an upper bound for how rapidly any transition to BEVs would occur. If adoption were really occurring at this rate globally we should see ICE sales dropping at something like 5-7M/yr. I’m not seeing it.
Add in the barriers to charging and potential for lower oil prices to make ICE operations cost competitive and it looks like any transition will take quite a bit longer.
And, this completely ignores material constraints on such a transition as Michaux regularly points out.
My mistake.
Global car sales in 2023 reported as 75.3M units. EV sales of 13.7M units. If 75.3M were a steady state number (it’s not), 13.7M/yr would allow replacement of current stock very rapidly.
https://www.statista.com/statistics/200002/international-car-sales-since-1990/#:~:text=Worldwide%20car%20sales%20grew%20to%20around%2075.3%20million,up%20from%20around%2067.3%20million%20units%20in%202022.
https://about.bnef.com/blog/electrified-transport-market-outlook-1q-2024-speed-bumps/?utm_source=social-o&utm_medium=Twitter_BNEF&utm_term=13083949056&utm_campaign=835934&tactic=835934&linkId=386151488
T Hill,
Yes the number of light duty vehicles sold is not constant.
See https://ourworldindata.org/electric-car-sales
where I got the data for chart below. The peak vehicle sales since 2010 was in 2018 at 86 million, in 2023 it was about 77 million vehicles sold.
Chart below is ICEV sold since 2010, peak was 84 million in 2018 and in 2023 it was 63 million sold. The past 6 years electric car sales have grown at 43% per year.
T Hill,
Using data from
https://tedb.ornl.gov/data/
I assume the average light duty vehicle is scrapped after 13 years, this is what the World light duty ICE fleet looks like through 2039 assuming electric vehicle sales growth continues at 40% per year through 2028 and sales of light duty vehicles are flat from 2024 to 2039.
Note that this ignores the possibility that self driving becomes a reality (Tesla is fairly close on this) and that TaaS from self driving electric vehicles reduces light duty vehicle ownership as many will just call a cheap robotaxi with a smart phone after 2030. Miles travelled with light duty ICEVs will drop like a rock when this occurs.
Slight revision to light duty ICE vehicle scenario, with average ICE vehicle assumed to be scrapped after 20 years starting in 2021 (cars sold in 2001 are scrapped in 2021).
Note that I expect heavy duty vehicle may follow this trajectory startin about 5 years later than the light duty vehicle chart 9 so peak fleet size for heavy duty ICEV reached in 2029 followed by decline to zero over next 18 years (in 2047).
I have been testing out my free month of Full Self Driving this week in my Model Y. I have to admit I’m pretty impressed. Also this week from The NY Times lots of autonomous vehicle action in China, nine companies already have cars on the roads. 2024 is shaping up to be a big year for AVs. I remain skeptical on several levels but it does seem like someone is going to crack it in the next year or two.
https://www.nytimes.com/2024/06/13/business/china-driverless-cars.html
Stephen,
I wonder how charging is supposed to work for a robotaxi. I can see how it could work for a fleet operator with humans to plug in vehicles back at a charging area where vehicles are stored, for a private individual trying to use a robotaxi to earn income while they were away on vacation or working there is no way to charge the car, unless the car stops at a supercharger and asks the passenger to plugin the car. With current technology in the Tesla this doesn’t really seem viable.
Probably a docking station it drives up to and nudges up to or extends a post and plugs into the charging connection that is fixed, not a cable. Much like a Roomba or R2D2.
Gungalonga,
Perhaps there will be something like that, but note that for fast charging it will be a technical challenge, at present plugging in a cable is the fastest option. For private robotaxi owners the car could simply return home when the battery gets to some preassigned level, the owner can plug in the car when they return home. Or Tesla could have Optimus robots at Super chargers waiting for Robotaxis to arrive and the robot could plug in the car (this seems a very expensive solution). Also discounts could be offered to customers willing to plug in the car at a Super charger and wait 15 minutes for the car to charge.
Maybe send the car out at full charge, have it head home when it gets low. Lots of taxi driving is low mileage city driving at 20-30 miles of driving per hour which EVs excel at. Still get 6-10 hrs of rides off a full charge. More worried about the condition of your car once you got it back. I can see a company like Revel in NYC switching to robotaxis and having a few full time employees for cleaning and charging
https://gorevel.com/
T Hill
The number of vehicles scrapped is approximately equal to the number sold with a gap of some 12 years. If global vehicle sales peaked in 2018 then the number of vehicles scrapped will peak around 2030 at about 90 million.
https://www.iea.org/data-and-statistics/charts/global-car-sales-by-key-markets-2005-2020
In 2018 the number of electric vehicles sold numbered about one million, this year the figure will be somewhere around 17 million. As the scrapped number of vehicles increases and the number of ice vehicles continues to decline we get a crossover point. At that point the ice vehicle fleet starts to decline, we are close to that point. Thereafter demand for road transport fuels starts to rapidly decline and continues to do so.
However there are 1.4 billion light vehicles and even if electric vehicle sales reach 100% it will take many years before all the existing ice vehicles get scrapped.
Hi Tim,
The last number I could find was for 2019 with World light duty vehicle fleet at about 1.1 billion, my estimate for ICEV fleet in 2023 is about 1.15 billion (with about 42 million vehicles in plugin vehicle fleet). Other estimates have vehicle fleet at 1.4 billion in 2023, with 97% ICEV (1.36 billion). So my previous chart is off a bit. Adjusted scenario below.
Hi Dennis
You have the global ice fleet falling by 700 million in 2035? That is a very considerable drop. Have you done a graph of ice vehicle sales over that time?
Thanks
Tim,
The scenario assumes plugin vehicle sales grow at 40% per year until 2028 and top out at 76.7 million in 2029 with ICEV sales at zero in that year for light duty vehicles.
Previous scenario probably too optimistic with 40% plugin sales growth for next 5 years, this scenario has gradually falling sales growth (40%, 35%, …, 10%, …, 10%, 3.58%, 0%) from 2024 to 2035, gives following
ICEV sales for scenario above
Debate Rages Over Global Oil Demand
Friday, June 14, 2024
After several weeks of unpredictable see-sawing, oil markets are back to their usual self. The IEA and OPEC are publicly arguing about the future of oil demand, U.S. interest rate cuts are still not happening, and questions remain about the strength of summer gasoline demand. That said, a positive outlook in U.S. inflation data might have helped to tilt the balances slightly in favor of oil bulls, with Brent closing the week around $83 per barrel.
IEA Paints Bleak Picture for Oil Demand. The International Energy Agency predicts a 2029 peak in global oil demand at 105.6 million b/d, predicting a price slump as it believes global supply capacity will hit almost 114 million b/d by the end of this decade.
OPEC Defies Oil Pessimists, Says Demand Grows for Decades. Calling the IEA’s report ‘dangerous commentary’, the OPEC secretary general Haitham al-Ghais stated he doesn’t see a peak in oil demand until at least 2045, saying consumption will grow to a hefty 116 million b/d.
I side with the IEA in this debate. There is a lot more to this article, along with some great charts. Click on the blue headline above to read the rest of the article.
“the OPEC secretary general Haitham al-Ghais stated he doesn’t see a peak in oil demand until at least 2045”
Wishful thinking from those with a big pile of oil to sell. Unwishful thinking for the rest of us.
These “debates” are such an exercise in futility. Apart from the massive uncertainties involved, everyone fails to recognize that the marginal demand is coming from non-OECD and is very price-sensitive. No one seems to include the price-related feedback loop in their analysis.
The Saudi rightfully point out the billions of people in non-OECD countries whose oil consumption is very low and is entering the sigmoidal stage of growth. Fine. However these billions of people simply don’t have the means to pay $95 per bbl so that the Saudis can build their opulent dream cities in the desert. They simply cannot afford it.
IEAon the other hand thinks that EVs etc., would reduce oil demand drastically. Fine. But if that were to happen and oil drops to $60 or below, you don’t think that the billions of people in non-OECD Asia for example would not ramp-up their consumption?
Kdimitrov,
As Chinese EVs get exported to the non-OECD, as charging infrastructure gets built out, and as Indian 2W and 3W EV producers ramp output and also start exporting after market saturation in India, the oil won’t be able to compete even at $60/bo, the TCO of EVs will become better and better as they scale and costs come down and oil will no longer be competitive for land transport, the IEA scenario is conservative in my view.
Good luck charging them in many coutries where 2kw already lets the light dim. Or daily blackouts.
They need huge investment in the grid before. This is a long Transformation- Smartphones where faster because they need less Infrastruktur.
Eulenspiegel,
Perhaps true in some places, I imagine the grid can be expanded where needed. I imagine in many nations there is adequate capacity to charge 2W vehicle batteries which tend to be smaller. Also the 4W vehicles will tend to be smaller with smaller batteries. Grid expansion and expansion of vehicles sold will proceed in tandem.
Maybe they wont have to pay for their oil in dollars. They will all be members of BRICS by then. Pay in their own currency and settle with gold or RMB. Could be lots more demand under such a new payment system.
They will all be members of BRICS by then. Pay in their own currency and settle with gold or RMB
Where will they get the RMBs? You have to be a net exporter to China to have RMBs to send to the Saudis. Not many countries do, though I guess Japan and Brazil do. But Brazil exports oil to China, and Japan doesn’t seem like a likely BRIC candidate.
As for gold, there simply isn’t enough around to keep international supply chains liquid. All the gold in the world is only worth about $11 trillion, and very little of it changes hands on a regular basis.
The whole bricks thing is a kooky right wing fantasy fueled by Putin’s propaganda machine. The numbers make no sense at all.
What Putin doesn’t seem to understand is that by waging war against Europe, he is turning Russia into a Chinese province. He is wildly overplaying his hand.
KDimitrov- yes to those points, both certainly are a big part of the overall equation.
North Dakota data is out. Looks like they have plateaued.
ND Monthly Oil Production Statistics
From the Director’s Cut
Wells Permitted
February 63
March 72
Rig Count
February 38
March 40
April 38
Waiting on Completions
February 300
March 345
Inactive
February 1,518
March 1,949
Completed
February 92
March 56 (Preliminary)
April 56 (Preliminary)
Bakken scenario where I assume low oil prices under $80/bo and a gradual decrease in rig count after May 2024.
Oil rigs down by 4, fracs down by 6. The slow bleed continues…
https://oilprice.com/Energy/Energy-General/US-Oil-Gas-Drilling-Activity-Sees-Further-Declines.html
Stephen,
For major tight oil basins (Permian, Bakken, Eagle Ford and Niobrara) only a drop of 1 horizontal oil rig this past week. Note that it takes about 7 months to see this effect as there is a 7 month delay between start of drilling and first oil output on average. Also frac spread count includes both oil and natural gas directed frack spreads so that data is harder to read.
The Rig report for the week ending June 14
– US Hz oil rigs decreased by 4 to 440. This is the sixth consecutive weekly drop, down 18 from 6 weeks ago.
– Texas Permian dropped 2 to 193 while New the Mexico Permian added 1 to 103. The Texas Permian is down 51 rigs from May 2023 high of 244.
– In New Mexico, Lea county added 1 to 50 while Eddy was unchanged at 52.
– In Texas, Martin and Midland were unchanged at 32 and 20 respectively.
– Eagle Ford was unchanged at 47. EF has had 46 ± 2 operational rigs for the last 5 months
– NG Hz rigs were unchanged at 86. (Not shown)
No Frac Spread report for the week ending June 14 has been posted as of Friday midnight. The down six that Stephen plus Hren is reporting is for the week ending June 7.
I see it now
Stephen + Hren
Thanks
Frac Spread report for the week ending June 14
The frac spread count rose by 3 to 250 and is down by 18 from one year ago. It is also down by 22 spreads since March 8. The overall trend in frac spreads appears to be down.
Horizontal Oil Rig (HOR) Count for Bakken and Niobrara, unchanged from previous week. The HOR count dropped by 2 rigs in Oklahoma.
Dennis
The loss of two more rigs will just mean that Oklahoma’s production decline will slowly continue. They are down 6 rigs from the beginning of the year.
Ovi,
I was mostly trying to find where the rigs dropped besides Texas. I agree Oklahoma will continue to decline.
Ovi and Dennis. Don’t give up on Oklahoma too fast…. there is a very large swath of acreage in play for the Red Fork/Cherokee and other plays that extends across 4-5 Oklahoma counties and even into Texas now. Starting to get more widespread high-quality results. Could be over 250,000 acres in play now. Devon, Mewbourne, Continental, etc….
May not change the globe’s direction, but certainly could give OK a boost for a while if it works well.
Gungagalonga,
Just baseing the forecast on the trend in horizontal oil rigs, that trend can change, always difficult to predict the future.
I leave you an analysis of oil production for the period 2030-2050, with many graphs of old and young supergiant fields. The report is in Spanish.
https://futurocienciaficcionymatrix.blogspot.com/2024/06/el-informe-iea-sobre-la-abundancia.html
The above Spanish paper is translated into English in the files below. Due to size limits it had to be broken up into 4 parts.
https://peakoilbarrel.com/wp-content/uploads/2024/06/The-IEA-report-on-the-extreme-abundance-of-oil-Part-1.pdf
https://peakoilbarrel.com/wp-content/uploads/2024/06/The-IEA-report-on-the-extreme-abundance-of-oil-Part-2.pdf
https://peakoilbarrel.com/wp-content/uploads/2024/06/The-IEA-report-on-the-extreme-abundance-of-oil-Part-3.pdf
https://peakoilbarrel.com/wp-content/uploads/2024/06/The-IEA-report-on-the-extreme-abundance-of-oil-Part-4.pdf
Thanks, interesting…
Using data from energy institute for oil, natural gas and coal primary energy consumption in exajoules and taking the natural log to show growth rate (slope of data is the percentage rate of growth), we find growth has levelled off from 2018 to 2022 and it is likely to soon decline, perhaps starting in 2026 and accelerating.
There are some that claim that the ramp up in non-fossil fuel energy production will increase the rate of growth in fossil fuel use, but this chart suggests the opposite with growth slowing from 4% per year from 1965 to 1979 to 1.9% per year fro 1983 to 2008, to 1.2% per year from 2010 to 2018, and to 0.3%/year from 2018 to 2022. The rate of growth is slowing down and may soon become negative.
Do you really think that global fossil fuel combustion may peak as early as 2026, in the absence of prolonged global recession?
If so, it would be almost a decade earlier than I would have guessed.
In lieu of new understanding of the various factors on my behalf, I’m still of the mind of a mid 2030’s peak.
Hickory,
The 2026 estimate may be optimistic (yes this assumes no recession), probably 2030 is a better estimate. Keep in mind however that the IEA has consistently underestimated the speed that wind, solar, and EVs would take market share if one looks at historical projections, so my guess is that 2030 is a conservative estimate, 2026 is optimistic and maybe 2028 is more realistic. We will know more when the 2023 data from Statistical Review of World Energy 2024 comes out in a few days (June 20, 2024).
https://www.energyinst.org/statistical-review
Note that if we drop the 2020 data point from the 2018 to 2022 period, the rate of growth in consumption in World primary Energy Consumption drops to 0.28% from 0.3% in intitial estimate. Several factors are converging, the rapid growth in electric transport (reducing oil use) and the rapid growth of wind, solar, and batteries which will reduce the growth of coal and natural gas for electricity production. Also we can add the more common use of air and ground source heat pumps which reduces demand for natural gas to heat homes, commercial buildings, and water.
Also there are view points much more optimistic than mine
https://www.rethinkx.com/
I put significant weight on the big factors of continued human population growth for a few more decades, and the great inertia of the overall energy/industrial system mechanisms.
Hickory,
The rate of growth of population has been decreasing since 1980, this is likely to continue.
Fossil fuel growth rates are also decreasing.
“In the U.S., the world’s largest gasoline market, refiners ramped up sharply, expecting demand that never materialized. U.S. gasoline demand was 9 million barrels per day (bpd) in the first week of June, 1.7% below last year and seasonally the lowest since 2021, government data showed.”
https://www.reuters.com/markets/commodities/global-gasoline-refining-margins-slump-slow-summer-driving-season-2024-06-17/
Saudi Consumption — Not Production — Is Key to Peak Oil
The Shoaiba power plant, a sprawling complex of giant boilers and towering chimneys, is the improbable ground zero of the forces reshaping the energy market. Located in Saudi Arabia, it’s the world’s largest oil-fired electricity generator. At its peak, it gulps about 200,000 barrels a day, more than enough to meet the daily consumption of a small European nation like Portugal1.
If global oil demand is to peak within the next five years, as the International Energy Agency just predicted, it will require more than mass adoption of electric vehicles. Ironically, Riyadh will have to slash its own use of its homemade power source, making the Shoaiba and similar power plants the stuff of yesteryear.
The staggering amount of oil the Saudis consume – 3.7 million barrels a day, the world’s fourth most, behind only the US, China and India — means the kingdom would play a key role in shaping demand to 2030, potentially accelerating peak consumption – or delaying it2.
In its latest projection, released last week, the IEA forecast that Saudi oil demand would see the second-steepest decline in absolute terms between now and the end of the decade, falling by more than 500,000 barrels a day. Only the US, thanks to work-from-home and more efficient gasoline and diesel vehicles, in addition to EVs, would see an even larger drop3.
Put succinctly, global oil demand can only peak in 2030 if Saudi Arabia plays ball, embarking in a massive oil-saving program. If it doesn’t, the global numbers don’t add up.
The kingdom, a nation of roughly 35 million, needs lots of electricity to power air conditioning during its sweltering summers and to desalinate sea water4. The power-and-water sector accounts for about 25% of total Saudi oil consumption, a global oddity: The rest of the world largely stopped using crude for power generation after the 1970s oil shocks made the fuel prohibitively expensive.
But oil is, of course, cheap in the kingdom, and the Saudis often burn it directly in power plants, without first refining it into diesel or fuel oil. It’s an inefficient and filthy system, but it works, particularly during the summer when the Saudis need to boost electricity production sharply at short notice. At its seasonal peak, typically in late August and early September, Saudi Arabia burns about 1.4 million barrels a day of unrefined crude and fuel oil in its electricity plants — that’s equal to the total oil daily consumption of France.
Thankfully, the Saudis plan to switch to gas-fired power plants and renewables, reducing, if not phasing out, oil in electricity generation by 2030. Thus, the IEA projection is based largely on what Saudi officials have themselves promised to do.
Oil-fired power plants are also gas-fired plants. They can use either; they just switch injection devices. Gas plants use openings that pump gas into the boiler. The plants can switch to oil by using spray heads that spray oil into the boiler.
Ron,
A natural gas power plant is not a simple boiler like what is used in some homes for heat. It is typically a combined cycle gas turbine system which does not work with oil.
See https://en.wikipedia.org/wiki/Combined_cycle_power_plant
Excerpt:
In stationary and marine power plants, a widely used combined cycle has a large gas turbine (operating by the Brayton cycle). The turbine’s hot exhaust powers a steam power plant (operating by the Rankine cycle). This is a combined cycle gas turbine (CCGT) plant. These achieve a best-of-class real (see below) thermal efficiency of around 64% in base-load operation. In contrast, a single cycle steam power plant is limited to efficiencies from 35 to 42%. Many new power plants utilize CCGTs. Stationary CCGTs burn natural gas or synthesis gas from coal. Ships burn fuel oil.
I would expect the Saudis will use a combined cycle natural gas power plant rather than simple steam boiler. This would be a smart move if they can sell the oil as exports for more than they need to pay for natural gas (if imported) or if it is cheaper to develop local natural gas. Also I would imagine the solar resource is pretty good in Saudi Arabia.
Dennis, I know that combined cycle power plants are not simple boilers. For the first stage, they use gas turbines, and then the boilers are powered by the heat from the turbine output. A combined cycle can burn only gas, never oil.
However, the Shoaiba power plant is not a combined cycle plant. Neither are virtually all Saudi’s other power plants as well as their massive desalination plants. They are all plants that can burn either gas or oil. I worked at Saudi’s Gazlan power plant for two years. I helped commission it in 1980. That plant, like all their other power plants and desal plants, would burn anything liquid or gas. It would burn crude oil right out of the ground. We burned ethane most of the time and occasionally methane. Occasionally we would burn crude oil, bunker fuel, and occasionally even naphtha. Naptha is pentane or what we here call condensate.
At the time I was there, 1980 to 85, they had no combined cycle plants, though they may have some now. The last two years I was there, they built an enormous desal plant. It would also burn gas or oil. There were lots of small reverse osmosis plants for remote places. And there were lots of remote areas with no piped in water. But the lion’s share of their water came from giant boiler plants.
Ron,
I was simply speculating that if the saudi plan is to build more natural gas fired power plants, they are likely to be combined cycle as they are far more efficient, also solar power would help with reducing the need for fossil fuel power particularly in the Summer. I would think the net savings would be significant if they imported natural gas and exported more of their crude.
Of course, you are correct. They don’t have enough gas, but their next-door neighbor, Qatar, has plenty, so much so that they liquidify it to export. But Saudi and Qatar have been funding for years. Lately, there have been signs that they may have kissed and made up. If so, that would be great. They can import cheap gas and sell their crude.
Rystad says peak oil supply has arrived. Well, at least for the next two years.
Rystad Predicts Near Zero Oil Supply Growth in 2024
Based on the most recent OPEC+ guidance, total global oil supply growth will be near zero in 2024, which could render this year the first since 2020 with zero supply growth, Rystad said, estimating expect supply growth at around 80,000 barrels per day for 2024, down from earlier expectations of 900,000 bpd, which had been made in early June Reuters reported on Monday.
Rystad noted that OPEC+ cuts will take 830,000 bpd off the market in 2024 and 1.04 million bpd off the market next year, with U.S. shale being the most “trustworthy source” of supply growth.
“The market initially responded negatively to the latest OPEC+ guidance. However, it’s difficult to remain completely bearish when global oil supply growth is expected to slow down in 2024 and reduced production is still a possibility in 2025,” Reuters quoted Rystad vice-president Patricio Valdivieso as saying.
OPEC’s current strategy aims to keep production at a level that can support oil prices in a range of $80-$100/bbl, which becomes challenging if U.S. production continues to grow, as it has for over a decade and a half.
Last week, OPEC released its monthly oil market report (MOMR), keeping its demand growth forecast for the year unchanged at over 2 million bpd. Simultaneously, the International Energy Agency (IEA) released a new market report with significantly different projections, forecasting a “staggering” supply overhang of 8 million bpd in spare production capacity by 2030. The forecast angered OPEC, which called the prediction “dangerous” and warned it could inject additional volatility into oil markets. By Michael Kern for Oilprice.com
With enough investment, peak oil would never happen. Enough money can put more oil in the ground.
UK Oil Industry Needs Investment and Political Support to Halt Output Decline
This is according to Offshore Energies UK, formerly Oil and Gas UK, the industry group that earlier today published its Economy & People Report 2024. In the report, the authority also said that with the right political support investment in what it calls offshore energy could rise to over $25 billion from $16.5 billion in 2023.
The offshore energy that OEUK talked about included oil and gas, hydrogen, carbon capture, and offshore wind power.
“With supportive policy, the industry can deliver enduring economic value, scale up our supply chain capacity, sustain skilled jobs, deliver energy security, all while delivering on our climate goals,” Offshore Energies UK said.
The UK is currently producing some 1.2 million barrels of oil equivalent but this will fall steeply to just 700,000 barrels daily by 2030, according to forecasts by the North Sea Transition Authority—the industry regulator, as cited by Bloomberg.
According to Offshore Energies UK, the decline could be softened to 900,000 bpd if investments keep flowing into the industry, a 30% increase on current estimates. Yet for that to happen, oil and gas operators in the North Sea need a hand from the government.
“With enough investment, peak oil would never happen. Enough money can put more oil in the ground.”
Good one Ron, and you delivered it with a straight face!
But it begs the question- just what is the best place to deploy new energy production capital now?
Hi Dennis
Taking the figures from Our World in Data and assuming average age of a light vehicle is 13 years before being scrapped it is reasonably likely that the global vehicle fleet of ICE vehicles is already declining.
https://ourworldindata.org/grapher/car-sales
By 2030, the number of ICE vehicles being scapped will be around 80 million, reflecting the number built in 2017. Even at a modest growth rate, electric vehicles will represent 60% of the market in new vehicle sales.
Ice vehicle sales will probably be less than 30 million.
I think your revised estimate of the ICE fleet declining by 200 million in 2030 and 600 million in 2035 is about right.
Along with better fuel economy is new ICE vehicles and a considerable reduction in the ICE fleet by 2030, road fuel demand will fall by over 3mbl/d.
Do you think global oil production would fall that much in 6/7 years?
“47% of New Cars Sold in Netherlands in 2024 Have a Plug!”
Its not 90%, but we are getting there.
Sometime around year 2018 I guessed that by 2030 90% of global light vehicles sales would have a plug.
I might end up being wrong. It might not be until 2032.
What will the price of electricity be in the Netherlands by then? Between cars and AI data centers, prices are going up up up!
Kengeo,
Electricity in 2024 is about 32 euro cents per kWh, but note that petrol is about $2 Euros per liter or about 7.50 Euros per gallon. So assuming ICEV with average fuel economy of 35 MPG that would be about 21.4 eurocents per mile vs M3 with typical 4 miles per kWh so about 8 Euro cents per mile, they might have special rates for EV charging overnight which might enable a lower rate, but even without such a rate at say 12k miles per year the ICEV would have $2568 in fuel cost and EV about $960 in electricity cost, so $1608 in savings per year. Of course as you know maintenance costs tend to be low for EVs relative to ICEVs.
Hickory
The US is a different EV World
“Americans were never prepared to embrace electric vehicles at the rate predicted by many industry and government ‘experts,’” iSeeCars executive analyst Karl Brauer told Yahoo Finance. “It was obvious getting from 3% to 7% EV share was much easier than getting from 7% to 10%. And getting EV share to 20%, 30%, or more percent? That was clearly a long ways off.”
Said CarGurus director of industry insights Kevin Roberts: “The hoped-for EV adoption curve always felt accelerated by an understandable mix of government desire to reduce emissions, along with automakers looking to match Tesla’s margins and stock price success.” He added, “Decisions were made to attempt to go straight to EVs, and bypass a transitional generation of hybrid powertrains that would’ve allowed for more time to develop consumer comfort in the segment and build up charging infrastructure.”
I could never figure out how all of these executives could make such a big mistake. Toyota are the only guys that got it right, besides me and Hickory. PHEVs to start the transition.
https://finance.yahoo.com/news/why-automakers-are-backtracking-on-their-ambitious-ev-game-plans-162555455.html
Ovi,
Plugin vehicles (plugin hybrids and EVs) seem to be doing pretty well in Canada lately.
https://ca.finance.yahoo.com/news/canadas-ev-rebate-program-hits-record-as-tesla-dominates-claims-135329738.html
Dennis
The long cold winter scares off a lot of EV buyers in Canada. That is one reason they are more comfortable with PHEVs.
Quebec is a mostly electricity producing province that sells huge amounts of electricity to New York and possibly other surrounding states. They have been pushing Quebecer’s to buy EVs with provincial subsidies. Also I heard that electricity there is inexpensive. From the clip below you can see that Quebec dominates.
“Quebecers are the top users of the federal iZEV program so far in 2024. Drivers in that province filed over half of the roughly 60,000 claims submitted this year. Ontario and British Columbia followed, submitting about 12,000 claims each.”
Dennis
How does 7.8 Cdn ¢ compare with US rates?
Ovi,
I pay 16 cents per kWH overnight and 24 cents per kWh during the day (TOU rates), what is the price where you live? It is cheaper elsewhere in the US I think the average for residential is about 12 cents per kWh in the US so Quebec is cheap compared to US. Currently Canadian dollar is at $0.73 US$ so Quebec is at 5.9 cents US which is quite low, for a Tesla Model 3 that would be about 1.48 cents (US) per mile in Quebec.
https://www.hydroquebec.com/data/documents-donnees/pdf/comparison-electricity-prices.pdf
For Montreal the residential price for electricity was about 7 times less than Boston, Massachusetts in April 2023.
These very low electricity prices may be part of the explanation for higher plugin sales in Quebec. Ottawa, Vancouver, and Winnipeg all have lower prices than most cities in the US.
Dennis
Here are the rates in Toronto.
Dennis
Low electricity costs help EVs but I think it is a combination of cold winters and electricity cost that are pushing Canadians toward PHEVs.
I wonder how EV adoption changes in going south from Northern US states?
From the article below
“The decline was entirely accounted for in the battery electric vehicle segment (BEV), which dropped to 9.2 per cent in Q1 from 10 per cent in Q4. Plug-in hybrid vehicles (PHEV), meanwhile, saw a slight increase to 3.3 per cent in Q1 from 3.2 per cent in Q4.”
EV sales in Ontario are low compared to Quebec and BC because of the lack of a provincial subsidy. The high BEV sales in Quebec are largely Teslas. It will be interesting to see if the PHEVs catch up as more models become available,
https://electricautonomy.ca/data-trackers/2024-06-19/sp-zev-q1-market-share-canada/
Ovi,
Thanks. Those overnight rates are quite low. I am not familiar with the subsidies in Canada and how much they vary from province to province.
There’s truth to the US being a different world for EVs. A lot of this is because of the longer distances we travel and how car dependent we are. Also because we produce a lot of our own oil and it is relatively inexpensive. This means that growing the EV fleet happens at the expense of another part of our economy, unlike in China and much of Europe where overall oil production is much below consumption, so making the switch is more obviously a good move. So it will happen a bit slower here. But one unaccounted for phenomenon is that the existence of EVs is putting huge pressure on ICE power trains to become more efficient, mostly by transitioning to a hybrid format. So the EV transition happens a bit slower, but gas needs are still dropping relatively quickly.
Stephan + Wren
The other thing the PHEVs sales do is to allow research to make cheaper and better parts. The big thing right now is to perfect a solid state battery. So the current battery makers make a profit while making current batteries, reinvest in research, and at some point we have a battery breakthrough
Ovi we talked about this upcoming PHEV vehicle not too long ago.
https://www.ramtrucks.com/electric/ram-1500-ramcharger.html
I recently saw news that Jeep was going to utilize the same powertrain setup for Wagoneer and GrandWagoneer models. I didn’t see the model year of planned release…perhaps 2026?
https://www.kbb.com/car-news/jeep-wagoneer-hybrids-coming-with-ramcharger-tech/
I thought that I would gladly pay 100 SEK/l (a lot of USDs/gallon) to run my old fuel chainsaw, luckily there are now options, a retired collegue recommended this one:
https://www.husqvarna.com/us/chainsaws/120i-battery-and-charger-included/
So a bit less C&C needed for me.
Tim,
I think by 2030 demand for oil is likely to be falling faster than supply at current prices (around $85/b for Brent in 2024 $) and we may see oil prices start to fall in order to balance the market, so supply will need to adjust lower by fewer wells being drilled in marginal fields (tight oil plays, Artic oil. and some ultra deep water projects may no longer be viable).
Dennis
I think you could be right and global oil demand will fall slightly faster than production decline.
The IEA has a different view and believes that with the current stated policies of all governments, oil consumption will increase.
https://www.iea.org/data-and-statistics/charts/oil-demand-by-sector-and-scenario-to-2030
As you can see, the increase comes from freight transport, aviation, shipping and chemicals. Only if governments deliver on all pledges will oil consumption fall and few governments have delivered on any pledges since the first IPCC report in 1990.
Perhaps all the reduced demand from light vehicles will be taken up by other sectors and peak oil could have a major impact on those sectors.
Tim,
I expect that freight transport on land will also be electified, air and water transport probably not as much. In addition I expect coal and natural gas use for electricity generation will be replaced with wind and solar, falling coal and natural gas prices will make many resources unprofitable to produce and will reduce supply of oil, natural gas, NGL, and coal. There may be limited supply of inputs for petrochemicals and fewer of the one use plastic waste stream products might be produced which may limit the expansion of the petrochemical industry and perhaps might lead to more recycling of plastic to reduce the need for new petrochemical production.
Much of this change can be driven by lower costs of electric transport and an electric power system driven by wind, solar, hydro, and batteries, heat pump technology will also help reduce fossil fuel use for heating buildings and water.
Any guesses on 1P and 2P oil reserves from Rystad’s annual report (due next week?)?
Mine is 270 Gb and 470 Gb, respectively…
New Posts are up
https://peakoilbarrel.com/opec-update-june-2024/
and
https://peakoilbarrel.com/open-thread-non-petroleum-june-19-2024/