A guest post by Ovi
Below are a number of Crude plus Condensate (C + C) production charts, usually shortened to “oil”, for Non-OPEC countries. The charts are created from data provided by the EIA’s International Energy Statistics and are updated to July 2022. This is the latest and most detailed world oil production information available. Information from other sources such as OPEC, the STEO and country specific sites such as Russia, Brazil, Norway and China is used to provide a short term outlook for future output and direction for a few countries and the world. The US report has an expanded view beyond production by adding rig and frac charts.
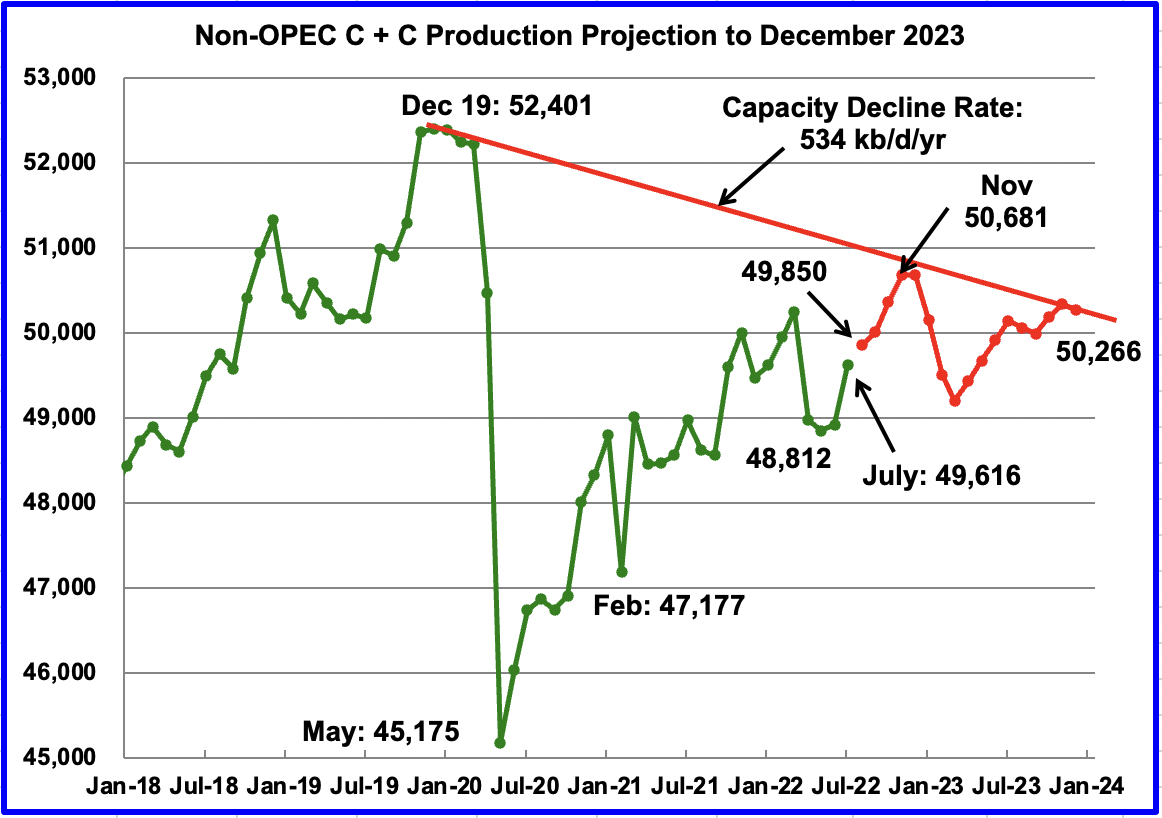
July Non-OPEC oil production increased by 697 kb/d to 49,616 kb/d. The largest increases came from Norway 311 kb/d, Kazakhstan 200 kb/d and Canada 178 kb/d. The largest offsetting decrease came from China 153 kb/d.
Using data from the November 2022 STEO, a projection for Non-OPEC oil output was made for the time period August 2022 to December 2023. (Red graph). Output is expected to be 50,266 kb/d in December 2023.
Note that the November 2022 post pandemic high of 50,681 kb/d is the high for all of 2022 and 2023.
The red capacity decline line represents a two point average decline rate for Non-OPEC countries over the four years since December 2019 and is a combination of the natural decline rate plus possible reduction in exploration and production investment.
Non-OPEC Oil Production Ranked by Country
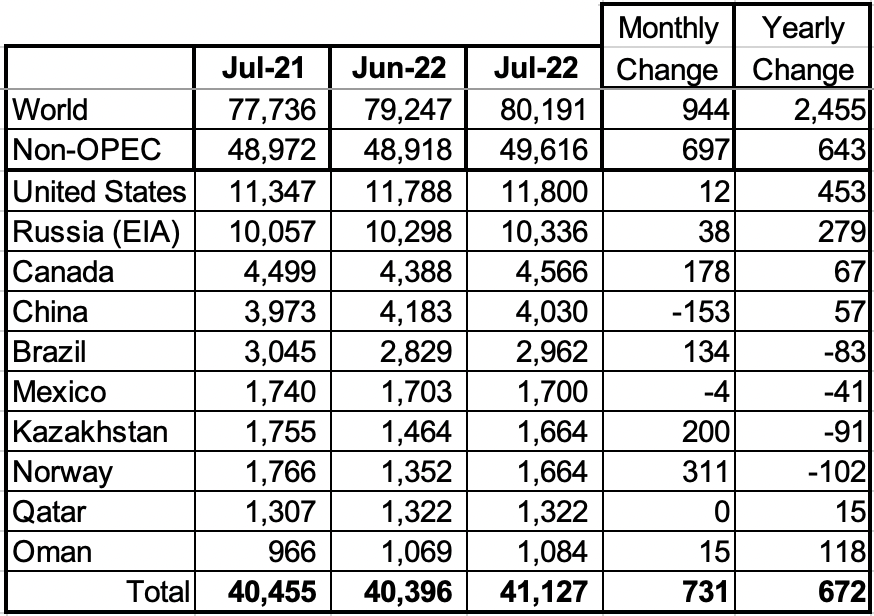
Listed above are the World’s 10th largest Non-OPEC producers. The criteria for inclusion in the table is that all of the countries produced more than 1,000 kb/d. Only China experienced a big loss in July. The July increase for all Non-OPEC countries was 697 kb/d.
In July 2022, these 10 countries produced 82.9% of the Non-OPEC oil. On a YoY basis, Non-OPEC production increased by 643 kb/d. World YoY July output increased by 2,455 kb/d.
Non-OPEC Production Charts
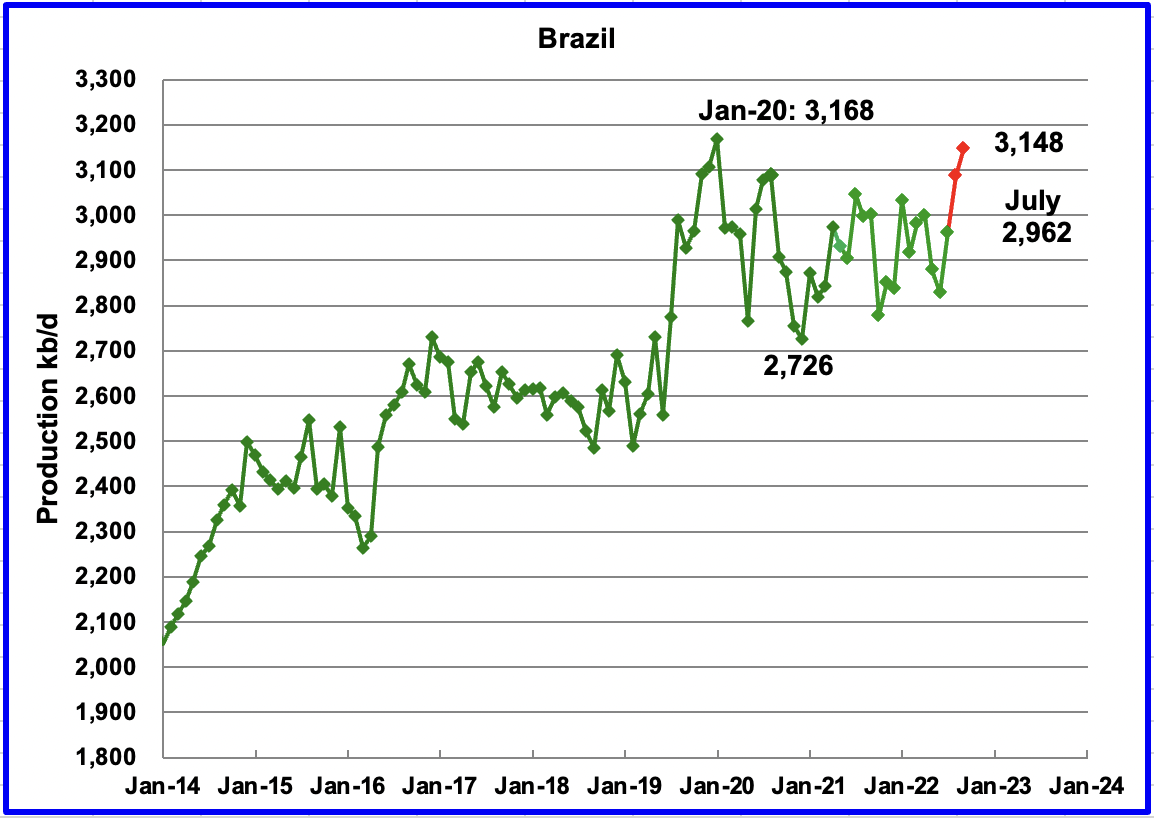
The EIA reported Brazil’s July production increased by 133 kb/d to 2,962 kb/d.
Brazil’s National Petroleum Association (BNPA) has resumed reporting Brazil’s monthly production. August’s output increased by 125 kb/d while September added an additional 61 kb/d to 3,148 kb/d. The overall increase from the June low was 319 kb/d.
According to OPEC: “Offshore maintenance eased slightly in July, allowing crude production to rise back above 2.9 mb/d for the first time since April.”
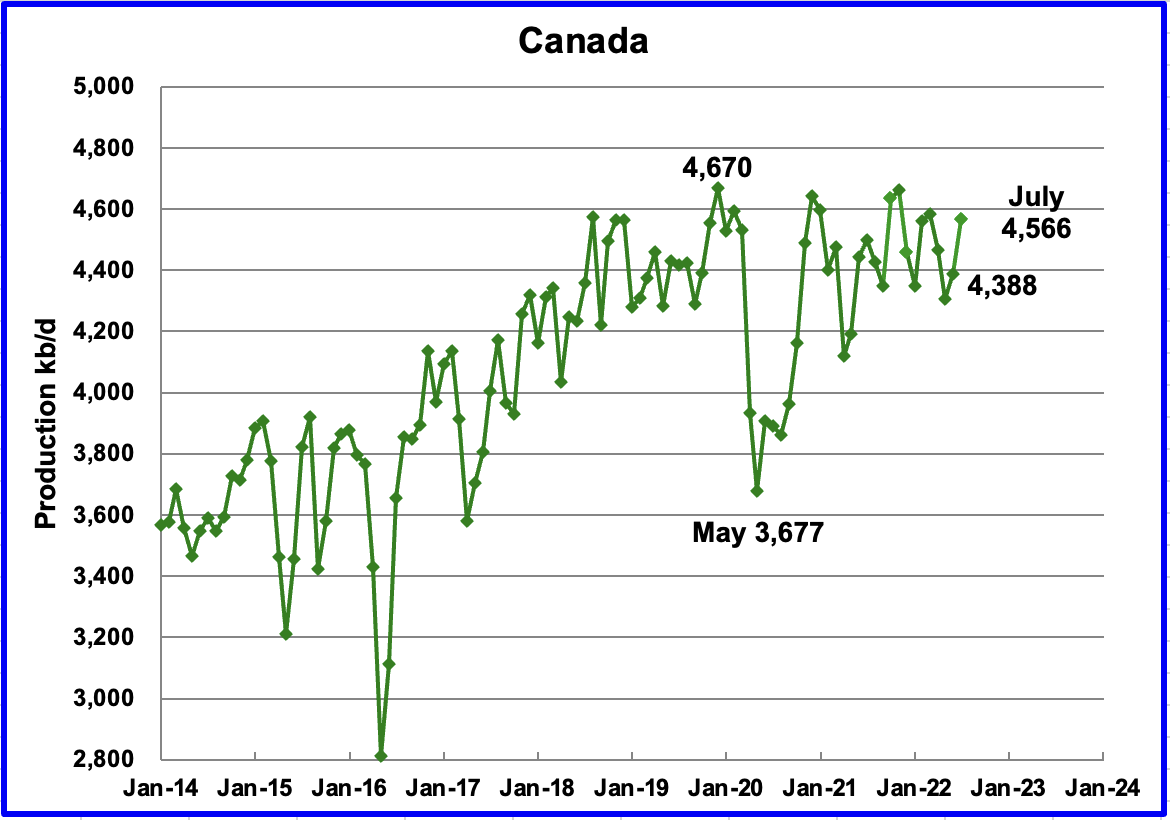
According to the EIA, Canada’s July’s output increased by 178 kb/d to 4,566 kb/d.
In the previous report, it was noted that preliminary data from the Canadian Energy Regulator (CER) indicated that July production was 4,802 kb/d. However since the EIA subtracts approximately 250 kb/d from the CER report, Canada’s projected July output was reduced and estimated to be close to 4,550 kb/d. The actual July output is 4,566, a difference of 16 kb/d.
Rail shipments to the US in August were essentially flat at 155 kb/d.
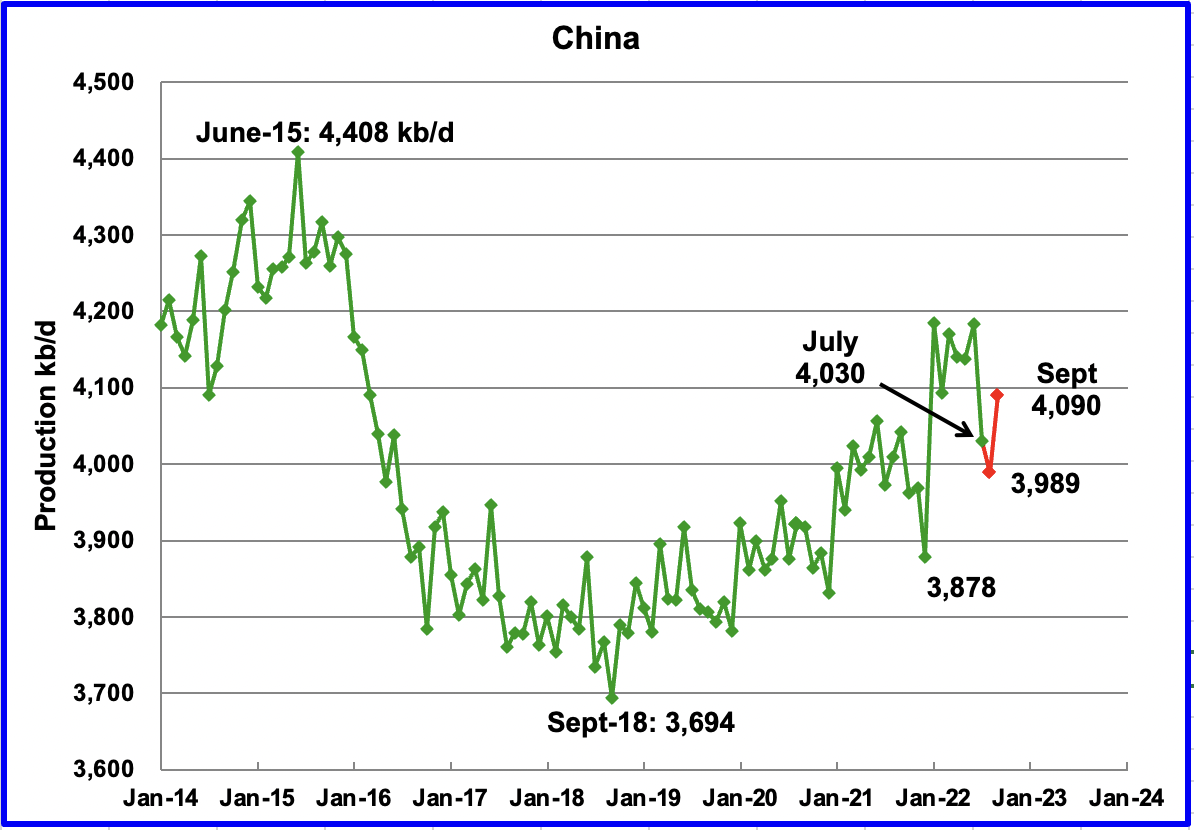
The EIA reported China’s output decreased by 153 kb/d to 4,030 kb/d in July.
China reported that its output decreased again in August to 3,989 kb/d, a drop of 45 kb/d. (Red markers). September added 101 kb/d.
China may be close to its current maximum production level of approximately 4,000 kb/d to 4,200 kb/d. To offset declines, the national oil company is investing in conventional wells and is also drilling for shale oil.
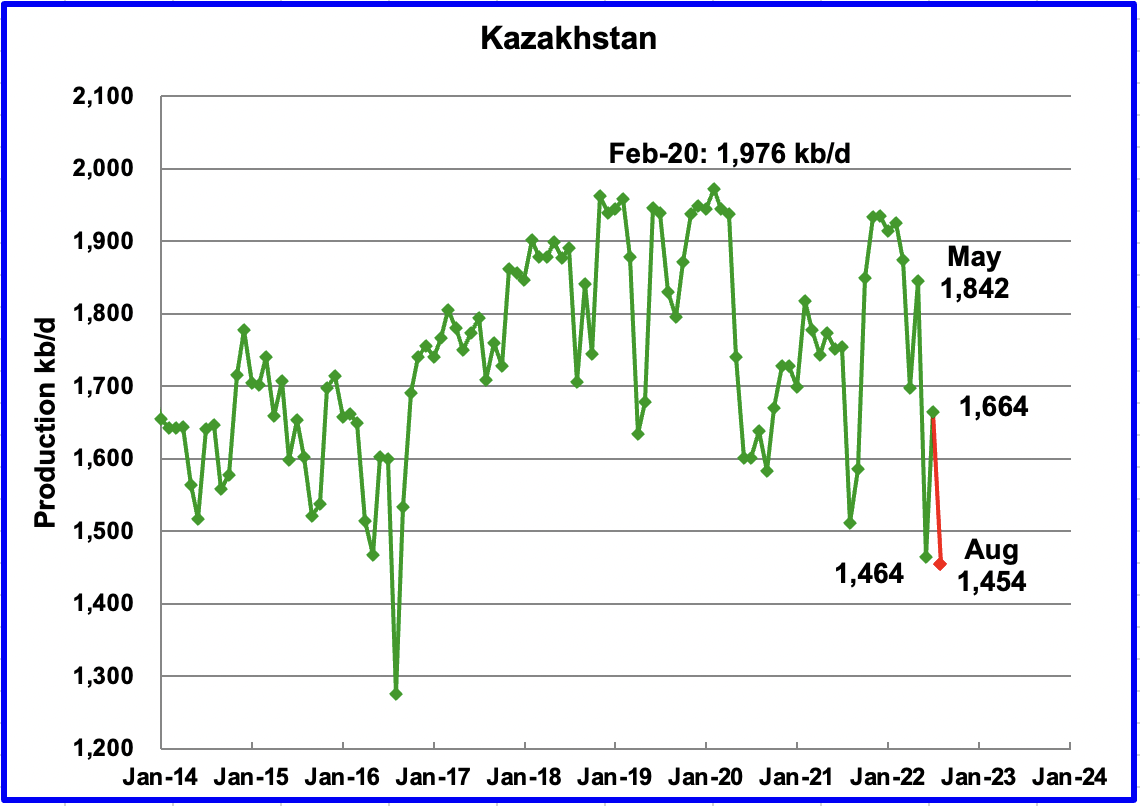
Kazakhstan’s output increased by 200 kb/d in July to 1,664 kb/d.
According to this source, August production fell to 1,454 kb/d. The article just reports crude oil production. Consequently the August production number shown in the chart is an estimate based on the percentage drop and a typical C + C to C ratio using earlier EIA data.
“The fall in output was due to a sharp decline in production in the giant Kashagan oil field after a gas leak early in August, as well as planned output curbs in the Tengiz field due to regular maintenance.”
According the this source, “production at Kashagan, one of the world’s largest oil fields, sharply declined on Aug. 3 due to a gas release. Kashagan had planned to boost output to 500,000 bpd after upgrades.”
Production is expected to recover in October.
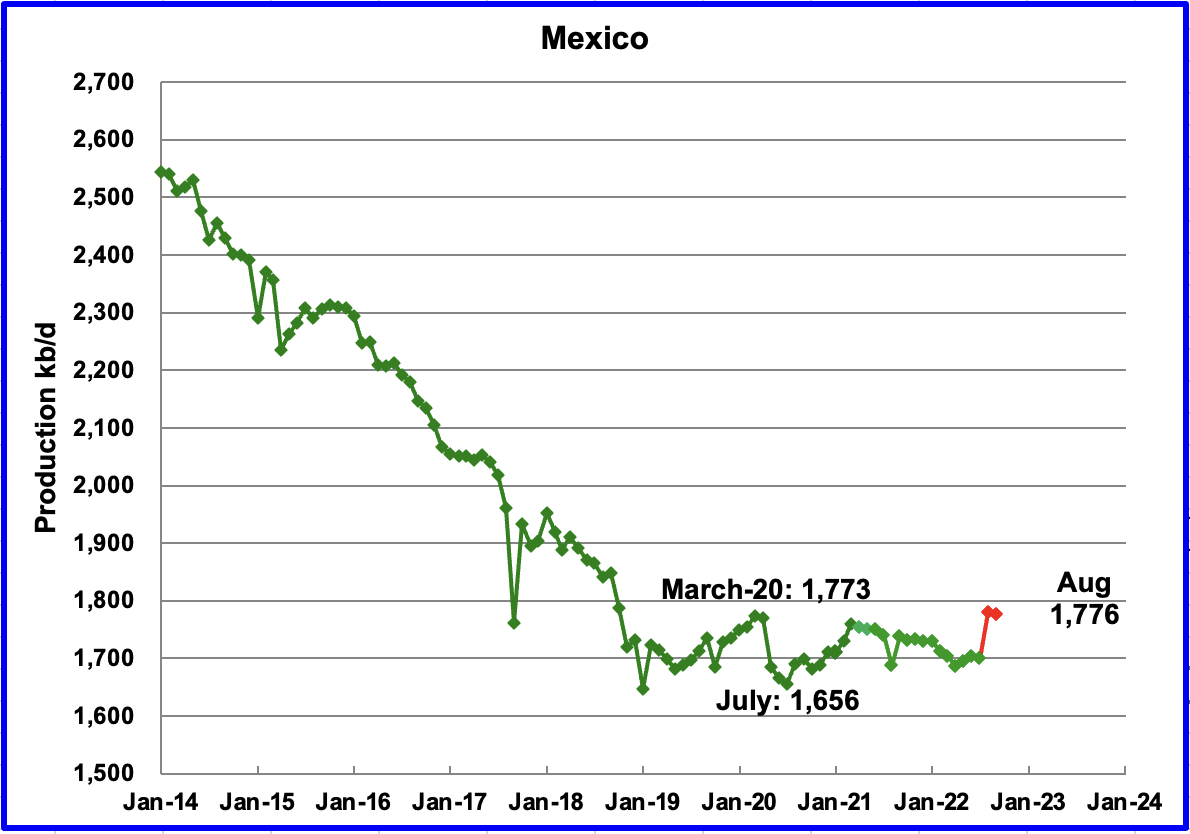
Mexico’s production as reported by the EIA for July decreased by 3 kb/d to 1,700 kb/d.
Data from Pemex showed that August’s output was 1,779 kb/d and September was 1776 kb/d. However, the EIA is expected to reduce Pemex’s August and September oil production by close to 85 to 90 kb/d due to a difference in definition for condensate.
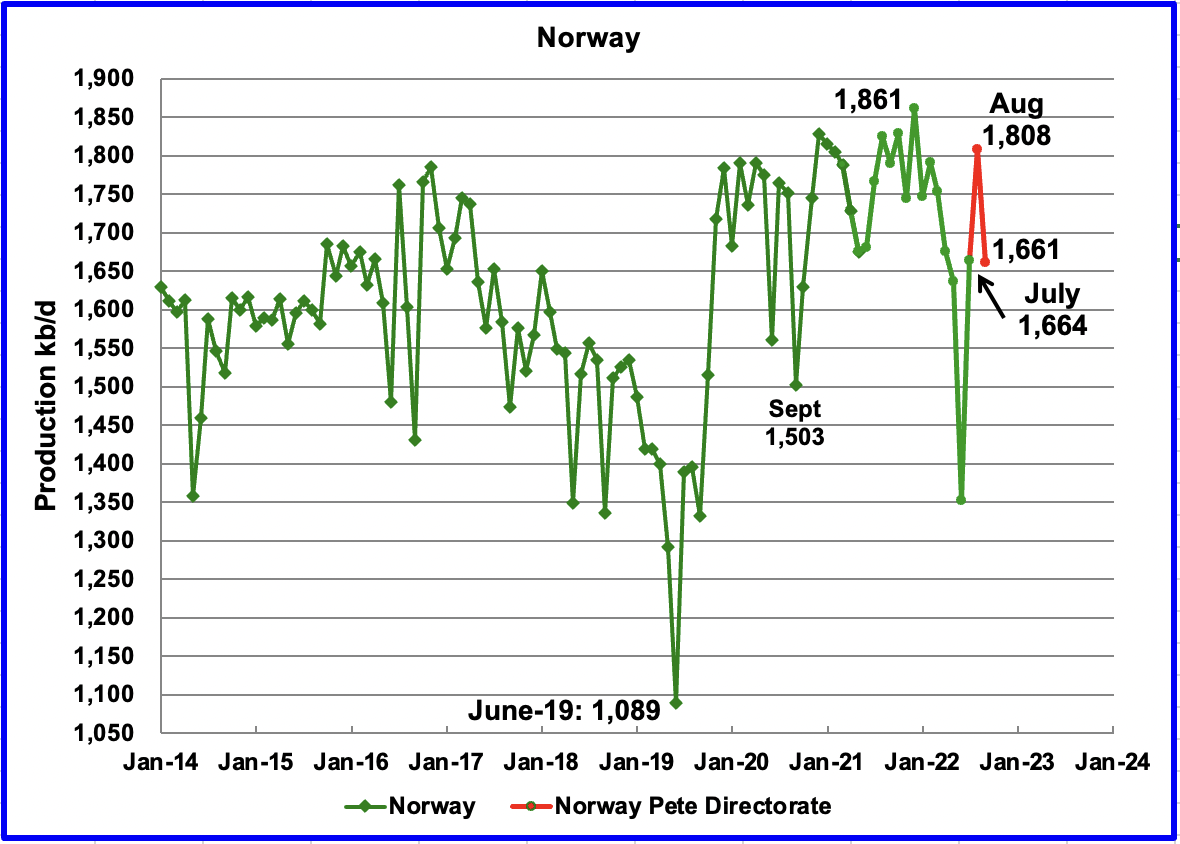
The EIA reported that Norway’s July production increased by 312 kb/d to 1,664 kb/d.
The Norway Petroleum Directorate (NPD) reported that production increased from July to August to 1,808 kb/d (Red markers). According to the NPD: “Oil production in August was 3.1 percent lower than the NPD’s forecast and 4.7 percent lower than the forecast so far this year.” September output dropped to 1,661 kb/d.
Growth is expected in late 2022 and into 2023 when the second phase of the Johan Sverdrup field development starts production and other small fields come on line. According to OPEC “The Johan Sverdrup is projected to be the main source of increased output for the year. Neptune has also completed drilling at Fenja with the first oil on track for 1Q23. Fenja is expected to produce about 24 tb/d at peak production.”
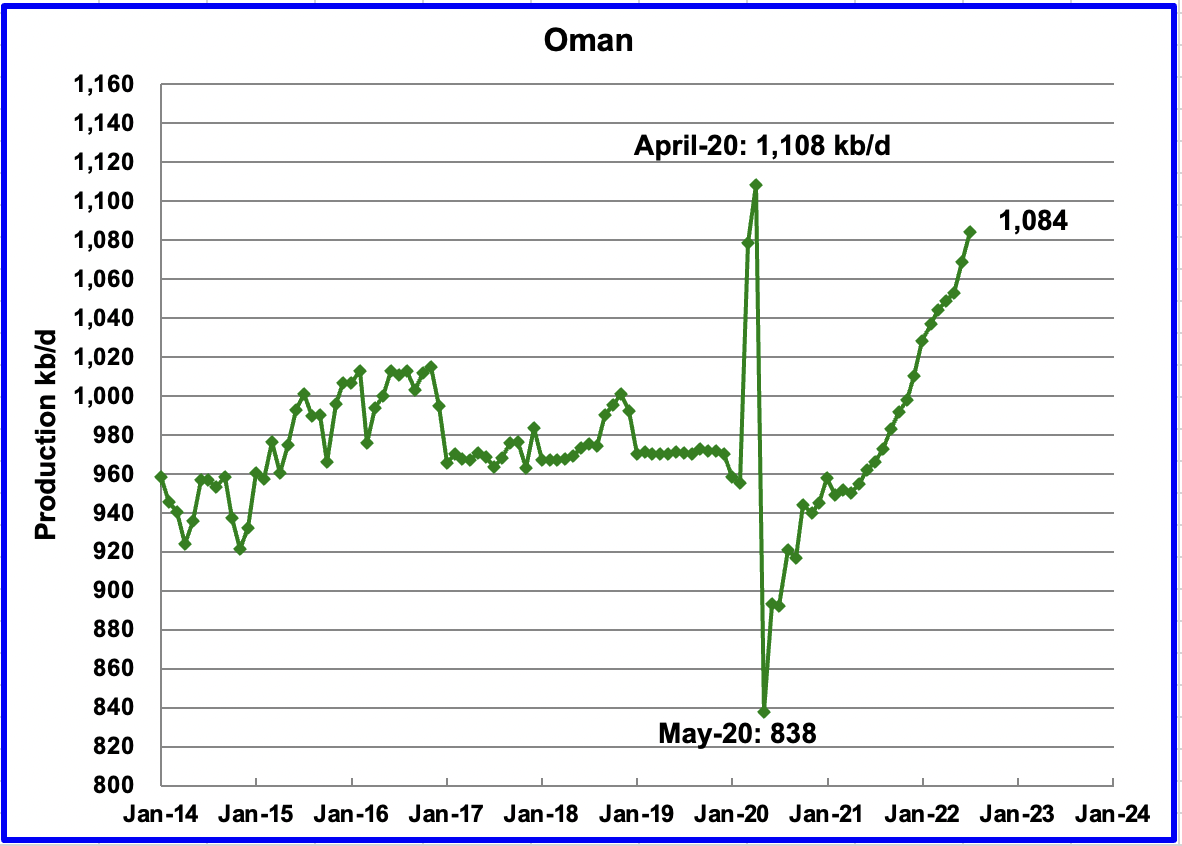
Oman’s production has risen very consistently since the low of May 2020. Oman’s July production increased by 15 kb/d to 1,084 kb/d. It is 24 kb/d short of its pre-pandemic high.
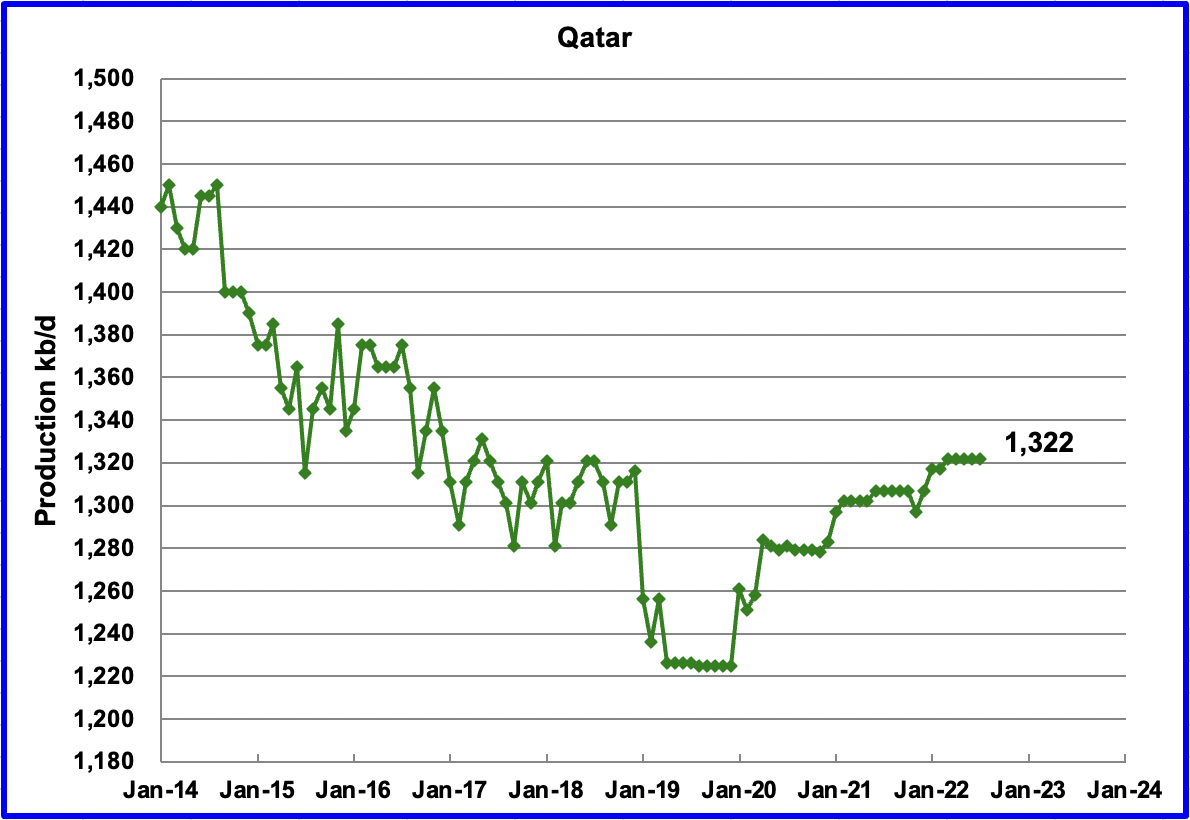
July’s output was unchanged at 1,322 kb/d.
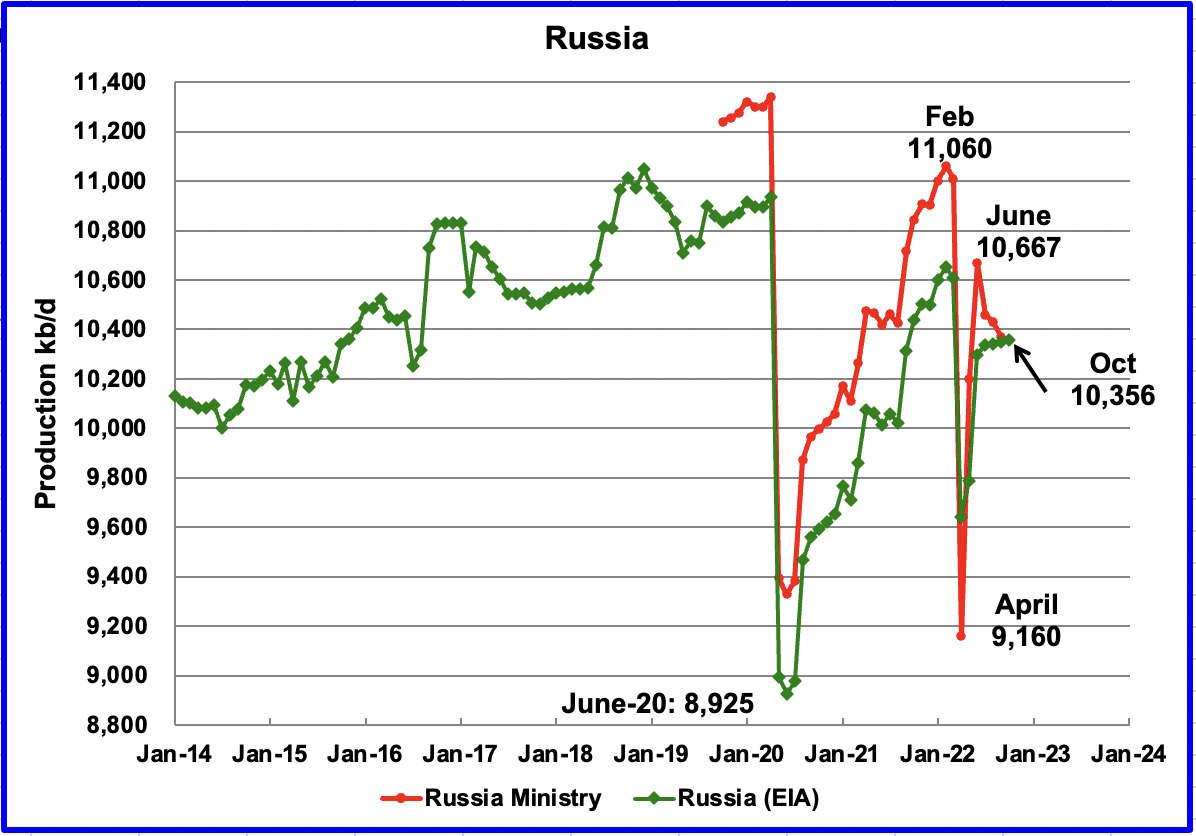
The EIA reported that Russian output increased by 38 kb/d in July to 10,336 kb/d.
According to this source, “Citing anonymous data, Kommersant said that Russia’s October oil production has been at 1.47 million tonnes of oil per day, which equates to 10.78 million barrels per day (bpd), down from September’s 10.8 million bpd reported by Russian statistics agency Rosstat last week.”
It is not clear if the above output is C + C or all liquids.
Another source provides a different perspective to the data provided above. According to this source:
“MOSCOW – Russian oil production stood at 9.9 million barrels per day in October, Russian Deputy Prime Minister Alexander Novak said on Tuesday, according to Interfax news agency, well below the country’s quota within the OPEC+ deal.
That was in line with his previous forecast and production in September, but below Russia’s quota of 11 million bpd under the OPEC+ global accord.
The quota is set to fall to 10.5 million bpd from November, in accordance with the OPEC+ agreement.
The data excludes gas condensate, a type of light oil which usually accounts for some 8% of crude oil and gas condensate production.“
Note that the reported data excludes gas condensate. If the missing 8%, as noted in the article, is added to the crude to account for the missing condensate, C + C would be 10,760 kb/d. This is very close to the previous source and makes it more likely that the previous output of 10,780 kb/d is really C + C, the Russia version. The EIA removes 404 kb/d from the Russian production numbers. So the EIA October estimate would be 10,356 kb/d, which is essentially the same as the July output shown in the chart. Note that the intermediate August and September numbers are linear interpolations.
Note that the red and green graphs are separated by 404 kb/d up to July 2022. When the EIA August Russian production is published, we will have a better idea if the earlier released Russian August data was all liquids, as previously assumed, or Russian C + C.
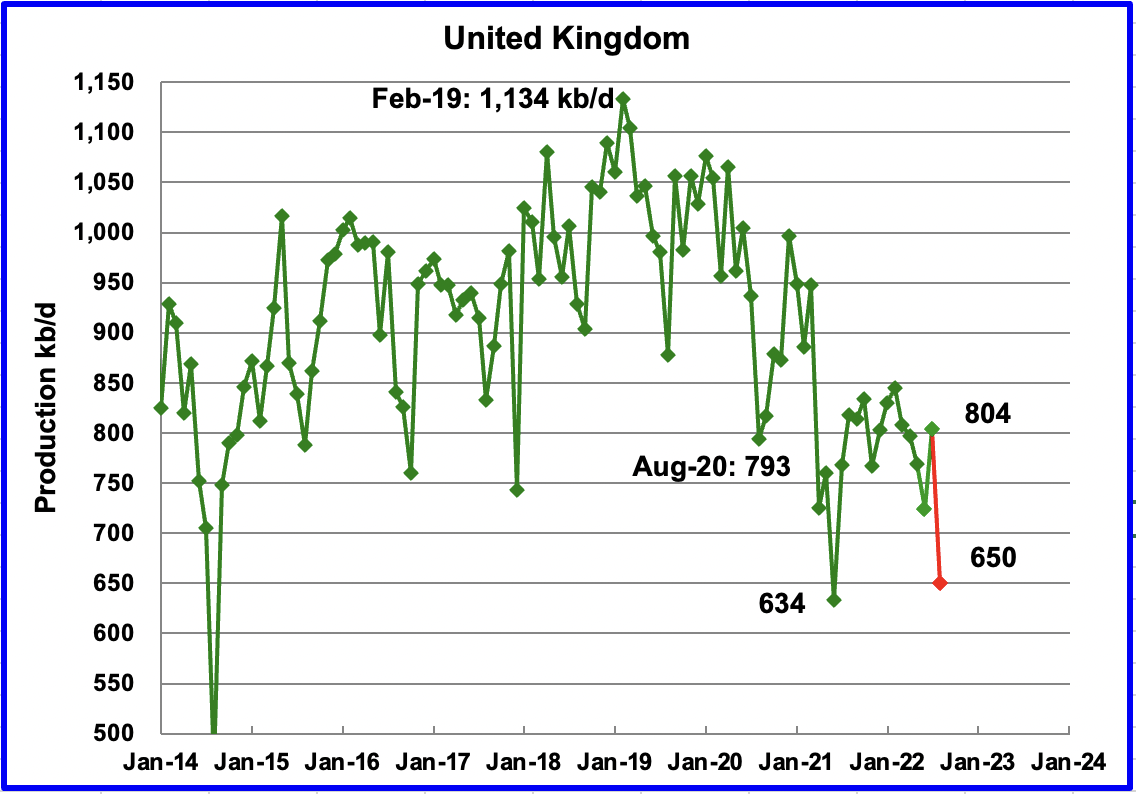
The EIA reported UK’s production increased by 80 kb/d in July to 804 kb/d. According to this source, August’s production decreased by close to 154 kb/d to 650 kb/d (Red Marker). Note that approximately 10% was added to the reported crude output to account for the missing condensate.
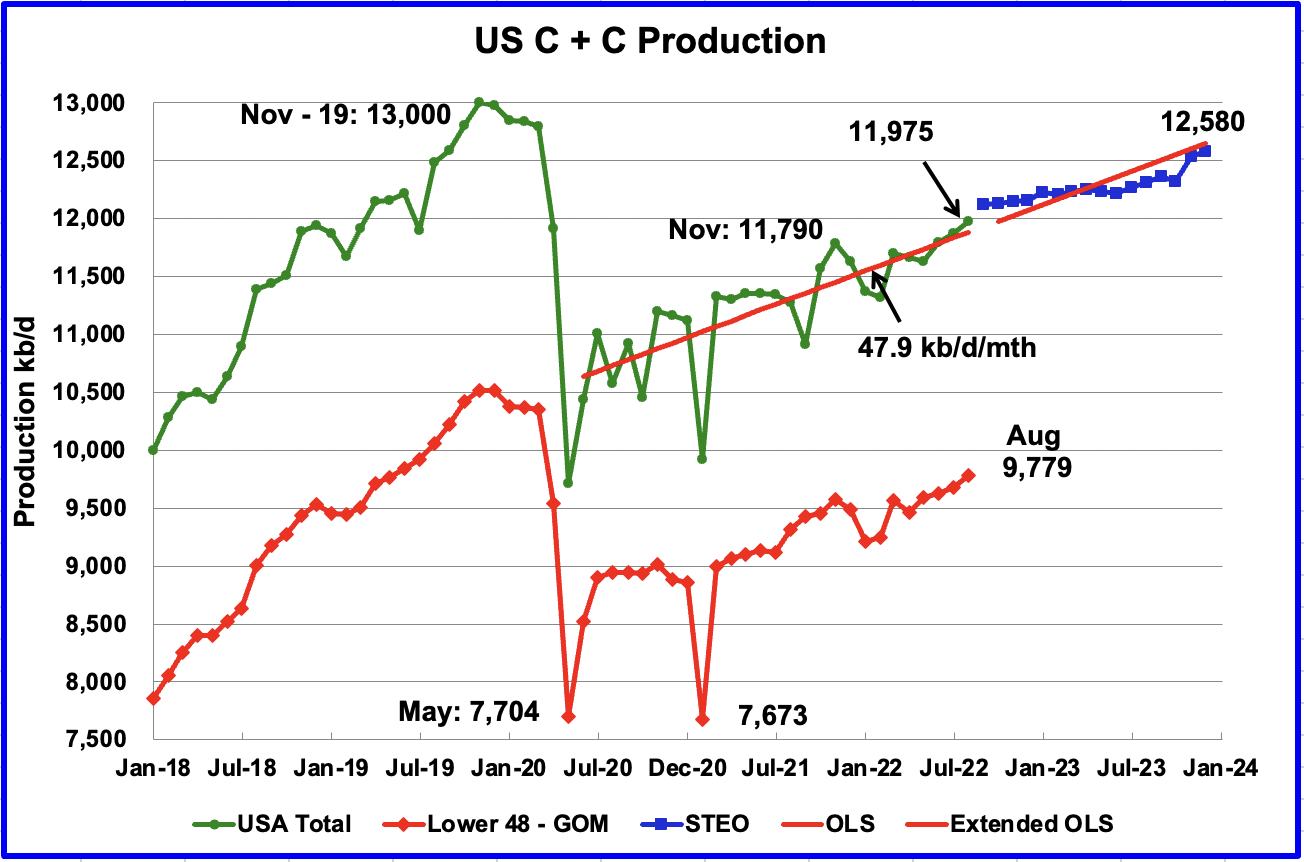
U.S. August production increased by 102 kb/d to 11,975 kb/d. While overall US oil production increased, a clearer indication of the health of US production can be gleaned by looking more closely at the Onshore L48 states. In the Onshore L48, August production increased by 100 kb/d to 9,779 kb/d. This means that all of the increase in US production came from the Onshore L48.
The blue graph, taken from the November 2022 STEO, is the production forecast for the U.S. from September 2022 to December 2023. Output for December 2023 is expected to be 12,580 kb/d, 21 kb/d lower than reported in the previous post.
The red OLS line from June 2020 to August 2022 indicates a monthly production increase of 47.9 kb/d/mth over that period. The first portion of red line stops at August because that is the range covered by the OLS analysis. The second portion is the same OLS line extended to see how well it fits the STEO forecast.
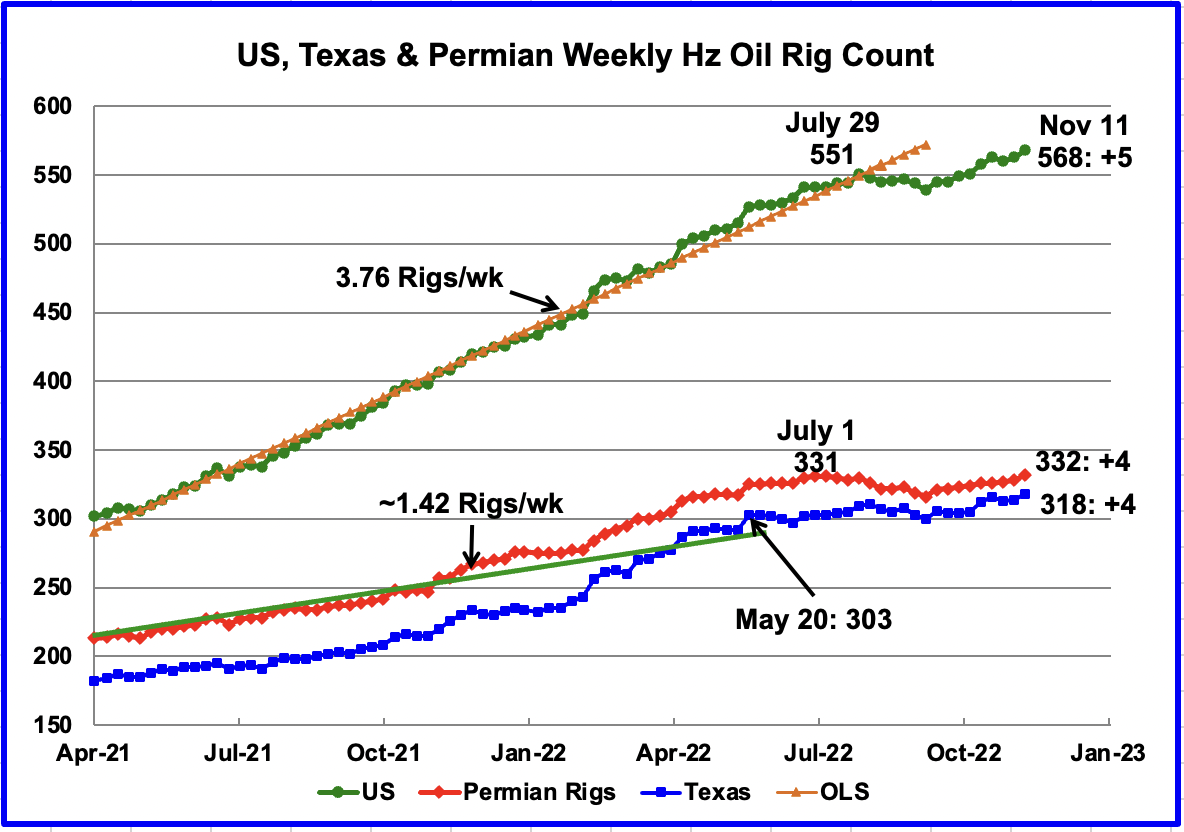
After the week ending July 29, the rate of rig additions slowed and dropped for eight weeks. However since the low of 539 in the week of September 9, rig growth has returned. From the week ending September 9 to November 11, 29 rigs have been added for an average rate of 3.2 rigs per week.
In the week ending November 11, total Hz rigs increased by five, with 4 going to the Texas Permian.
New Mexico rigs have been steady at 97 for the last three weeks and are down from 105 in July. Is this an indication that drilling interest is shifting back to the Texas Permian?
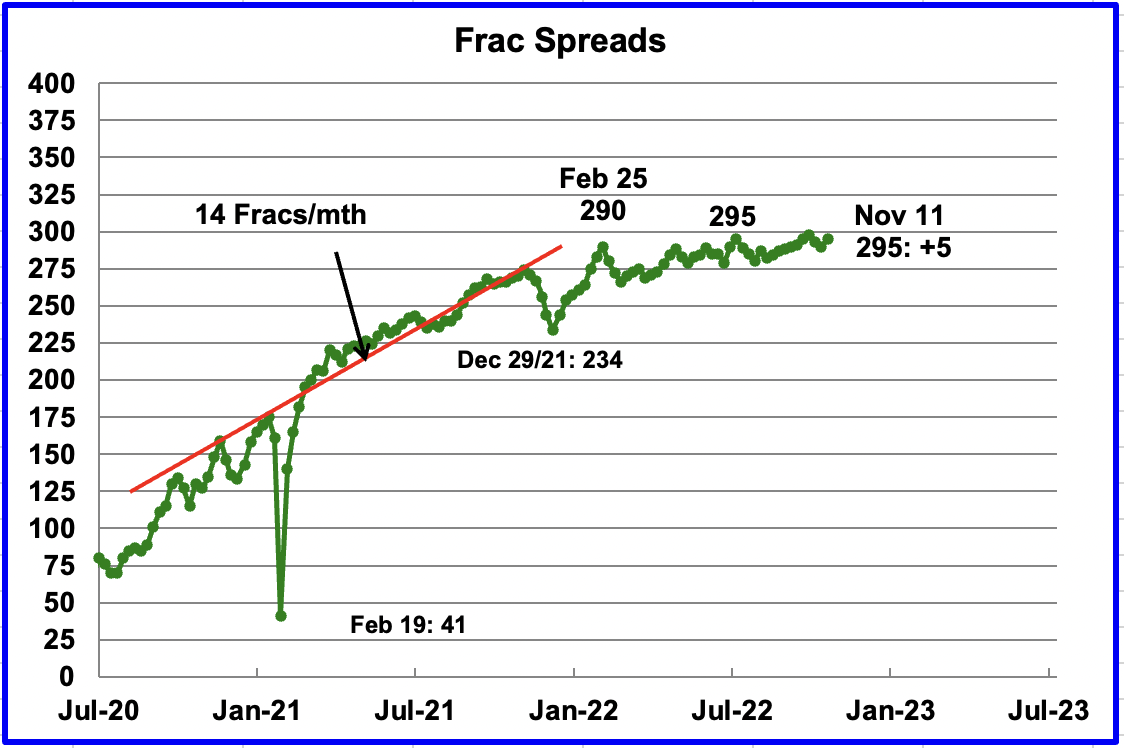
For frac spreads, the general trend since late February, when the count was 290, can best be described as essentially flat at around the 290 level. For the week ending November 11, the frac spread count increased by 5 to 295.
Last year the frac count peaked in mid November and then headed into the Thanks giving and Christmas break the low of 234 in December 2021. So is this week’s count the beginning of another drop into December?
Note that these 295 frac spreads include both gas and oil spreads.
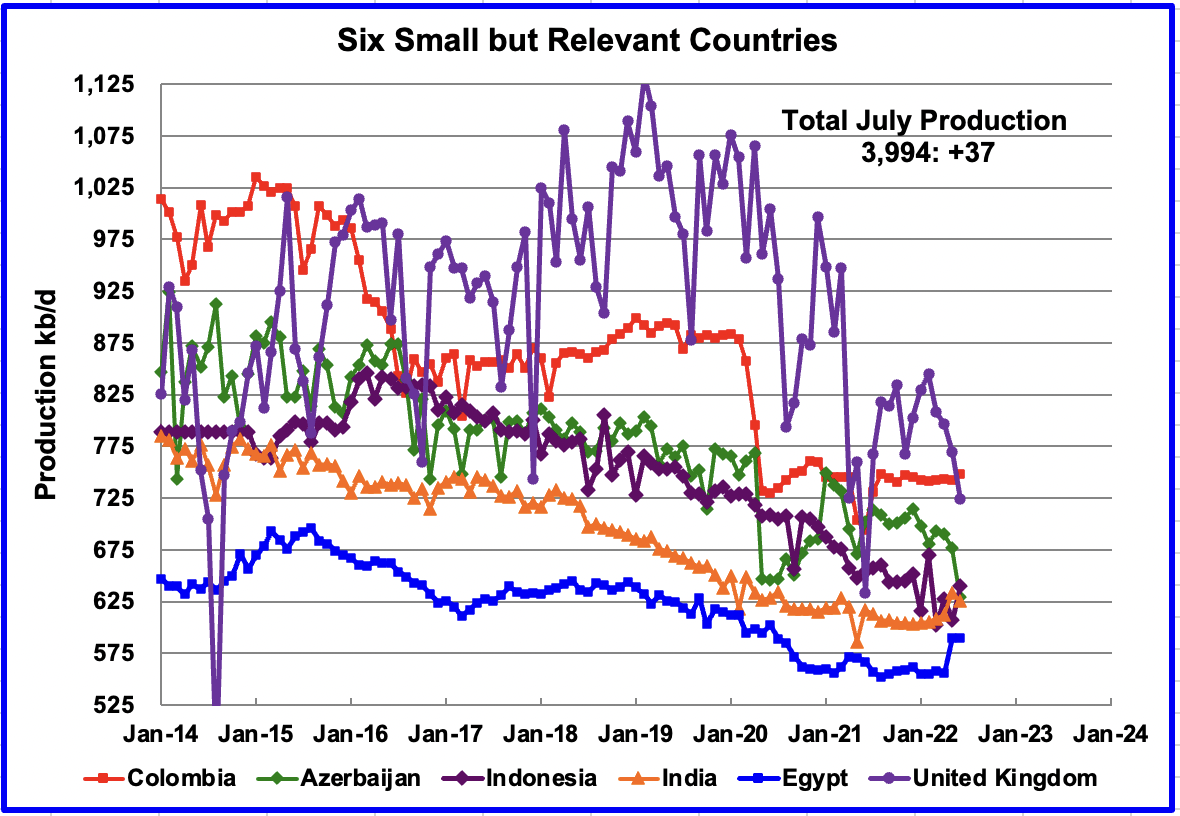
These six countries complete the list of Non-OPEC countries with annual production between 500 kb/d and 1,000 kb/d. Note that the UK has been added to this list since its production has been below 1,000 kb/d since 2020.
Their combined July production was 3,994 kb/d, up 37 kb/d from June’s 3,957 kb/d.
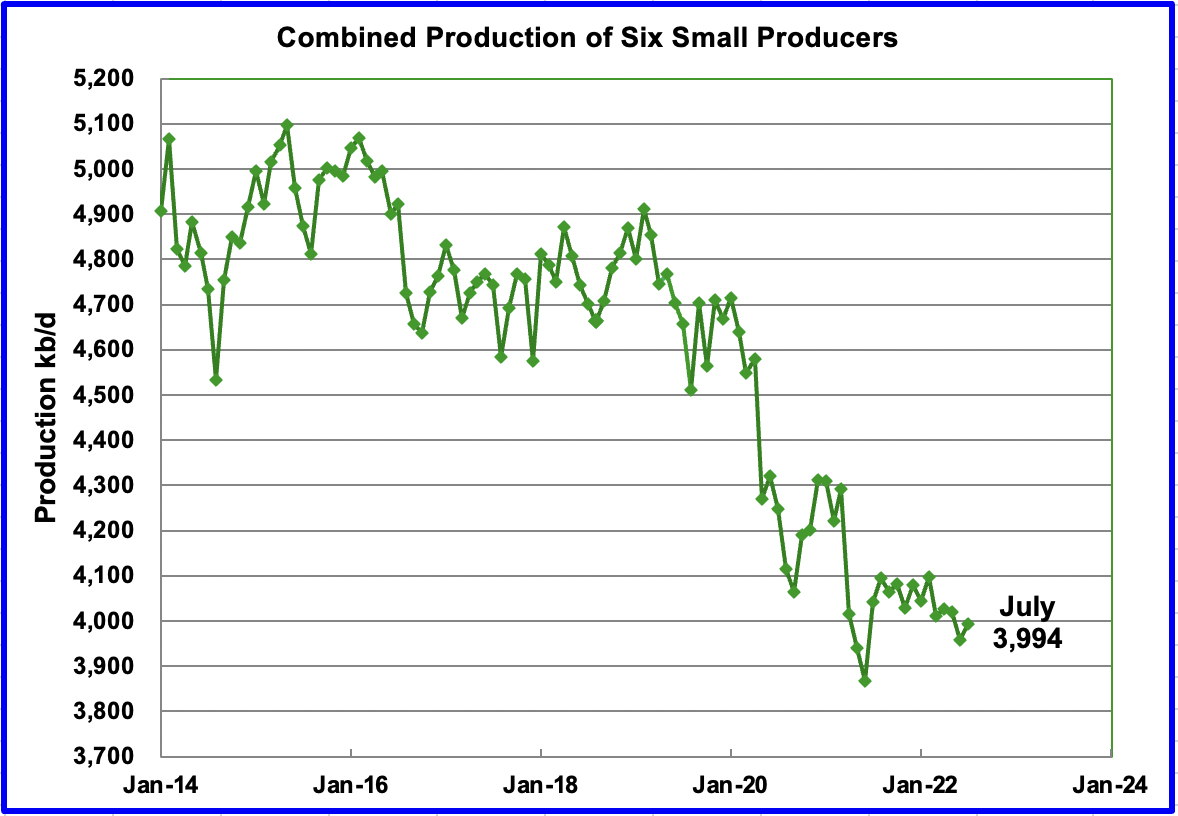
The overall output from the above six countries has been in a slow steady decline since 2014 and the decline continues.
World Oil Production Ranked by Country
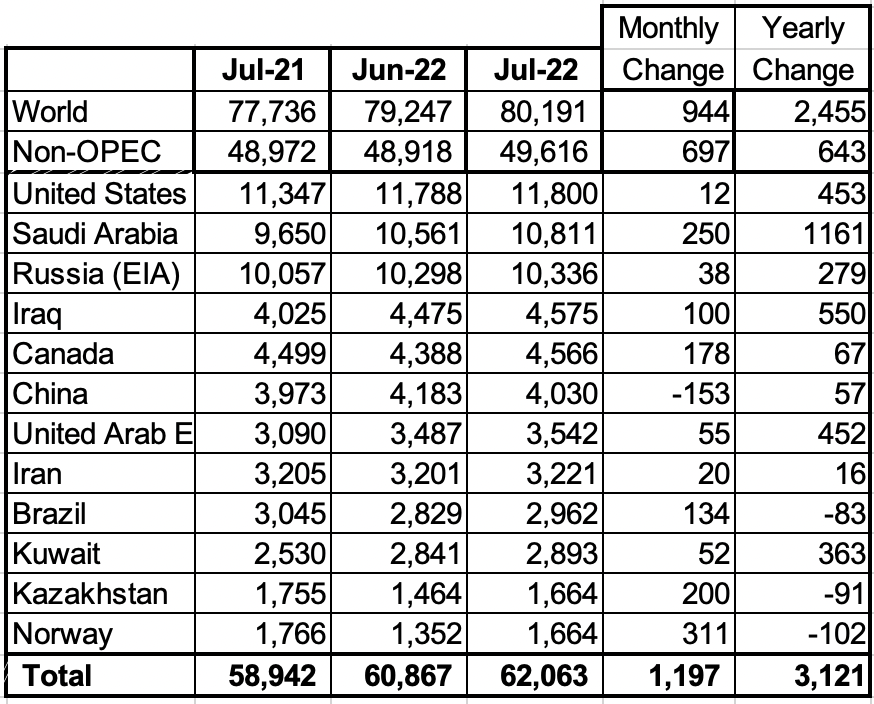
Above are listed the World’s 12th largest oil producers. The list has been expanded by one this month because Norway and Kazakhstan are tied.
In July 2022, these 12 countries produced 77.4% of the world’s oil. On a YoY basis, production from these 12 countries increased by 3,121 kb/d. Note that every country except China increase production in July.
The three largest increases came from Norway 311 kb/d. Saudi Arabia 250 kb/d and Kazakhstan 200 kb/d. Both Norway and Kazakhstan were recovering from maintenance.
World Oil Production Projection
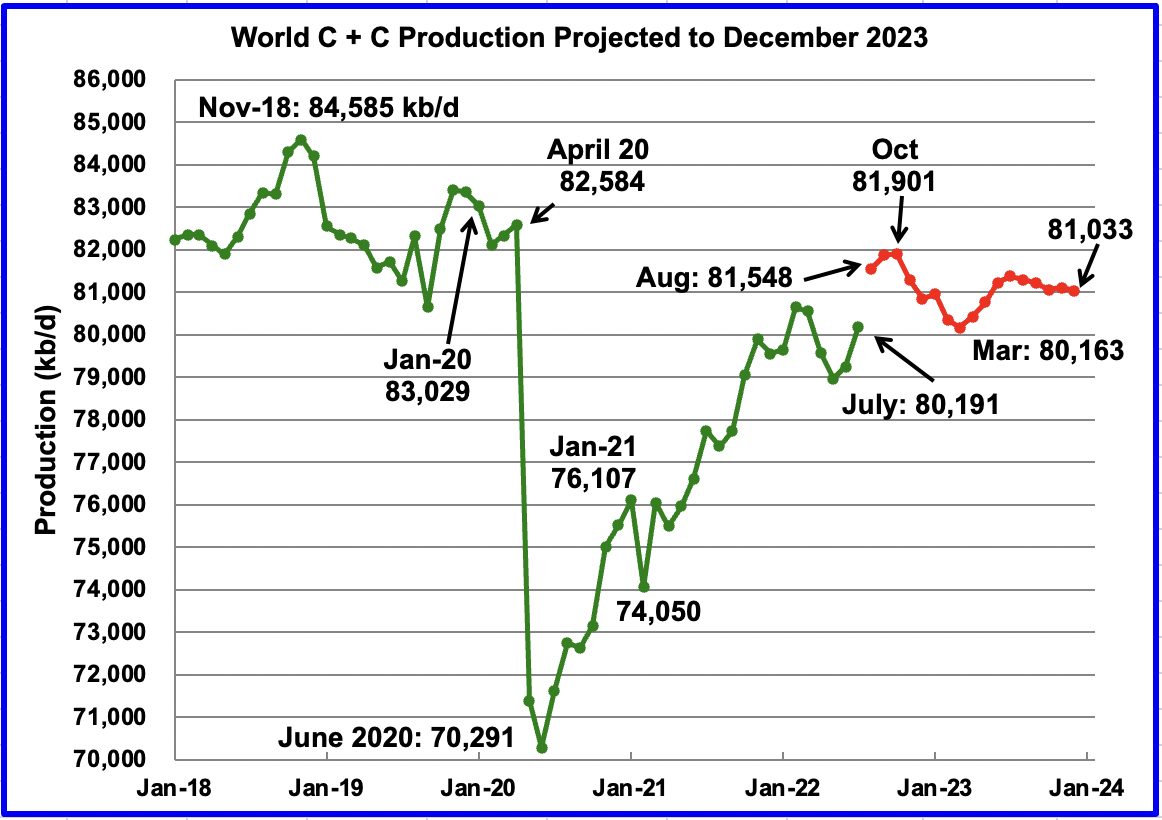
World oil production in July increased by 944 kb/d to 80,191 kb/d according to the EIA (Green graph).
This chart also projects World C + C production out to December 2023. It uses the November 2022 STEO report along with the International Energy Statistics to make the projection. (Red markers).
It projects that World crude production in December 2023 will be 81,033 kb/d, an increase of 207 kb/d from the projection in the October report.
August production is expected to increase by 1,357 kb/d to 81,548 kb/d. A post pandemic peak of 81,901 kb/d will be reached somewhere in September/October 2022. After October 2022, World production decreases and October 2022 will be the new post-pandemic high out to December 2023.
Note that the post pandemic peak of 81,901 kb/d is 2,684 kb/d lower than November 2018.
120 responses to “July Non-OPEC Oil Production Hits Post Pandemic High”
Great post Ovi, thanks. I doubt that World C+C will reach 81,901 Kbp/d in October, but it is possible. What is not possible is where the EIA expects C+C production to average in 2003. I think they have it about a million barrels per day too high.
Ron
Thanks.
The October OPEC report shows OPEC production increasing by 800 kb/d from July to September. October will be close to September in terms of production since the overall commitment is only 100 kb/d lower.
I think the US will add about 300 kb/d by October. I expect 200 kb/d from Brazil, looking at the Brazil chart and about 100 kb/d from Canada. Kazakhstan is supposed to get back to where it was in May. That would add another 400 kb/d. Guyana could add another 100 kb/d.
The unknown here is Russia. How much will it be down by October. According to the Russia chart, their production will be the same as July, flat.
So I think that forecast is not too far off.
OPEC and Russia will start their cut backs in November. So I think that September/October will be the Post pandemic high and it could be a bit lower than shown in the chart.
https://www.texasmonthly.com/news-politics/texas-oilman-digs-last-well/
Congrats on an amazing career to Mike Shellman!!
Thanks, Peak Avocado, for posting this. Here is the link again with an idea of what it’s all about. I changed thtle a bit. Hope no one minds. And yes, congratulations, Mike.
After a Lifetime of Drilling, Mike Shellman Digs One Final Well
Great article. Everyone should read it.
Awesome Mike! Congratulations on your career!
Mike,
Enjoy your retirement. Congrats.
Keep drilling seems to go beyond oil. Is it hope, or disparity?
That’s a great article. Congratulations Mr. Shellman.
Gentlemen, you are very kind, thank you. After all these years I still don’t understand it all. It’s dark down there, and hard to see.
Mr. Hout, drilling oil and gas well, is how I fed my family all these years, and the families of my employees, those that I loved and felt responsible for. It was hardly “disparity” whatever that means; it was an honor. Clearly it would be a mistake to ask you to understand that.
Mike.
I know so much about you from the fact that you have drilled so many wells as a small independent. You never stop moving do you?
We have drilled a small fraction of what you have, and we were not hands on like you. Every time we drilled a well it seemed like it was an all consuming endeavor. So many different things involved from beginning to end.
And as you say, it’s dark down there, and although you think you know what’s going on down there, you can never be certain.
It’s also very hard to truly understand the financial risk involved in drilling wells unless you have actually done it with your own money. You risk more on one well than most people earn in a year, even on the shallow wells like you drill.
I can’t thank you enough for all that you have shared with me about your decades in the oilfield and your wealth of knowledge regarding its history.
I hope in 2023 you will find time to write more historical articles. There isn’t anything else out there like what you write. As soon as I receive one I read it the first chance I get.
Thanks for reposting old articles. I read them all again.
If you ever get the chance, please read Bulletin No. 22 written by Raymond S. Blatchley, He was with the Geological Survey and rode through our field and the one in the county to our South on horseback during the summers of 1908-1911. The record he made is truly something to behold, and it is still referred to by operators here today, over 110 years later.
Take care friend!
Shallow, it took five or so minutes out of your busy life to write that; it means a lot to me, thank you.
The dye is cast for US tight oil; I’ve changed lots of peoples minds about coming Wolfcamp scarcity in the Permian and how short sighted it is to be exporting the last of our nations hydrocarbon resources below the price of other world oil postings, using debt to do so, while wasting its associated gas. Because we can’t use it all right now does NOT mean we won’t desperately need it in the future. We will. I’ve done the best I can at all that and am petty much done with it now.
So yes, I am downsizing my office, getting some interest in a screen play I’ve written about an oil well torpedo shooter/oil well firefighter murdered in Amarillo in 1941, and have lots of history I wish to write about, including the IB. I hope you enjoy the series about Mexico’s early oil history and thank you for being a good friend over the years. We clearly share a mutual respect for our industry and its unique history. I am grateful for that.
Mike and Shallow Sand,
I wish both of you all the best, thank you for sharing your knowledge here at peakoilbarrel.com.
I agree it is bad practice to be flaring or venting natural gas.
My thinking is that demand for oil will peak by 2028 and by 2030 oil prices will be falling. Tight oil not produced before 2033 and new tight oil wells not completed before 2031 are not likely to be economically viable. Tight oil that remains behind will be there for many generations. That would be good for the environment, maybe not great for tight oil producers though.
Scenario below assumes oil prices start to fall in 2030 due to lack of oil demand and in addition that an export ban on crude oil is instituted in the US starting in December 2022. Leaves about 30 Gb of tight oil in the ground that would have otherwise been produced and exported. Also I assume that no new refinery capacity for tight oil is built in the US in this scenario.
If tight oil actually followed this scenario, oil prices would remain very high at least until 2030 as the World is not expecting that tight oil will be decreasing as shown here, the expectation is that US tight oil output will increase to about 10 Mb/d by 2030 rather than about 4 Mb/d as shown in this scenario, so about 6 Mb/d would be missing from most current forecasts and on crude oil markets worldwide there would be a significant shortage of oil.
The very high oil prices (likely $200/bo by the end of 2023) that would result might speed the transition to alternatives to oil for transport, but things would be chaotic.
Dennis
If the administration would institute an export ban, that would complicate things for the refiners.
Wouldn’t the refiners just point out that the US is a net importer and that they are just swapping a lower grade crude for a better grade that is more appropriate for their refineries.
I keep hearing on the news that the GOP claims they are going to force Biden to get back to energy independence. Not sure if GOP politicians know the difference between energy independence and oil independence.
Maybe it’s all good politics now that they have the House wrapped up.
I can agree with your chart Dennis, but all due to geology, not politics.
Ovi,
US refineries can only handle about 4200 kb/d of tight oil, the rest is exported. An export ban would be a problem for tight oil producers, not refiners. Also the executive branch cannot do this without a bill passed in the House and Senate, so this is something that would require majorities in both houses of the legislature as well as a Presidential signature (no veto by the White House). My guess is the odds are quite low that such a bill would pass in the US legislature, so the premise of the scenario is not all that realistic in my view.
Ron,
Output decreases in this scenario because tight oil producers reduce their completion rate because they can no longer find buyers for their oil, tight oil producers choose to reduce output to 4200 kb/d because they can no longer export their oil and under the assumptions of the scenario, refiners choose not to refit their refineries to handle more tight oil as this is expensive to do and they do not see it as a profitable investment.
Yeah, I knew that was your opinion Dennis, you stated as much in that post with the chart. I was just saying I could agree with it beccause of geology. You realize tha geology has a lot to do with whether a driller decides whether to drill another well or not. They know they will get more oil, but will they get enough oil to make it profitable?
Yes Ron,
The wells will be very profitable at current oil prices, the scenario assumes oil prices remain at $100/bo until 2030 and then drop. Without a ban on US crude exports, my model predicts about 65 Gb ERR for US tight oil if oil prices remain at $100/b or higher from 2023 to 2030 with NGL at 35% of crude price and natural gas at $5/MCF or higher.
With an export ban, I expect tight oil falls to 4100 kb/d by 2025 and remains at about that level until oil prices start to fall in 2030, without the export ban tight oil production would reach 10750 kb/d by 2028 so we have about 6650 kb/d missing from the World oil market in 2028 under a crude export ban scenario and also the US tight oil URR falls to 45 Gb, so we produce 20 billion fewer barrels of tight oil. I expect oil prices will be considerably higher on World markets with a US crude export ban, so tight oil will be more profitable under that scenario, perhaps enough to make it so the 20 Gb not produced will not hurt the oil producers, I have not run those numbers and I do not have a prediction for how much oil prices would rise ($150/bo does not seem unreasonable for the crude export ban scenario.) Revised scenario below with completion rate for all US tight oil basins on right axis. Click on chart for larger view.
Three comments on why reducing, or eliminating entirely, US tight oil exports will benefit the American consumer, the rest of the domestic oil industry in the US and even the US tight oil industry itself, all of which helps ensure long term supply and long term energy security for our country.
Conjecture about renewable’s affect on oil demand, oil prices and stranding tight oil resources forever is far too big a risk to now be draining America dry of its last hydrocarbon resources, using debt, while wasting its associated gas…for the sake of exports. Savings accounts are a good thing.
Oil exports WILL cease in America, sooner than people think, and it won’t have anything to do with politics or available capital. As Mr. Patterson implies, oil exports will cease when an already very tired Mother Nature decides she has no more affordable, economically recoverable oil and gas to give.
https://www.oilystuffblog.com/forumstuff/forum-stuff/us-oil-exports-will-prove-a-big-mistake
Mike,
Of course exports will stop and I agree wasting associated gas is stupid, state regulatory agencies should not allow that in my opinion.
Perhaps tight oil producers will be better off if they produce less, I contend that it should be left to them to decide and not the government, many conservatives would agree that minimizing government interference in the economy is a good thing.
As to conjecture about demand for oil falling in the future consider the following scenarios from the IEA World Energy Outlook 2022. My guess is something between the APS (Announced Pledges Scenario) and NZE (Net Zero Emissions) scenario see chart below from page 327 of Chapter 7 of the IEA report.
Without an export ban, tight oil exports would likely stop by 2034 as tight oil output falls to less than 4100 kb/d by Jan 2034 in my scenario with no crude export ban (tight oil ERR in that case is 65 Gb) peak is 10.7 Mb/d in 2027/2028, with tight oil output falling rapidly over the next 6 years (by about 6.6 Mb/d over that 6 year period).
Mike,
I wish you all the best!
I want to be sure you are aware of Brandon Seal’s podcasts on the Mexican Oil Industry and PEMEX. I think you would enjoy the series. He is out of San Antonio and worked in MX.
Jv
Mr. YX you are very kind, sir. I am in fact muddling, slowly, thru Brandon’s latest book written in Spanish. I was unaware of his podcasts however. Thank you.
I trust you felt this one in the bottom of your boots. I did.
https://www.oilystuffblog.com/forumstuff/forum-stuff/alas-the-sacrifices-texas-makes-for-singapore
Rystad projection on Lower 48
That’s an usual pattern with EIA.
Yes and it has been lowered quite a bit over the last three months
Jean-Francois,
It is a Rystad projection, not EIA. It is likely a function of a change in the future oil price forecast in their model as central banks raised interest rates increasing the odds of a recession.
Permian horizontal oil rigs wth OLS trend line based on April 1, 2021 to Dec 3, 2021 extended to Nov 10, 2022. It looks like the past two months has been a return to the earlier trend of a 1.41 rig per week increase (about a 73 rig per year annual rate of increase). For 2019 the average number of rigs operating was about 405 horizontal oil rigs in the Permian basin, the most recent number was 332 rigs, so if the 73 rig increase per year continues, we would be back to the 2019 rate by Nov 2023 (332 73=405 horizontal oil rigs).
Of course the future rate of horizontal oil rig increase is not known.
For chart below the blue marks represent the data used for the OLS trend line and the red marks are the rig count from Dec 2021 to November 2022 (data not used for trend line). If we had used all data from April 1, 2021 to Nov 10, 2022 the slope of the OLS trend line increases to 1.66 rigs per week (or 86 rigs per year).
US Frack spreads April 1, 2022 to November 11, 2022, annual rate of increase is about 31 per year (2.6 per month). The frack spread count averaged about 320 in February 2020 before the covid19 crash, so if frack spreads continue to increase at about 30 per year we would be at 325 frack spreads in November 2023.
Again we do not know the future number of operating frack spreads.
The horizontal axis in chart below is weeks from April 1, 2022.
At market close last week the inversion between the 3 month bill and 10 year bond was at about 30 basis points. Which is a huge inversion.
8 weeks bill is also now slightly inverted with the 10 year.
Bond market and Eurodollar market are pricing in a deflationary or disinflationary shock and lower interest rates.
I keep hearing oil prices will likely weather a recession ok. Judging by the inversion working it’s way up the yield curve we are likely to find out sooner as opposed to later if indeed oil prices can hold up in this recession.
“I keep hearing” Oh BaJesus, is this your Trump impersonation. He’s a looser you know. The tail doesn’t wag the dog. More often than not oil supply & demand in acts the Fed to change up interest rates. Then the other way around. What happened to your March $25 oil ? We’ll be lucky to see $75 oil this winter. Anything under that, Biden is going to buy it up and restock the shelf. Then most likely heading into the summer, you will see a new high over 2022. Oil supply, War and Covid logistics hangover is why the Fed are pumping the brakes. Recession, the labor market is growing in the states and there is still a shit load of cash sitting on the sidelines. High tech manufacturing is coming home.
Not going to respond to most of the nonsense I just read above. But I will say this. Just watch the short end of the yield curve. When the bills start falling faster than the long end. You’ll know market sets rates and FED follows by buying shit loads of bonds, notes, and bills. Otherwise known as QE. That are already in high demand because we are in recession and people want and need safe and liquid financial instruments.
Rate hike effects take up to a year to show up in real economy. Coincidentally March 2023 will be one year. And we will find out the FED has no clue what it is doing and way over tightened.
Damage is already done though and the ensuing rate cuts the FED makes will also take up to a year to effect real economy.
We will see the bottom in oil prices when we see a bottom in both growth and inflation.
Buckle up because growth and inflation are just now starting to slow.
What I can see here in collateral damage is real estate market. And this market is much too slow for the average stock market analyst and journalism.
It’s like a full oil tanker that still goes for miles and hours even when the engines are switched off.
The first half year not much happens since most projects have already logged in interest rates – but when things start slowing and slowing it will take much time to restart again.
Here calculation for commercial real estate was with 3% rent on the value – now they have to pay 4% interrest rate. So 1% loss per year, + costs. I think the real recession will be coming when the central banks have restarted QE already again.
The same with zombie companies – most still have their credits, or have to refinance small sums. With the time, pain will increase.
But oil is a special stuff. A developed country can work good with half the supply of concrete steel for 2 years, but not with half the supply of Diesel for 2 months (SPR left out). So prices here will fall last in a hard recession when the stuff is undersupplied – when it is well supplied we’ll see 25$ very fast. Speculation aside, on the physical markets the prices will shoot up when the supply is too low.
We’ve seen 40cents / KWH gas here in Europe this year, that’s the region that can be reached with oil, too, since it is a special stuff, together with food.
“You’ll know market sets rates and FED follows”
Your diarrhea continues. The FED tightens and the market follows. So much so, when the FED only speaks of it’s intentions with no action. It can influence retail interest rate markets. There is no better example of this than 2022.
“We will see the bottom in oil prices when we see a bottom in both growth and inflation.” “the FED has no clue what it is doing”
Just more diarrhea from 3H. The FED knows exactly what it is doing by rising interest rates and reversing QE. They are cooling demand to put it in line with available supply with their tools to curb inflation.
3H you are a back-seat driver
-a person who is eager to advise without responsibility.
EULENSPIEGEL- No surprise here seeing the real estate market first to see the down turn from rate increases. Most buyers are leveraged long term.
Huntington Beach,
You should take your meds and relax a little. And listen to what the hell i’m saying.
Did you know that the FED’s funds rate or the overnight rate which is the only interest rate that they control. It’s inverted with the 10 year bond right now.
Did you know the RRP rate. Which should be the floor of interest rates is like six basis points away from inverting with the 10 year.
Do you even know what the RRP is?
Reverse Repo rate. What the FED pays banks to park excess bank reserves at the FED.
And FED is still going forward with more rate hikes.
I don’t even expect you to comprehend what I talk about. Or get why oil prices are set to crash not skyrocket.
At this point you’d have to go back to 1980 to find a deeper inversion of 2s and 10s. But don’t worry, nothing big happened in 2008, or 2000, or 1990, or 1980 to 1982. I’m sure it will all be fine. I mean, crypto is certainly more stable than pets.com, right?
The Fed has a two-pronged mission, but Powell appeared less worried about maximum employment Friday. To that, he characterized the labor market as “particularly strong but … clearly out of balance,” with demand “sufficiently” outpacing supply.
Rather, the other prong — price stability (and its return) — served as a cornerstone of the speech, noting the FOMC’s “overarching focus” is to return inflation to the panel’s 2% goal.
“Without price stability, the economy does not work for anyone. In particular, without price stability, we will not achieve a sustained period of strong labor market conditions that benefit all,” Powell said. “The burdens of high inflation fall heaviest on those who are least able to bear them.”
https://www.wastedive.com/news/3-takeaways-federal-reserve-chair-jerome-powell-jackson-hole-inflation-price-stability/630700/
HHH- “the FED has no clue what it is doing”
Now remind me again your qualifications to make your statement HHH? And because you stayed at a Motel 6 last night and “keep hearing” things are not qualifications.
“Do you even know” a back-seat driver is a person who is eager to advise without responsibility
Huntington you sound like a raging lunatic every time you comment. You even invoke Trump in your comments. Who gives a damn about Trump? I sure as hell don’t.
Trump has become some weird ass phobia for some people it seems.
I advise you to keep reading everything I say. Oil prices are headed down 👇
And will likely take production down. Meaning peak was 2018.
Only because Trump uses the same basis less phrase “I keep hearing”.
“Jerome Hayden “Jay” Powell (born February 4, 1953) is an American attorney and investment banker who has served as the 16th chair of the Federal Reserve since 2018.
After earning a degree in politics from Princeton University in 1975 and a Juris Doctor from Georgetown University Law Center in 1979,[2] he moved to investment banking in 1984, and worked for several financial institutions, including as a partner of The Carlyle Group.[2] In 1992, Powell briefly served as under secretary of the Treasury for domestic finance under President George H. W. Bush. Powell left Carlyle Group in 2005 and founded Severn Capital Partners, a private investment firm. He was a visiting scholar at the Bipartisan Policy Center from 2010 to 2012, before returning to public service.[2]
He became a member of the Federal Reserve Board of Governors after being nominated to the post by President Barack Obama in 2012, and he was subsequently elevated to chairman by President Donald Trump, succeeding Janet Yellen in the position. Powell was renominated as chair by President Joe Biden on November 22, 2021.[3][4][5][6] Powell built his reputation in Washington during the Obama administration as a consensus-builder and problem-solver.[2]”
https://en.wikipedia.org/wiki/Jerome_Powell
Crude Oil WTI (NYM $/bbl) Front Month 11/14/22
Crude Oil Mar 2023- $83.59
https://www.wsj.com/market-data/quotes/futures/CRUDE OIL – ELECTRONIC/contracts
Looks like the market disagrees with your March $25 oil also.
“Now remind me again your qualifications”
Bonds markets are all in on interest rates going lower not higher. It appears stock markets are also betting on lower interest rates and QE.
Financial assets up. Real economy down. Oil down. Though as things break and layoffs rise in big numbers. Stocks will likely not be as bid as they are now.
So you’ll see dollar’s available for financial engineering at the expense of real economy.
“Now remind me again your qualifications”
You keep avoiding the question. “I keep hearing” your a homeless person posting from a free government cell phone and McDonald’s WiFi. That’s what “I keep hearing”. For sure you are no Jay Powell. What qualifications do you have to say “the FED has no clue what it is doing”?
You just post meaningless diarrhea
Oil is not going to $25 by March of 2023
Let’s see your Linkedin burger engineering reference
According to Alan Greenspan (in his memoirs) the Fed bases its decisions on interest rates on a system of (roughly) 1000 linear equations in 1000 variables. They feed these equations with data from the reserve banks in the 12 districts of the federal reserve system.
Because the Fed has a lot of fresh data and a complex model, their behavior is hard to predict. It certainly does not correlate well with any single variable.
Yes FED uses account metric models to explain what happens in the economy. Because they don’t have a clue what is actually happening in real economy and all they got are mathematical models.
Meanwhile the yield curve is screaming they have no idea whatsoever of what they are doing. Remember those who actually do money in real economy. Those who make all the loans are saying through the yield curve that the FED is clueless.
Keep posting HHH. I don’t know if you are right or you are wrong, but I appreciate the information you put out here.
Peak oil is not just about the global peak. C&C production in Australia has peaked 20 years ago. Several refineries closed due to peak oil. Fuel imports are very vulnerable to geopolitics like China’s threat to take Taiwan by force. Here is my post on this problem:
8/11/2022
Only 3-4 years to replace/save 45% of Australian diesel imports?
http://crudeoilpeak.info/only-3-4-years-to-replace-save-45-of-australian-diesel-imports
“Peak oil is not just about the global peak.”
This point cannot be overstated. The impacts at the country/farm/port/industry level is and will be much more profound than the global production chart indicates.
Instability starts on a local/regional level.
Sometimes it does not stay there.
Not so much gloom and doom.
Oil is about transportation – that’s all.
Transportation can be improved by doing it more efficient, intelligent or by other means than oil.
In Germany peak oil consumption was 1973! Since then we are in a downward spiral.
My fathers first car was a VW beetle, consuming 13 liters on 100 km while having a very noisy maximum speed of not much over 100 Kmh (and a permanent not working heating in winter). My current car uses 5 during a comfortable cruise speed on the Autobahn.
Energy alltogether is the big thing – and where the political trench war is fought. Nothing which contains any nuclear – nothing which contains any wind – and both against things like geoenergy. Or it’s impossible to build a new modern fright train system, saving a lot of energy with it (either Diesel or electrons or whatever). Here conservatives (my Villa gets loud) and ecologists (This swampy meadow…) are hand in hand preventing everything.
US horizontal oil rig count from November 12, 2021 to November 10, 2022 with ordinary least squares (OLS) regression shown, the slope is increase per day for equation shown on the chart, the monthly rate is 13.44 rigs per month or an increase of 161 horizontal oil rigs per year. If that rate were to continue we would be at 729 horizontal oil rigs by November 2023. The current rate is 568 horizontal oil rigs operating for week ending November 10, 2022 and note that the average number of horizontal oil rigs turning in 2018 was 742 rigs when the annual rate of increase in US tight oil was at its zenith.
It’s official now, OPEC production was down 210.000 barrels per day in October. Scheduled to fall a lot further next month, and for the foreseeable future.
It’s interesting that just as OPEC has started cutting production, even if they try to make it look voluntary from this month, they have also begun adding rigs after a relatively flat period. I can’t think of an explanation for that except that they have run out of spare capacity.
It appears that the December 5 sanctions against russia are going to work, even as far as China is concerned.
Why Chinese Refiners Are Importing Less Russian Crude Bold mine
The anticipated shift of Russian crude oil flows, skewing toward Asia, is well underway ahead of the December 5 oil embargo, according to Bloomberg.
Before Russia’s invasion of Ukraine, less than 40% of Russia’s crude oil made its way toward the prized Asian market. But today, nearly 70% of Russia’s oil is destined for Asia—with China and India making the top buyers list.
Total crude oil from Russia fell to a three-week low of 2.9 million bpd for the week ending November 11. But Russian crude oil headed to China, India, and Turkey—along with Russian crude cargo that haven’t yet announced a destination—have increased to a new record of 2.39 million bpd during that week.
But Chinese refiners, according to Reuters, appear to be slowing their Russian crude oil purchases for December loadings, and China is paying lower premiums as the EU sanctions that go into effect on December 5 approachings, along with the specter of the G7 price cap that is also supposed to go into effect on that date.
According to Reuters, this slowdown in Russian crude oil flows is causing crude to build on, pressuring crude prices, since China and India have become such a large part of Russia’s exports since the invasion.
In fact, traders told Reuters that only about five to seven December loading EPSO Blend cargoes have been sold to Chinese users—in stark contrast to the usual 30 per month.
China’s refiners were paying about $1.70-$1.90 per barrel above ICE Brent on DES basis—down from $2.70 two weeks ago, although traders told Reuters that “everything is under the radar now,” making it difficult to get the details of these deals.
Has U.S. Oil Supply Peaked Again? Energy Experts Disagree Bold Mine
The EIA revised 2022 U.S. crude oil supply higher by 80 thousand barrels per day to 11.828 million bpd last week.
Rising costs as well as limited supplies of labor and equipment as some of the problems that have hamstrung efforts by U.S. shale producers to quickly ramp up production.
But commodity analysts at Standard Chartered argue that U.S. crude supply and shale oil supply have both yet to peak.
SNIP
Bloomberg saying, “The projection suggests the pace of US shale growth, one of the few sources of major new supply in recent year, is slowing despite oil prices hovering at around $90 a barrel, about double most domestic producers’ breakeven costs. If the trend continues, it would deprive the global market of additional barrels to help make up for OPEC+ production cuts and disruption to Russian supplies amid its invasion of Ukraine.”
Finally, someone has admitted it. The US shal is the only major source of new supply. True, a lot of smaller sources have appeared, but nothing large enough to save the world from peak oil. Now that the US is showing that not much ammunition is left in her magazine either, it’s all over.
“Now that the US is showing that not much ammunition is left in her magazine either, it’s all over. ”
And then what?
Any details that you foresee would be appreciated.
A permanent worldwide average economic contraction rate of between 1-5% starting as soon as next year but definitely before 2030.
And then what?
I haven’t a frigging clue. My crystal ball is all foggy. However, Philip’s guess is likely good as any.
The only other major source of new oil, as Ron mentioned, are the shale oils in Western Colorado and Utah. USGS estimates there at 3 trillion barrels of oil EQUIVALENT of which an estimated 1 trillion might be producible. But it would need 2 to 3 trillion barrels of water to produce something that might go through a pipeline. All this is in the high desert plateau region of the western US. The water would have to be piped from the eastern side of the Continental Divide.
With electric vehicles, solar and wind coming on strong in the near future, is this development likely to happen?
Oil Production In Russia Will Fall, OPEC Says Bold mine
According to the OPEC World Oil Outlook, Russia will see a drastic decline in its oil production in five years, followed by a sluggish recovery in the next eighteen years. Russian oil output will never rebound to its current levels, though. The Organization of Petroleum Exporting Countries (OPEC) just released its latest annual World Oil Outlook. Oil will remain the most in-demand fuel until 2045, although its share in world consumption will begin to decline until early 2027, according to the OPEC World Oil Outlook.
OPEC analysts also said the share of oil in the global energy mix stood at 30 percent throughout 2020. The share of oil in the energy mix is foreseen to drop from 31 percent in 2025 to just below 29 percent by 2045. Meanwhile, the oil will continue to be a number one energy resource. Russia will see a decrease in its oil output figures amid the Western embargo on oil, fears of possible sanctions, and a weak internal market, according to OPEC analysts. But the situation will soon change as December 5 marks the final deadline for EU countries to ban all imports of Russian seaborne crude. Russian oil supply is expected to decline from 10.8 million bpd in 2021 to 10.1 million bpd by 2027, followed by a slight increase amid some Russian investments, including its major project in Eastern Siberia. It is about Vostok Oil, a Rosneft oil megaproject. The state-run oil firm is now in talks with foreign investors to get involved in the project. Vostok Oil is seeking to combine the biggest oil deposits in the north of Krasnoyarsk Krai. It is expected to produce up to 100 million tons of oil per year, or some 2 million barrels per day. By 2045 Russian oil output will have stood at 10.4 million bpd, yet still below the current level.
The only debate is about how fast and how far Russian oil production will fall. However, everyone agrees that Russian oil production will never return to current levels. There is no debate there.
Are these presumptions about peak oil production (whenever it happened/happens) true or false?
-diesel supply will be most challenging component shortage to global economic function
-there are abundant nat gas liquids and therefore the petrochemical industry is not vulnerable to intermediate term shortfall in feedstock
-bunker fuel (cargo shipping), lubricants, asphalt are not crude oil components which be in short supply for the intermediate term future.
by ‘Intermediate term’ I mean roughly 2-3 decades
by ‘short supply’ I mean restricted enough to cause high pricing that threatens economic stability
Hickory,
Diesel is a short term problem, there have been worker strikes at French refineries, which will eventually be resolved and the high crack spreads may lead to some adjustments to refineries to maximize diesel output to collect the high profits. In addition people who owna diesel and gasoline vehicle will choose the gasoline vehicle wherever possible and sales of diesel light vehicles may decrease.
Also note the most major Agencies (IEA, EIA, OPEC, and Oxford Institute for Energy Studies (University of Oxford, UK) predict that oil supply will be higher than demand for 2022 and the first half of 2023, after that they expect a slight deficit (stock draw) through the end of 2023. Beyond that the recession may have ended and prices will need to rise enough to balance supply and demand. If 2018 remains the peak as most here believe (except me), a plateau at around 80 Mb/d to 82 Mb/d could be maintained at least until 2030 and by that time demand for oil will start to fall below that level as the World transitions to EVs. For first half of 2022 sales of global plugin light vehicles was 62% above first half of 2021. By the end of 2022 it is expected about 27 million plugin vehicles will be on the road. Let’s assume on average that the fuel econly is 35 MPG and average distance travelled is 8000 miles per year, that would be about 228 gallons or 5.4 barrels per vehicle (if the 27 million plugins were ICEVs). So about 399 kb/d less oil is needed vs a World with no plugin vehicles. If sales of plugins continue to increase at about 30% per year (as has been true for 5 years or so) we would reach 256 million EVs by 2029 and would save 3.78 Mb/d vs a scenario with only ICEVs (no plugin vehicles).
Have you watched any TV lately? About the only time I watch is elections and American football season, about 75% of the Auto ads are for EVs, times are changing. Sales growth might accelerate, unless autonomous vehicles (AVs) are approved in most jurisdictions before 2030 (I think this very unlikely). When that does occur, robotaxis will be the way most travel is done and a 10 times smaller vehicle fleet will be needed. Most people will no longer own a personal vehicle, with the exception of tradespeople and the very wealthy and perhaps those in very rural settings (50 miles or more from the nearest village).
Yes, and that is why I do not think that gasoline shortage will be the biggest problem with peak oil.
It will be diesel.
Unless a big portion of the diesel machinery vital for economic function can be also electrified successfully , and quickly enough.
Its a much tougher job than the transition in the light vehicle sector, as far as i can see.
Hickory,
There are a lot of diesel passenger cars in Europe, those will be replaced by EVs, refineries may need to be refit to produce mostly diesel, jet fuel, and residual fuel and less gasoline. Most of the oil produced in the World is heavy oil, tight oil is a small part of the total crude oil produced (currently around 10% or so). When demand for oil starts to drop (between 2024 and 2030) tight oil will quickly become unprofitable as oil prices decrease and the exports of US oil that some are concerned about will cease when US tight oil output falls to less than 4100 kb/d.
Following piece (old from 2016) describes how heavy oil can be converted to diesel through 2 stage hydrocracking, with a yield as high as 75% diesel.
https://www.maschinenmarkt.international/maximizing-diesel-production-in-a-refinery-a-564381/
A more recent article from 2020 that talks about refineries maximizing diesel fuel production and minimizing jet fuel production during the height of the covid19 pandemic. The article gives the impression that there is considerable flexibility in how much diesel can be produced depending upon the setup of the refinery.
More information on the refining process at link below (from 2018)
https://rentar.com/refining-processes-diesel-vs-gasoline/
Thanks for the links Dennis.
I get the impression that flexibility in refining in regard to gasoline vs diesel output is maybe 10%, but am having a hard time finding a solid report on that.
The statement “heavy oil can be converted to diesel through 2 stage hydrocracking, with a yield as high as 75% diesel” applies to a small fraction of the overall crude oil components.
Hickory,
See link below
https://www.engineeringtoolbox.com/crude-oil-petroleum-specific-gravity-density-yield-structure-gasoil-VGO-diesel-naphtha-residue-d_1970.html
And note that for the heavier crudes (specific gravity of 0.92) the large proportion of output from the distillation column that is heavier than diesel (higher boiling point fractions) 62% of the barrel. This can then be hydrocracked to produce diesel with 75% of this as diesel output in the two stage process, so that would be 46.5% of the total of the Atmospheric residue, plus 18% from the distillation process for a total of 64.5% of the barrel of heavy crude input into the process for a refiner that wants to maximize diesel output.
Mr Kaplan seems to be much more knowledgeable about this and can correct my errors as I am not a chemical engineer.
Thanks Dennis. That is useful.
I wonder how much flexibility there really is at actual functional level of the world refineries.
Hickory,
I do not know the answer to that, but my guess id that over the short term there would be less and over the long term more. We need an expert like Robert Rapier to explain how this works in practice.
My general understanding is that for heavy grades of oil (and most of the oil produced in the World today is heavy oil) a large proportion of the distilled product is longer chain hydrocarbons that are heavier (higher bioling point) fractions than diesel fuel. These can be broken up with hydrocracking to produce diesel and kerosene or with Fluid Catalytic cracking(FCC) to produce gasoline. The problem becomes one of throughput with existing refinery equipment that may have been designed with a lot of FCC to produce a lot of gasoline and less hydrocracking capacity, changing the refinery setup is expensive and takes time to accomplish, probably your guess of changing by at most 10%, so if the refinery produced 30% diesel and 40% gasoline it might be able to switch to at most a mix of 40% diesel and 30% gasoline, and perhaps even that big a switch may not be realistic when refineries ar operating at 90% of capacity which is typical in the US.
Dennis there will be another 20 million diesel and petrol burning vehicles on the roads of the world this year.
Can you remind us again when you think oil production will start to decline?
Charles,
My guess is around 2030+/-2 years. Often projections about the future are incorrect, I don’t think we will know the actual number of registered vehicles for all of 2022 until some time after Dec 31, 2022.
November IEA Summary
Demand growth will slow to 1.6 mb/d in 2023, down from 2.1 mb/d this year, as mounting economic headwinds impede gains. The GDP outlook has worsened and 4Q22 global oil use will contract (-240 kb/d) compared with last year. China’s persistently weak economy, Europe’s energy crisis, burgeoning product cracks and the strong US dollar are all weighing heavily on consumption.
World oil supply rose 410 kb/d in October to 101.7 mb/d but is forecast to fall by 1 mb/d for the remainder of the year as OPEC cuts and an EU ban on Russian crude come into effect. Annual growth of 4.6 mb/d this year is set to boost global production to 99.9 mb/d. Modest gains of just 740 kb/d in 2023 will push supply to 100.7 mb/d.
Demand growth of 1.6 Mb/d in 2023 and 740 kb/d of new supply. This will cut into the reserves and begin to Stress the supply side.
Not to forget the 1 mb/d of SPR release will be missing – so netto it will be a supply decrease not counting OPEC cuts and russia problems.
Forecasting oil production next year is much more foggy than in normal years because of the price cap and boycotts to russia.
Ovi – the UK NSTA (ex OGA) reports lease condensate from gas-condensate fields as crude. Only plant condensate from dry gas fields is reported as “condensate”, and this is a very small volume. I think your 10% mark up is likely too much, but I may have misunderstood.
George
Thanks. I will look up the UK NSTA to get more info.
The site I referenced stated the following. “In August 2022, production of crude oil for United Kingdom was 587.49 thousand barrels per day. Includes crude oil, shale oil, oil sands and NGLs ” It did not mention condensate.
For July it stated that crude production was 704 kb/d. The EIA reported July C + C as being 804 kb/d, close to 10% higher. The same site is reporting August production of 585.5 kb/d. I added 10% and rounded up to 650 kb/d as an estimate.
I need to collect more data from this site and compare it with the EIA data to get an idea on how much to increase their “crude” number to get a better estimate for C + C. At this point I only have one data point.
In that context I’d understand condensate to be included in NGLs, which, strictly speaking, it is even if it’s usually included with crude, which it isn’t, because of the way it is processed downstream.
I updated my spreadsheet with NSTA data and got 620 kbpd for August (maybe some maintenance in the Catcher area for 40 kbpd). The dry gas condensate is top line and can hardly be seen.
Last week Art Berman appeared on the Great Simplification, talking about refining.
https://www.thegreatsimplification.com/episode/44-art-berman
He has a holistic view with a great range of knowledge to back it up and an implicit acceptance that things are fuzzy, uncertain and changing (maybe because of his early education as an historian). He admits at the start of the talk that he is not an expert in the field, however the pedant in me feels that I should correct a few things he said.
He seems to have ethane (C2H6) and butane (C4H10) mixed up. Butane is heavier than propane not lighter. The iso form is particularly important in refineries as it is used in alkylation units to make longer chain alkanes that are attractive additives to gasoline (mainly isoC7 and isoC8).
Octane in the crude feed (C8s) is not primarily used to make plastics. It is actually the most important component of gasoline (hence octane number) and falls right in the middle of the range of hydrocarbons found there (c4 to c12, mostly made up of iso-alkanes and aromatics.
The crude oil cuts used as chemical feed stocks are any natural gas liquids (C2 to C4) and naphtha, which comes in light, C5/C6 – lower boiling than gasoline, or heavy, similar range to gasoline, and can be fed to a reformer to make syn. gas (and then methanol, ammonia etc. or, if you become really desperate, diesel in a Fischer-Tropsch unit – I think he has these two processes mixed up) or an olefin plant to make ethylene and propylene, and then on to polymerisation to make various plastics. Even then I think most naphtha isn’t used as chemical feedstock but is upgraded, e.g. in an isomerisation unit, to make more gasoline.
The rules about low sulphur marine diesel use vs high sulphur marine bunker fuel are a bit stricter and more uniform than high implies.
He doesn’t say much about fluid cat crackers, which can upgrade heavy ends to gasoline, or hydro crackers, that can upgrade to diesel, and provide quite a lot of flexibility within refineries.
If petroleum includes natural gas then I think its biggest use in concrete manufacture is as a fuel to heat the kilns (this might be one of those things that electricity would find difficult).
Biodiesel may come from algae – the biggest problem here as I get is the high energy costs to dry them out before processing.
He’s wrong about nobody using crude oil directly, Saudi burns it for power.
Thanks for straightening things out George. Always appreciate your comments.
This chart shows Norway C&C reserves and resources, with all numbers backdated to the year of the original discovery well. The tail off of discoveries is quite pronounced and there are relatively few development projects remaining.
The biggest potential oil project in the resources is Wisting in the Barents Sea, discovered in 2013, and with a putative 500 million barrels of recoverable oil, which is over four times larger than the next biggest. The project FID was recently postponed by Equinor, citing supply chain problems and market uncertainty. I think we are now entering a time when future oil prices are of secondary concern in developments, with decisions based more on the appetite for risk and ERoI considerations, possibly with some marginal projects in increasingly difficult environments becoming impossible to justify at any oil price.
The R/P number is shown in weeks to get it on the same axis and has been noticeably dropping in recent years, which is unusual in such a mature basin, but may be an impact from Johan Sverdrup . It is currently almost exactly ten years.
Natural Gas R/P is twelve years and dropping. The discovery curve has been very flat and has no bump from Johan Sverdrup. Plus oil discoveries in the Barents Sea generally have the associated gas reinjected as there is no economic way to exploit it, and therefore it does not count as reserve at the moment.
For recent changes in remaining reserves the following two charts show reserves and resources (the pale area) as they were known in each year (i.e. not backdated) so discoveries are shown against the year of the FID. The way Norway controls and schedules developments means that oil price fluctuations probably have less impact on revisions than elsewhere. The last two years have shown a marked drop in crude reserve replacement ratio as few new projects have been approved, and that seems likely to continue with the recent Wisting delay, although the Krafla development (with two smaller fields and slightly more gas than oil) is likely to be approved soon.
Gas reserves have been steadily declining and full reserve replacement has not been achieved for some years. There are four main groups of producers: Snohvit LNG, which has been having some availability issues but is fully on-line now; Troll, by far the largest and feeds Europe; some older fields like Oseberg, Skarv and Asgard (some of which are blowing down a gas cap); and the Nyhamna gas plant, feeding the UK with gas from Ormen Lange, Aasta Hansteen and (once some operating issues have been overcome) Dvalin.
There’s a new post by Jean Lahererre at ASPO France about natural gas (I think 2010 is meant to be 2020).
https://aspofrance.org/2022/11/03/world-natural-gas-recovery-factor-in-2010/
Thanks George.
Laherrere’s current estimate for World Natural gas has a URR of 20000 TCF with a peak in 2045 at about 195 TCF per year, my best guess in 2015 was a URR of 19000 TCF with a peak at about 170 TCF per year in 2038. In 2021 World Natural gas output was about 143 TCF per year, based on BP data, but I followed Laherrere’s methode of using gross natural gas minus reinjected gas which is about 10% higher than BP’s numbers, so 2021 output was about 157 TCF for the year and my 2015 estimate was too low by about 7 TCF for 2021.
Post at link below, chart below from that post
https://peakoilbarrel.com/world-natural-gas-shock-model/
Updated shock model with URR the same, but data updated to latest EIA (1990-2015) and BP data with BP data adjusted to reflect gross minus reinjected (an estimate based on the comparison of EIA and BP data from 1990 to 2015. Extraction rates adjusted from original model to reflect new data and projection slightly different, underlying discovery model is unchanged with discoveries equal to 19000 TCF (including projected future discoveries and reserve growth). Peak is 171 TCF per year in 2034 to 2039, which would be about 155 TCF per year in an equivalent BP natural gas production estimate (171/1.1). Peak year is 2037 at 171.2 TCF/year, but obviously the future cannot be predicted that accurately. Note also that if wind and solar expand as fast as I expect, natural gas demand will start to fall after 2035, for the IEA APS natural gas falls to 75% of the 2021 level by 2040, which in my scenario would be 118 TCF per year, compared to 171 TCF in my scenario or about 53 TCF lower for the IEA APS scenario (this is the medium scenario of the 3 IEA scenarios).
In short, my scenario may be far too high after 2030, even the high STEPS projection from the IEA WEO has World output of natural gas at 163 TCF/year in 2030 and falling to 161 TCF per year by 2040, where my scenario has natural gas at 169 TCF in 2030 and 171 TCF in 2040.
Laherrere’s projection (graph on page 14) shows current levels of nat gas and nat gas liquids
supply level at the current rate [roughly 150 TCF/yr]
being able to hold up until around 2070, after peaking in the late 2040’s.
A big take home message is that there should be plenty of nat gas to get through the next decades while the worlds civilizations maybe makes some adjustments to operations and expectations.
Got LNG tankers?
Another update on yield curve. 30 year bonds are just 8 basis points from being inverted with the overnight lending rate. Think about that for a minute and let that sink in.
But don’t worry because Huntington Beach said all will be fine because J Powell has credibility and credentials. And damn sure knows what he is doing.
In other news HHH sticks by his call for much lower oil prices because in reality it’s not HHH’s call. It’s the yield curves call.
HHH just knows that the major players in both the treasury and Eurodollar market have proprietary data. That hasn’t shown up in official data. And they are scared which is why yield curves are inverted.
It is likely that the Fed tightening is approaching its limit. But the supply of oil is also tight and prices have been remarkably stable for the last half year. Much depends, imho, on what happens with China and Covid. We won’t see a big oil price drop unless the bottom falls out on China, which is a real possibility of course.
Oil inventories haven’t been as low as they are now since 2003 or 2004. And yet today WTI is at $84 and falling. OPEC is even saying demand is falling.
HHH,
OPEC World oil demand estimates:
3Q2022=99.33 Mb/d and all quarters after 3Q2022 are higher starting with 4Q2022 the next 5 quarters are forecast as 101.64, 101.33, 100.94, 101.91, and 103.88 Mb/d. In 2023 average annual demand is expected to rise by 2.34 Mb/d over 2022 and in 2022 annual demand is expected to be 2.64 Mb/d higher than 2021. The IEA expects slower demand growth in 2023 than OPEC, about 1.6 Mb/d.
Nobody is predicting that demand will fall, only that the growth rate will be a bit lower than forecast previously.
Yes the other side of the coin is China muddles through opening up out of zero Covid and then in the spring the oil market shoots you to $150+
In Italy, consumption of petroleum products increased by 5% compared to 2019.
They are low, but still enough to fill every delivery. So financial games can continue – but with growing risk.
Things get interesting when there are 2 buyers but only 1 tanker full of oil left. You can see at the Diesel premium over crude oil how fast things can escalate. Diesel was in short supply here in summer (mostly political reasons, strike in France) – and there was waiting time to fill a heating oil delivery.
Things will begin to get interesting – from news December will be without SPR release (-1mbpd) and russian price control (-1.5 mbpd). How realistic the last is, I don’t know, but both together will slash a whopping 75 million barrel from inventories. And OPEC cuts coming in.
Times are interesting.
Stephen, I’m mostly inline with your opinion above. I would add the Ukraine war implications to your “much depends”. Also the Fed is being very careful not to signal the end to tightening could be near. They seem determined to put inflation back in it’s box. Rightfully so. The current rates really aren’t even all that restrictive. It’s more like the market needs to adjust to more normal historical rates.
The 4 week bill is now inverted with the 10 year btw.
Your basing $150 or at least $100 Oil on a narrative. China opening up or whatever else the narrative might be.
I’m basing $25 oil on growth and inflation expectations of the two deepest most sophisticated markets on the planet. Eurodollar and US treasury markets.
Good luck with your narratives.
Yes of course there are multiple narratives. I don’t presume to know which will play out but rather enjoy learning about the range of options. The traders you rely on could change their minds tomorrow of course and all the curves could no longer be inverted after some other piece of info comes in. There’s a chance you’re right but a slim one imo. Nothing to do but wait and see.
“don’t worry because Huntington Beach said all will be fine”
Stop making things up and putting words in my writing 3H. I never said “all will be fine”. What I did write is “Your diarrhea continues” and “We’ll be lucky to see $75 oil this winter”. I stand by those comments. Here is what I do think, your a lying ignorant person with low intelligence. Who rants about an inverted interest rate and doesn’t understand the underlying problems of the world economy. It reminds me of someone who’s car doesn’t start and says I have a blown engine. That’s the first sign the owner has no mechanical knowledge of the problem. Here is another sign of your ignorance. You start a sentence with “HHH just knows”. When they should start with something like “In my opinion”. You are entitled to your own opinion, but not entitled to your own facts.
“Now remind me again your qualifications” because your clown presentation doesn’t count.
HHH
Over the last two days the 2 yr 10yr spread has gone from 55 basis points to 67. That is not encouraging news.
Yes and as the inversion works it’s way into the T-bills it means market is convinced bad outcome is more imminent.
There is a lot of inversion in German bunds too. Which is unheard of. Even during 2008 crisis German bunds only inverted for a short amount of time.
Have you looked at Canada’s yield curve? It’s pretty damn ugly. I know it’s nowhere near as important as US treasuries but there is a whole lot of evidence that something bad is brewing.
HHH
Yes. It shows up on the same TV channel and it is really ugly. As I recall, the spread is close to 80 basis points.
In Eurodollar curve there is 187 points of inversion. It’s an absolute ridiculous amount of inversion. I think Eurodollar curve is actually way more important to oil prices than the US treasury curve is.
Because Eurodollars are global money. And Eurodollar system is used to borrow all them dollars used in cross border settlements and investments. If you need US dollars to do business outside US you borrow them from Eurodollar market. It’s the medium of exchange.
And when banks become risk adverse. Which we know they are because of the yield curve. And start requiring a lot more collateral to make the loans that are used as the medium of exchange. Prices fall and it won’t be just oil prices.
Prices literally fall because loans that are usually made aren’t made.
Crude Oil
81.82
-3.77(-4.40%)
@Hightrecker
But there is enough money left to bid up stocks… so it’s still games on the derivate side.
When money and credit is scare, stocks will crash since margin loans have to be paid back, and people draw from their depots to pay costs. That’s not happening, so this is a normal market move.
A “there is no credit” move would be NASDAQ, DOW, GOLD, junk bonds and OIL 3-5% down for several days – until the FED folds and lowers rates.
More Steepening
WTI down 3.36 to $82.23/b.
‘The world should be worried’: Saudi Aramco — the world’s largest oil producer — has issued a dire warning over ‘extremely low’ capacity.
The global oil market remains tight according to Saudi Aramco, the largest oil producer in the world. And that does not bode well for a world that still relies heavily on fossil fuels.
“Today there is spare capacity that is extremely low,” Saudi Aramco CEO Amin Nasser says at a conference in London. “If China opens up, [the] economy starts improving or the aviation industry starts asking for more jet fuel, you will erode this spare capacity.”
Nasser warns that oil prices could quickly spike — again.
“When you erode that spare capacity the world should be worried. There will be no space for any hiccup — any interruption, any unforeseen events anywhere around the world.”
What the hell? The CEO of Aramco says the world is running out of spare capacity; people should listen. He is telling everyone that Saudi is producing every barrel they possibly can. They cannot ramp up production because they have virtually no spare capacity left. And they know what the rest of OPEC has.
Attached is a table from the November IEA report.
I have added the third column, October production vs September.
OPEC plus was to drop by 100 kb/d in October. OPEC 10 dropped 110 kb/d. Non-OPEC added 100 kb/d.
Note that Saudi Arabia dropped 130 kb/d in October and were 100 kb/d below target which implies that their 11,030 kb/d in September was a bit of an unsustainable stretch.
Kuwait is bang on their target and the UAE over produced in October by 280 kb/d.
The last two columns show the estimated Sustainable capacity and the current Spare capacity. The only real spare capacity is in Saudi Arabia and the UAE with a total 2,000 kb/d. Not sure where they get the spare capacity for Nigeria. Kazakhstan’s output will be back to 1,700 kb/d by October/November. So while the IEA shows Effective spare capacity of 3,000 kb/d in the bottom line, I think it is closer to 2,000 kb/d.
Thanks for the comment Ovi. I have a question. What is your opinion of the IEA’s estimate of OPEC’s sustainable capacity and spare capacity? I have a pretty low opinion of it myself. The idea that Saudi can sustain the production of 12.2 million barrels per day is absurd.
Why does the IEA report differ so much from the OPEC MOMR? According to the MOMR, OPEC 13 was down 208,000 barrels per day, and OPEC 10 was down 223,000 barrels per day in October.
OPEC 13 Production for September and October according to the MOMR in barrels per day:
Sep. 29,703,000
Oct. 29,495,000
Ron
From what I have read, Saudi Arabia claims a NAME PLATE capacity of 12 Mb/d. I tend to believe that. The issue is that not all of these wells can be pumping at capacity at the same time to get the 12 Mb/d. Well maintenance, etc keeps a certain percentage down. I think we saw SA’s real capacity in September when they hit 11 Mb/d. Note how they missed their 11 Mb/d commitment in October.
I also think the 11 Mb/d capacity limit played a role in SA pushing for a 2 Mb/d cut. This let them cut back to 10.5 Mb/d
SA has also promised to achieve 13 Mb/d by 2027. Again I think that is NAME PLATE capacity and the real number is closer to 12 Mb/d. Add in the fact that SA’s decline rate is 2% a year, i.e. 0.2 Mb/d. In 5 years that is 1 Mb/d. So maybe they are running hard to try to stay at 11 Mb/d.
As for your second question of why the difference between, OPEC, IEA, Reuters, they all use different sources. Attached is a table comparing October production for Reuters, OPEC and IEA. Since I also collect the IEA reports, I compared the July numbers, for OPEC and they were very close.
Some reading material
https://www.arabnews.com/node/2142426/business-economy
https://www.reuters.com/business/energy/opec-oil-output-falls-by-20000-bpd-october-reuters-survey-2022-11-02/
https://oilprice.com/Energy/Crude-Oil/Saudi-Arabias-Real-Production-Capacity-Is-15-Million-Bpd-Possible.html
https://www.upstreamonline.com/production/saudi-oil-output-nears-capacity-as-it-hits-11-million-bpd-in-august/2-1-1298000
Comparing July from IEA and OPEC
for now, inflation and covid have been invented in China. Then something else they will come up with. They cannot say that the PO has already arrived.
Agreed. The Saudis can produce 10.5. That’s the limit. Everything else is coming from storage. Do we know of any big projects in the pipeline for them? If not then a loss of 2-3% per annum seems likely.
Collin Campbell passed away on 13th Nov . RIP . A legend .
A true legend
This is how I became aware of Peak Oil. His seminal paper in Scientific American in March 1998.
A remembrence by Richard Heinberg at link below
https://www.resilience.org/stories/2022-11-16/colin-campbell-obituary/
One year later this article appeared in the Economist. While I can’t access the article, I think they predicted that oil was going to $5/b. Shortly after that it started its run to $148.
Another giant gone, joining the likes of Professor Kenneth Deffeyes, Ali Samsam Bakhtiari, Professor Albert Bartlett, Matthew Simmons, and others.
I guess the Democratic Party doesn’t want to give up on requiring methane monitoring at all stripper wells.
That’s the plan, despite the DOE study which I have referenced.
Hopefully the EPA can come up with a cost effective plan.
Looks like they will again take comments, through 2/2023 and then develop rules by the end of 2023.
Peak Oil
Too many people are hung up on a particular month or year.
With so many countries producing oil and various political events happening it was always unlikely we would see a distinctive peak.
Various events can cause several countries to drop production simultaneously and then production to recover.
Underlying economic and political events is; depletion, which is obvious in countries such as Norway, United Kingdom, Mexico. Many times it is blurred by Wars, sanctions etc, in countries such as Libya, Russia, Iraq etc.
So far more likely would be not a peak but a bumpy plateau for several years.
Countries suddenly increasing and declining production.
I think that plateau started in 2018.
As more countries are overwhelmed by geological decline the likelihood that the rest will enable a continued global increase diminishes.
That plateau will end by a combination of geological and importantly political factors.
Since nobody knows what political events lie ahead nobody can predict the end of this plateau that we are now on.
Geological decline and peak production in Saudi Arabia and the United States gives an upper limit of 2028.
Personally I think we will start seeing a gradual and relentless decline a couple of years before that.
Charles,
I agree with your point in regard predicting the peak year and, as Colin Campbell said long time ago, this is less important than a discussion on what will we do after oil production begins to decline.
To distinguish prediction from forecasting Daniel Bell in his Coming of Post-Industrial Society says (his words in quotes): “Predictions usually deal with events”, such as the year of Peak Oil. “Forecasting is possible where there are regularities and recurrences in phenomena, or there are persisting trends whose direction, if not the exact trajectory, can be plotted with statistical time-series or formulated as historical tendencies” The trajectory of world oil production fits this category.
How to get those in leadership positions into this discussion is the task at hand. I have sent email to former colleagues but have not received even an acknowledgment, except by very few, who the next time I talk to them have forgotten the important points during our previous chat. Writing newspaper articles would be possible, but people pay attention to them only when it is too late, and at that late date the bureaucrats will enact policies that are formulated by the same people who were blind to what is happening a few months prior. Not very encouraging outlook.
Sadly, you have to remember that people in academics and at research institutes rely primarily on grants, so you must not bite the hand that feeds you. Thusly, getting funds (edit: by keeping in line) is prio 1, 2 and 3, and damn the torpedos…
(Been there, done that)
EV sales up 63% yoy while overall auto market down 8%. These are staggering numbers. Read this short article for details
https://cleantechnica.com/2022/11/17/global-electric-vehicle-sales-up-62/
New posts are up
https://peakoilbarrel.com/opec-update-november-17-2022/
and
https://peakoilbarrel.com/explaining-natural-climate-variations/
Comments pertaining to petroleum in first thread and all others in second thread. Thanks.