A post by Ovi at peakoilbarrel.
Below are a number of oil (C + C ) production charts for Non-OPEC countries created from data provided by the EIAʼs International Energy Statistics and updated to February 2021. Information from other sources such as OPEC, the STEO and country specific sites such as Russia, Norway and China is used to provide a short term outlook for future output and direction for a few countries and the world.
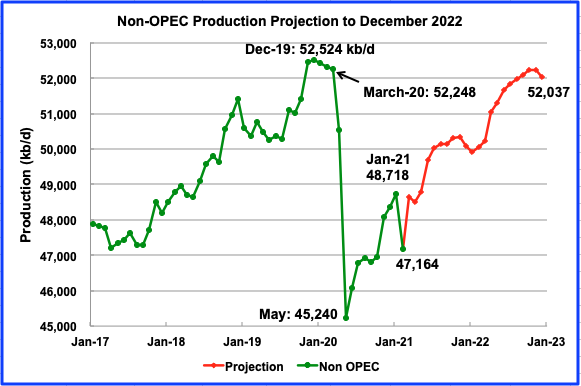
February Non-OPEC production dropped by 1,554 kb/d primarily due to the US winter storm. February’s Non-OPEC drop was primarily driven by output decreases from the US (1,198 kb/d) and Canada (201 kb/d).
Using data from the June 2021 STEO, a projection for Non-OPEC oil output was made for the time period February 2021 to December 2022 (red graph). A significant rebound is expected in March as US production comes back online.
Output is expected to reach 52,037 kb/d in December 2022, which is lower than the previous high of December 2019, by slightly less than 500 kb/d. In the June report, the forecast December 2022 output was revised up from 52,010 by 27 kb/d.
Ranking Production from NON-OPEC Countries
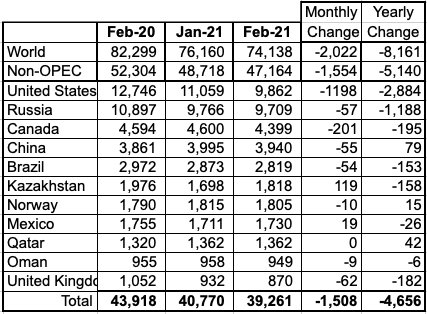
Above are listed the worldʼs 11th largest Non-OPEC producers. The original criteria for inclusion in the table was that all of the countries produced more than 1,000 kb/d. Two have currently fallen below 1,000 kb/d.
In February, they produced 83.2% of the Non-OPEC output. On a YoY basis, Non-OPEC production decreased by 5,140 kb/d while on a MoM basis, production decreased by 1,554 kb/d to 47,164 kb/d. World YoY output is down by 8,161 kb/d. As noted above, the MoM February decrease was primarily driven by output decreases from the US and Canada.
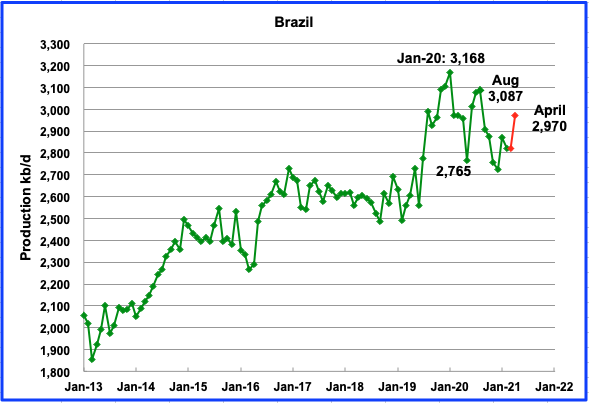
The EIA reported Brazilʼs February production decreased by 53 kb/d to 2,820 kb/d. According to this source, April’s output increased by 4.6% from March to 2,970 kb/d. (Red Markers).
“Oil production in Brazil was up 4.6% in April compared to the previous month, to 2.97 million barrels per day (bpd), in the second consecutive monthly increase, data from the National Agency of Petroleum, Natural Gas and Biofuels pointed out. (ANP), with advances from Petrobras and Shell.“
With regard to future production, Norway’s Equinor ASA (EQNR.OL), Exxon Mobil Corp(XOM.N) and Petrogal Brasil will pour $8 billion into Brazil’s deepwater Bacalhau oil field development. The first oil from Bacalhau is expected in 2024, with output set to reach 220,000 barrels per day, the companies said in the joint statement. The field has a break-even cost below $35 per barrel, Equinor said, or around half the current market price of crude oil, according to this source
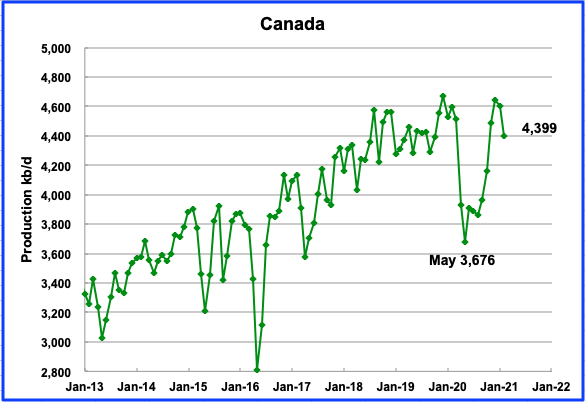
February’s output dropped by 201 kb/d to 4,399 kb/d. Oil exports by rail to the US in March were 175.6 kb/d an increase of to 63.7 kb/d over February.
Two competing consortia have now been formed to buy the Trans Mountain pipeline once it is completed and operational. Even though all of the approvals have been received, opposition still persists. Similarly opposition continues in Minnesota against the Enbridge line 3, source.
On Monday June 14, 2021, the Minnesota appeals court upheld the regulatory approval of Line 3 permits. The court agreed that Enbridge demonstrated a sufficient need to build a replacement line during the permitting process. Source. Other appeals are continuing,
“While reasonable minds may differ on the central question of need for replacement Line 3, substantial evidence supports the commission’s decision to issue a certificate of need,” Judge Lucinda E. Jesson wrote. “Finally, the commission reasonably selected a route for the replacement pipeline based upon respect for tribal sovereignty, while minimizing environmental impacts. Accordingly, we affirm.”
Currently the US imports close to 6,000 kb/d of oil, of which close to 4,000 kb/d is from Canada. The US also exports oil to Canada.
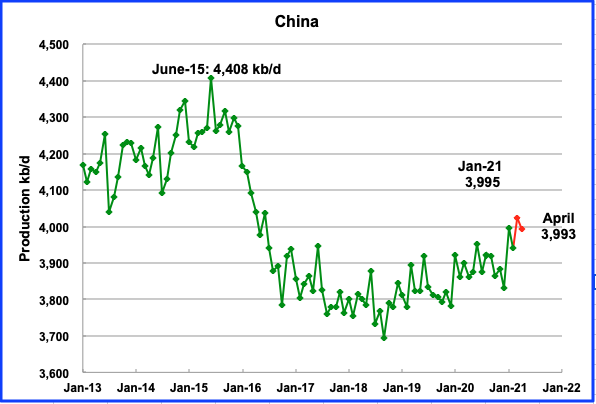
The EIA reported Chinaʼs February output dropped by 55 kb/d from January to 3,940 kb/d. This source reported crude output in April was 16.41 million metric tons. Using 7.3 barrels per ton, April’s output was estimated to be 3,993 kb/d, down 27 kb/d from March.
China continues to be the oil industry’s biggest spending driller because of its fear of dependence on foreign suppliers and its desire to increase its own supply. Source
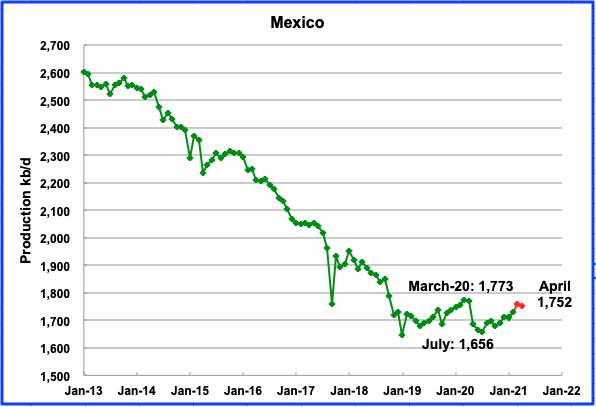
Mexicoʼs production, as reported by the EIA, in February was 1,710 kb/d. Data from Pemex shows that March production increased to 1,759 kb/d and dropped to 1,752 kb/d in April (Red markers).
According to S & P Global, Mexico’s oil production is expected to remain around 1.7 million b/d for 2021 and 1.75 million b/d for 2022, in spite of the new fields it finds and brings online.
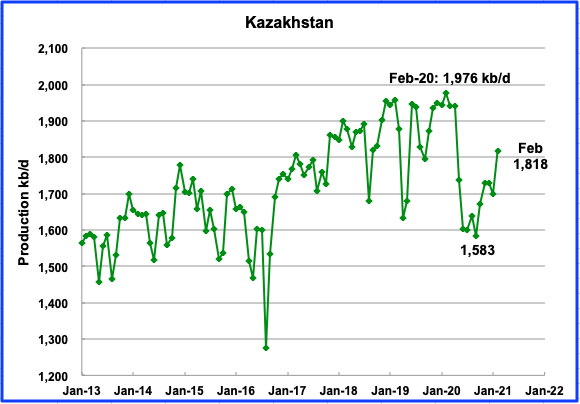
Kazakhstan’s output increased by 120 kb/d in February to 1,818 kb/d. Their OPEC + partners gave Kazakhstan permission to increase their output in April.
Kazakhstan will continue to increase oil production under OPEC+ agreement
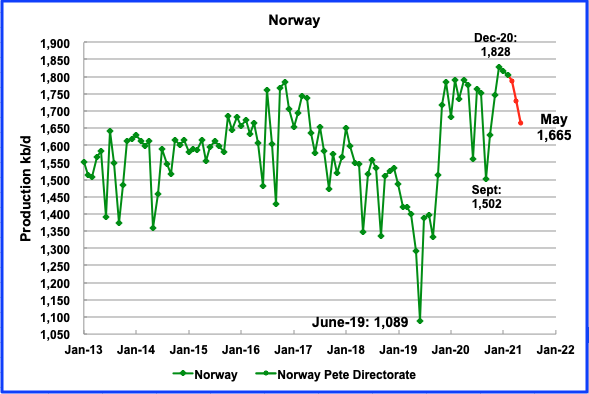
The EIA reported that Norwayʼs February production was 1,805 kb/d, a decrease of 10 kb/d from January. The Norway Petroleum Directorate reported that production in May dropped to 1,665 kb/d after dropping to 1,728 kb/d in April, red markers. The production drop since December is 163 kb/d and is partly due to maintenance.
According to the June OPEC report, production from Johan Sverdrup phase-1, which passed the 500 tb/d level in January 2021, is expected to reach 535 tb/d in July and then continue at this level until the end of year. The output of liquids has been affected by maintenance in 2Q21 and production is expected to be lower by 0.11 mb/d vs 1Q21. However, output is anticipated to be higher in 3Q21 by 0.06 mb/d vs 1Q21 to average 2.17 mb/d. This is due to higher production ramp ups from new projects, more than offsetting outages due to maintenance.
An earlier NPD report noted “State-controlled Equinor said in November Johan Sverdrup output, which has become a major feedstock for Chinese independent refineries, could rise beyond first-phase levels of 500,000 b/d by the middle of this year thanks to increased water injection.“
While not directly related to Norway, Norway’s Equinor ASA (EQNR.OL), Exxon Mobil Corp(XOM.N) and Petrogal Brasil will pour $8 billion into a Brazilian deepwater oil field development that is expected to produce about half of the average carbon emissions of similar projects, the companies said in a joint statement on Tuesday and reported by this source
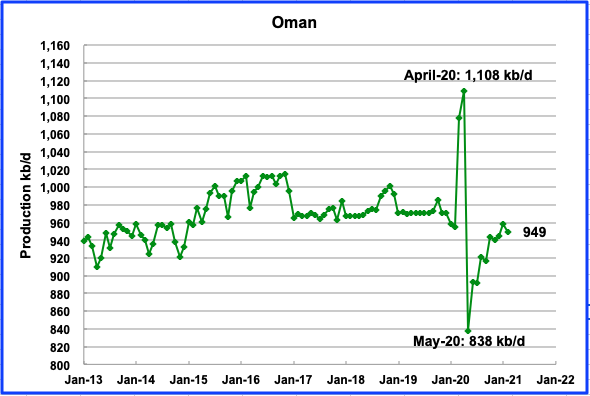
Omanʼs February production decreased by 9 kb/d to 949 kb/d.
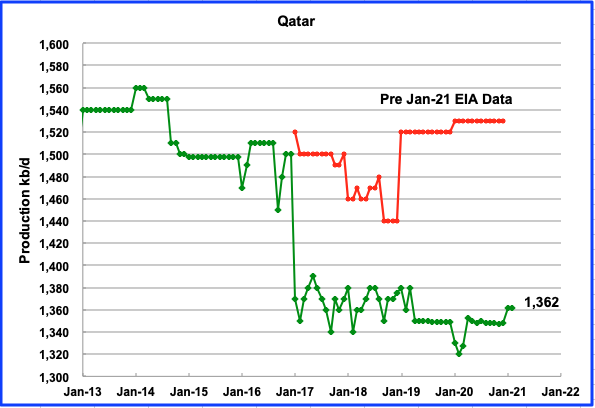
February’s output was unchanged at 1,362 kb/d.
Qatar’s output was drastically revised down by the EIA in its January 2021 report. The red graph represents the EIA’s assessment of Qatar’s production from January 2017 to December 2020 according to its December report. December’s 2020 production of 1,520 kb/d was revised down to 1,348 kb/d in the February report, a decrease of 172 kb/d.
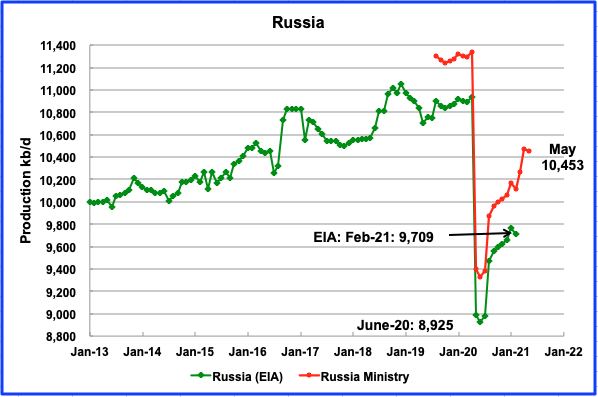
According to the Russian Ministry of Energy, Russian production decreased by 23 kb/d in May to 10,453 kb/d. The difference of close to 400 kb/d between the US and Russian numbers indicates a difference in the definition of Crude plus Condensate.
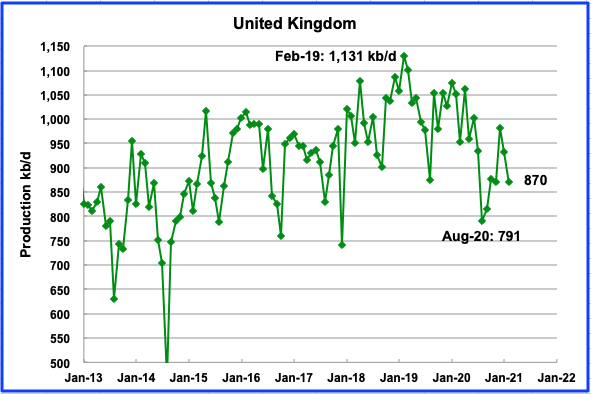
UKʼs production decreased by 62 kb/d in February to 870 kb/d.
According to OPEC, several E&P projects have reportedly been deferred, such as the Seagull project, which was deferred to late 2022. Hence, UK oil supply is expected to decline by 0.05 mb/d y-o-y to average 1.02 mb/d due to a decrease of 32% in investment last year in the oil and gas sector.
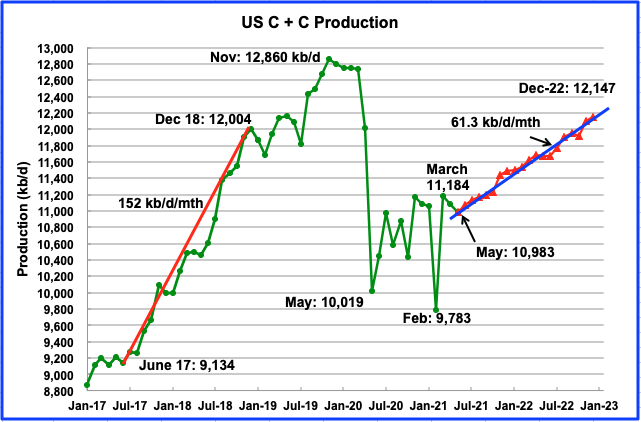
U.S. March production increased by 1,401 kb/d to 11,184 kb/d from Februaryʼs output of 9,783 kb/d and was also 128 kb/d higher than January’s. The increase was due to the rebound from the severe winter storm that hit the four US southern states, Texas, New Mexico, Louisiana and Oklahoma.
The June STEO report forecast US output would drop in April and May to 10,983 kb/d. It would then begin to increase at an average monthly rate of 61.3 kb/d/mth up to December 2022, red markers.
It should be noted that the June STEO lowered the December 2022 production forecast from 12,334 kb/d to 12,147 kb/d, a drop of 187 kb/d. The revised forecast also drops the average monthly US output increase to 61.3 kb/d/mth from last month’s estimate of 75 kb/d/mth.
This should be welcome news to OPEC. If demand growth were to approach 1,000 kb/d in 2022, this would mean that OPEC would have room to increase their production, depending on what the rest of Non OPEC excluding the US does.
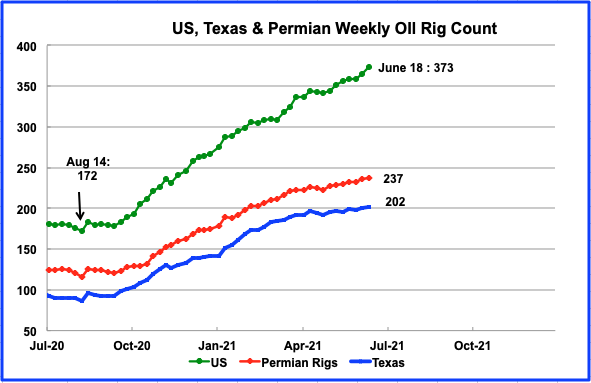
Rig additions continued in the US from the August low of 172 to mid June 2021. For the week of June 18 the rig count increased by 8 to 373. Texas added 2 while the Permian added 1 to 237
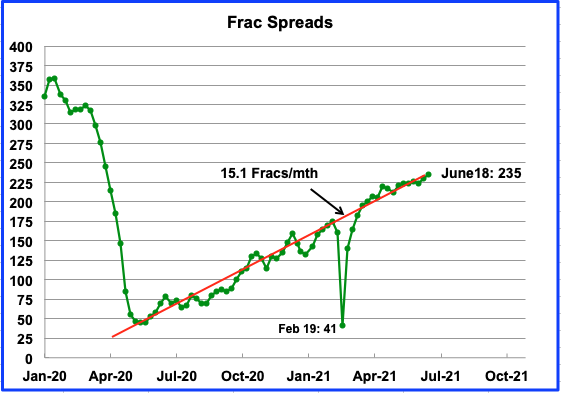
In the week of June 18, 5 frac spreads were added and reached a new recent high of 235. There is no indication of a change or slowing in the rate at which frac spreads are added each month.
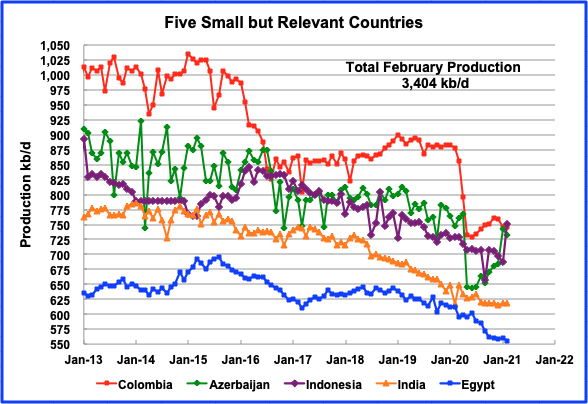
These five countries complete the list of Non-OPEC countries with annual production between 500 kb/d and 1,000 kb/d. Their combined February production was 3,404 kb/d, up by 50 kb/d from January’s. Azerbaijan’s and Indonesia’s output appears to be recovering.
World Oil Production Projection
World oil production in February decreased by 2,022 kb/d to 74,138 kb/d according to the EIA. Of the 2,022 kb/d drop, the largest contributors were, US 1,273 kb/d, Saudi Arabia 900 kb/d and 201 kb/d from Canada.
This chart also projects world production out to December 2022. It uses the June STEO report along with the International Energy Statistics to make the projection, red markers. It projects that world crude production in December 2022 will be close to 82,640 kb/d. This is 2,000 kb/d lower than the November 2018 peak of 84,631 kb/d.
An Interesting OPEC Exercise
Above are the 11 OPEC countries that were present in OPEC in November 2016 when production reached its maximum output of 33,374 kb/d. Since then Ecuador and Qatar have left. With those two removed the maximum production is reduced to 32,180 kb/d. Production from the remaining 11 countries in May 2021 is in the middle column. The last column is my guesstimate where production will be in mid 2022. These guesses come from looking at the charts in the previous OPEC post by Dennis.
I should note that the EIA STEO is projecting flat output of 28,700 kb/d for OPEC from October 2021 to December 2022. In Q4-19, pre-pandemic, these 11 countries were producing close to 28,700 kb/d.
Essentially I am saying that OPEC output is going from 25,000 kb/d in May 2021 to 29,000 kb/d by Mid 2022, a potential increase of 4,000 kb/d. That still leaves those 11 OPEC countries down by 3,000 kb/d from November 2016.
If by mid 2022 world demand is back to pre pandemic levels and the US is producing close to 11,500 kb/d, we may be seeing a very tight oil market sooner than most expect.
Here is your fun exercise. Put your numbers in column three and give us your best guess.
Thanks Ovi,
My guess is that OPEC output will be 29500 kbpd in July 2022.
Great job as usual.
My best guess is OPEC output will be around 28,500 kbpd or less in July 2022. (Crude Only)
Got any guess for World C+C output in July 2022 Dennis?
Ron
According to the chart above it could be 82,000 kb/d.
Yes, you are correct, according to the chart above it could be 82,000 kb/d. There is just one problem here. The chart above is bullshit. 😉
But what is your prediction? Do you believe the chart above? Hey, this is the turning point. This is the point in time where the peak oiler’s predictions will fail or prevail. This is their last hurrah or last humiliation. Choose your side now or forever hold your peace.
Ovi, in case you haven’t guessed I am on my third toddy tonight and do not really that care about what I say… or think. I just sent the following post to all my friends in North Alabama:
“It’s raining. I love the sound of rain on the roof of my tiny little trailer. I will miss the rain when I get back to the desert of southern New Mexico. It almost never rains there. But, no place is perfect. I am going stir crazy in this tiny living space. I want more space. I want to do things that I cannot do here. And I want to stop living on TV dinners and cereal for breakfast. So I am going back to hot, dry, New Mexico.
But I have no regrets. This six-month trip to rainy North Alabama has been very rewarding for me. I have figured out a lot of things I would not have done otherwise. I am now ready for the next phase, and likely the last phase of my life. I am looking forward to it. I love you all.”
Okay, that’s it for tonight. Take care.
Ron
Enjoy a fourth. I wonder how much production will drop due to Claudette.
I think we are heading for the confirmation of peak oil sometime between mid 2022 and late 2023.
What do you mean by confirmation? Do you mean they will confirm that the peak was 2018-2019? If so, I cannot agree. No, there will be deniers all the way down. There is something about the human psyche that just cannot accept reality. After all, most Republicans still think Trump won the election. The ability to deny the obvious is just built into our nature.
Thanks for continuing to monitor crude oil production. As of now, we are back to 2005 levels!
I have been looking at BP
17/6/2021
BP peak oil (UK decline, asset sales and decommissioning part 2)
https://crudeoilpeak.info/bp-peak-oil-uk-decline-asset-sales-and-decommissioning-part-2
30/4/2021
BP peak oil (UK decline, asset sales and decommissioning part 1)
https://crudeoilpeak.info/bp-peak-oil-uk-decline-asset-sales-and-decommissioning-part-1
Many problems we see are now worse than in any peak oil scenario, especially in the airline industry. So I have been looking at the numbers and found:
22/5/2021
China-Australia passenger traffic has peaked 2018-19 before Covid
https://crudeoilpeak.info/china-australia-passenger-traffic-has-peaked-2018-19-before-covid
It is also generally assumed that electric vehicles will take over.
But in Australia power generation is insufficient to support any number of EVs which would be relevant to reduce oil demand:
14/6/2021
NSW power spot price spikes May 2021 become regular (part 2)
https://crudeoilpeak.info/nsw-power-spot-price-spikes-may-2021-become-regular-part-2
7/6/2021
NSW power spot price spikes May 2021 become regular (part 1)
https://crudeoilpeak.info/nsw-power-spot-price-spikes-may-2021-become-regular-part-1
Too bad Australia has such poor solar reserves, else they’d be able to drive all around without oil.
https://globalsolaratlas.info/map?c=-19.932041,130.078125,4
Ron
Yes. Confirm 2018. Its their choice to believe it or not. In the end they will feel it in their wallets.
When 30% of the GOP believe that T will be reinstated in August, you know that there are people who will believe or not believe anything you tell them.
In 2030, global C+C production will be 74 Mbpd, which will be plenty for the important uses.
Or, it will just have to do.
Hicks , “Or, it will just have to do.” More likely .
On this we agree in full.
Hicks , I think you being very gracious by forecasting 74 mbpd by 2030 . My thought is 74-76 mbpd bracket by 2025 . The reasoning is that we will end 2021 at 80-81mbpd . In the next 4 years shale will easily loose another 3mbpd . It can be ramped up fast and it will also crash fast especially with the headwinds it now faces . Add another 2mbpd on natural decline ( here I am being gracious) and we could loose 5mbpd or more by 2025 . All are requested to give their reasoning and rectify me if I am incorrect .
P.S ; Shale has gone from 8.3mbpd in Nov 2019 to 6.9 mbpd Feb 2021 . Loss of 1.4mbpd in 15 months .
Hole, It was just a wild guess, since that is all you and I are qualified for.
But I stated it with the intent of pointing out that within the decade we may start to see a significant decline in oil availability in parts of the world.
I also think that in the post peak era that money will not be the only director of oil flow on the international market. The idea of preferred customers who support the exporters national interests will rise higher on the determination list.
For example, China will have a lot to say whether Europe gets (as) much oil from the middle east. USA will have an incentive to be a more respectful trading neighbor with Canada. Some places will still get enough oil, and some will start to have shortage- not just the poor.
There will be no choice but to tolerate the decline in petrol available for transportation.
Unless you have other ways to get around.
Hickory,
See
https://peakoilbarrel.com/oil-shock-model-scenarios-2/
Especially chart at link below
http://peakoilbarrel.com/wp-content/uploads/2019/06/blog190607p.png
I think it more likely that output will be about 80 Mbpd in 2030 for World C plus C, only a depression or fast transition to electric transport would lead to 74 Mbpd in 2030, I would put the odds at less than one in 10 that either of those scenarios will occur by 2030, perhaps by 2035.
Well for the sake of stability and gradual transitions, I hope you are correct, Dennis.
I was just throwing out a guess number, wondering what you and others thought.
A coordinated downward adjustment in demand could be orderly, but in reality the oil production beyond peak will be apportioned
-to the producing countries
-to the wealthy (nothing new here)
-to important uses- via government mandates/restrictions of some sort
This will leave big swaths of the worlds population on the very short end of the stick, and will make discretionary use of oil for the common person dramatically more expensive.
Hickory
Also, whoever is President at the time will be issuing a new permit for Keystone Xl
Historical growth and decline rates for world C C.
Lot’s of wiggle room as one can see.
Did the graph show up? It is only 38 kb.
Yea the chart can be seen. Thanks Seppo.
Ron
81 to 82 Mbpd.
Well, the average before the pandemic was about 82.4 Mbpd. Reaching 82 Mbpd would be a miracle. 81 perhaps but not likely. My estimate is 80 Mbpd at best.
The tornado alarm is going off here. If I don’t reply tomorrow you will know I was swept away. Oh, oh, it just stopped, so perhaps I am safe. 😉
Great work Ovi . You never seize to amaze .
In agreement with Ron . 80 Mbpd will be best that they can drag out of the rocks .
Hole in Head
Thanks
What will be World C C output in July 2022?
I guess it will be less than 80mmbpd.
WHY?
Oil supply is a function of both geology/reserves and capex. Only when you put the money in that you can get the oil out, that is self evident. Also obvious is the depletion of assets. If no capex were to be employed, supply will decline naturally. Or in other words, some of the capex is by nature maintenance capex – required to maintain oil flow at a desired level. However, when the reservoir depletion exceeds a point, no amount of capex will be enough to maintain production.
We all have different views of reserves and TRR.
Dennis for example believes in a much higher TRR number than Ron.
But, let’s come to capex. Let’s say that your production now depends on cumulative capex for the last 5 years. Large projects take upto 5 years to come online while smaller capacity increase/maintenance projects with an added well or two can take 9-12 months.
Standing in July 2022, the last 5 year cumulative capex is US$1,850bn. If I am standing in 2018, last 5 year cumulative capex is $2,800. Current capex (2020-21) is around $310bn per year – which is a run rate of $1,550 in a 5 yr period.
So, the question is – if 5yr capex has declined by a third since 2018, why would you expect the same amount of production as in 2018? Production has gotta drop, no? The quantum of drop might be in question but not that it will drop naturally as a result of the drop in capex.
And note, I haven’t brought the geology into the equation here. There is a very good argument that it is getting tougher to extract oil, not much has been found in the last 12 years exploration etc etc. I am just keeping my arguments to capex invested historically.
Ancient Archer,
The cumulative capex through 2018 had World output growing at roughly 1000 kb/d (for C plus C output which is my focus) the reduced capex will lead to lower rates of growth, but not decline, in my opinion, also note that capex can increase, part of the reason for the decrease in capex is oversupply of oil and low oil prices. Higher oil prices will likely lead to an increase in capex, I agree there will be a lag betewwn FID and output increase for some projects (Arctic and deep water) but onshore conventional, tight oil, extensions of existing deepwater projects have shorter lead times of 6 months to 18 months. OPEC has a lot of capacity that is not being utilized and can be brought back online and there is still a lot of capex being spent that can maintain output at the 2018 level. My guess is that by 2023 the World returns to the 2018 peak level (average annual output of C+C) and exceeds that level by 2024, peak expected in 2027/2028.
Update to shock model below, conventional URR=2800 Gb, unconventional=260 Gb which includes tight oil and extra heavy oil (API gravity of 10 degrees or less).
Dennis,
As you mention, extensions of existing projects are short duration and cost less money. But, you need to first invest big money in the project initiations – field developments and such. Once that is done, you can squeeze a bit more (EOR and such) and get by.
Couple of points:
1) You have to invest first in the major project and then EOR it later. If you don’t invest the big money initially, then there will be nothing to squeeze. My point is that a lot of the large capex decisions have been cut or postponed in the last 6-7 years. I can see that the 2014 capex was US$730bn while 2019 (before the pandemic) was already down to US$420bn. This cut through the years affected the large field development projects.
2) There is a limit to which existing assets can be further squeezed. Because the oil world (at least conventional) was short of capex money, they preferred squeezing existing assets – in fact that’s most of what happened. But assets run out of oil eventually, and I am fearing that after years of squeezing, there is not much juice left in the lemon.
Hence, my pessimism. It is not just that 2020/21 capex has fallen off a cliff to around UA$310-320bn but that it had already fallen off a cliff 2015 onwards and we were living on borrowed time. After the latest round of capex cuts, we will face issues in 2022 I reckon.
You also mention 1000kbpd of annual increase in supply that came from the capex before 2018. All of the increase, I mean all of it, came from US Shale. All the capex in conventional was spent just in keeping production flat. I think it can’t be managed now, not with the capex we are left with right now.
Ancient Archer,
I believe you assume capex will not increase, I disagree with such an assumption. I do agree there will be a lag for big projects, but think tight oil, infill drilling, EOR, etc will keep output rising slightly until larger projects can start producing. If not we will see a spike in oil prices in order to balance the market.
Dennis,
How much can you squeeze an already squeezed lemon?
Talking just about conventional here.
Not much more oil is going to flow from EORs, side-tracks, infill drilling and such after you have depended on these primarily for the last few years. At least, definitely less than has flowed in the past and most probably a significant deal lesser.
The big developments will take time, as you say. But where are the newly discovered fields to exploit for these developments? Not much has been discovered since 2002. The big one is Guyana and Hess and Exxon are falling over themselves to develop that. Not a lot of other exploitable resources methinks.
Ancient archer,
There have been resources discovered that were never developed, a fairly big chunk of these, perhaps those will never be developed, but sometimes high oil prices change things. NOCs are a black box, difficult to assess what their potential is.
The short answer, I am guessing based on estimates by USGS and other agencies that have access to information such as the IHS database that I do not have. We will have to wait and see.
USGS estimated 3000 Gb for World conventional oil in 2000. I use 2800 Gb. They have 1000 Gb for unconventional, I have about 220 to 260 Gb in my recent oil shock models.
Despite what many seem to think, my models are quite conservative. This explains why all of my past estimates have been wrong because they have been too low.
Perhaps this will not always be the case, time will tell.
Dennis , “NOCs are a black box, difficult to assess what their potential is. ” The biggest NOC Saudi Aramco is borrowing money hand over fist to stay relevant . They already bought back online the moth balled fields and are working with poison in Manifa . What potential ?
Anyway , what can they do if there is no more ” economical oil” to bring to the market , No wonder they talk about solar .
Dennis
Thanks. Even at 29,500 kb/d, that puts those eleven countries down by 2,500 kb/d. Over roughly 5 1/2 years, that is an overall decline rate of approximately 450 kb/d/yr, after allowing for increases in SA, UAE, Iraq and kuwait.
Ovi and Ron,
Note that I do not necessarily expect this will be as high as OPEC will go in the future.
Several OPEC nations have declined, but I always focus on 12 month peaks. Monthly peaks are not important in my view. OPEC output has indeed fallen mostly due to Venezuela and Angola with some smaller decreases from others. In any case World outlut is the key. My expectation for 2022 midyear is 81 to 82 Mbpd for World C plus C output. I expect World C plus C output to reach 84 Mbpd by 2025. Peak in 2025 to 2030 time frame with peak plateau over that period.
Algeria : I don’t see how they will increase significantly their production. Irak : possible, but the goal of the Iraqi regime is not to produce in order to produce but to produce in order to buy social peace with oil revenues and at the same time save oil reserves. Lybia : forecasting future levels of Lybian oil production is a hazardous task. Nigeria : given the recent past of Nigerian production, it is doubtfull that they will maintain their production. Saudi Arabia : if they feel able to get back to their production level between 2013-2019, roughly, why did they decide to launch a plan to reduce their domestic oil consumption by 1 Mb / day?
They earn money through exports, the subsidized domestic use is a waste. So they will attempt to reduce domestic use.
Best of luck to KSA on reducing consumption with an ever increasing population that has needs air-conditioning and desalinated water 24/7 . Oh forgot to mention the decline rates .
Hole in head,
Solar resource is excellent, would provide plenty of energy and would be cheaper than using oil at 80 per barrel.
Dennis, solar panels in the desert do not work because of the sandstorms and need for cleaning with fresh water in a water stressed region . Has been discussed here before .
HH,
India uses solar panels in their big installations.
Here a source if you don’t believe: https://www.nsenergybusiness.com/features/largest-solar-power-plants-india/
The background looks a lot like desert.
And they use robotic dry cleaners to keep the cells going, they are cleaned once a day.
You won’t install solar installations in a pure sand deserts – but lot’s of deserts are no sand deserts.
Eulenspiegel, in the desert, sand is not the problem, it’s the dust. I lived for almost five years in the desert of Eastern Saudi Arabia. The sand desert of the Rub Al Khali was well to the south. But nevertheless, I lived in the desert, a packed hard dry dirt desert. The wind blew mercilessly and the dust was ever-present. Dust would collect on the power line insulators and then the dew would cause arching. They had water trucks that wash them with pulsating water streams every few days. I can imagine solar panels would have a similar problem.
Hole in head,
Yes I was not convinced. Sand storms happen of course just like snow storms, but not 100% of the time.
Water can be used to clean panels, and collected and recycled, this is far from rocket science. Their solar resource is huge, problems are not difficult to solve.
“solar panels in the desert do not work ”
Haha- Keep believing Hole.
And the world is flat.
Sometimes factual information is useful… even if it clashes with belief?
https://www.eia.gov/todayinenergy/detail.php?id=39832
note- the high Capacity Factor [CF] recorded for the desert region solar installations shows how well they are performing in the real world. CF measures the actual annual output of any electrical generating facility in relation to its theoretically maximum if running 24/7/365. The biggest factors that reduce a solar facility CF are nighttime and clouds. Dust, ash, sand and bird poop also have their effect, but overall- the proof is in the pudding, as the data shows.
@Ron,
If you have solar panels in a desert, you can order a cleaner here:
https://www.indiamart.com/shrijasolarglassshield/solar-panel-cleaning-machine.html
You can buy it already – this problem is solved. No water dust cleaning robots. Normally they run once a day because of the lot of dust in deserts.
Or when you have only a rooftop installation, here the small version:
https://www.pv-magazine.com/2021/05/25/water-free-portable-cleaning-bot-for-rooftop-solar/
You can use a web app to supervise it. No water needed. It has a solar powered loading box you can install on the roof to keep it going.
Putting up solar panels in the desert is not simple . Read about this abandoned project about high speed rail in KSA . When the rubber meets the road then you know how good the tires are .
https://english.elpais.com/elpais/2015/02/04/inenglish/1423052376_326956.html
And then events happen that you have no control over .
https://www.saurenergy.com/solar-energy-news/april-17-killer-storm-hits-bhadla-solar-park-too-as-developers-count-damages
The solar plant in India is built on a dried lake / river basin of old . The ground and surroundings are not sandy but hard like the ground would be after a drought . The best translation from Hindi would be “caked ground ” . In KSA they would have to use cement slabs to put up the panels to prevent them from shifting as the rail project has shown . Most important , not only has electricity to be generated but also transmitted . So get the transformers , wires and towers and the roads etc . Just because it is technically possible does not mean it is economically feasible . Many a slip between the cup and the lip .
JFF
After all of that speculation, I expected to see a prediction tout de suite.
That’s why:
1/10/2019
The Attacks on Abqaiq and Peak Oil in Ghawar
http://crudeoilpeak.info/the-attacks-on-abqaiq-and-peak-oil-in-ghawar
OPEC officials heard from industry experts that US oil output growth will likely remain limited in 2021 despite rising prices,
While there was general agreement on limited US supply growth this year, an industry source said for 2022 forecasts ranged from growth of 500,000 bpd to 1.3 million bpd
The forecasts for 2021 were for average output to be close to 200 kb/d. The 1.3 Mb/d prediction for 2022 is out to lunch. The 500 kb/d has a chance but I think the average will be closer to 350 kb/d.
https://economictimes.indiatimes.com/markets/commodities/news/opec-told-to-expect-limited-us-oil-output-growth-for-now-sources/articleshow/83639450.cms
Ovi,
What is your expectation for oil price in 2022?
Based on what I see now I think an average Brent price of $80/b in 2021$ is likely.
If that is correct I expect US output will increase by 1000 kb/d over 2021 levels, this would be the Dec 2020 to Dec 2021 increase in US C plus C output.
Note that I expect US tight oil output to rise about 300 Kb/d from current level to Dec 2021. So the total rise from April 2021 (last data point) to Dec 2022 for US tight oil may be around 1300 kb/d assuming we see continued rise in Brent oil price to $80/b by Dec 2021 and then average Brent price in 2022 of about $80/b.
Typed incorrectly 2 comments above(638 am), meant to say 1000 kbpd tight oil increase from Dec 2021 to Dec 2022.
Dennis
I think WTI will be $85 plus/minus $5 in mid 2022. This will push the average price of gasoline slightly above $3/gal. As for output, the US will add somewhere close to 300 kb/d average in 2022 over 2021. I am betting on some restraint on the part of the drillers. The Permian is the pivotal basin and I see that the early results for 2021 wells are not as good as 2020.
The big unknown for me is: What is a sustainable price for WTI, $100? At what point does gasoline suck too much money out of the economy. Once the economy starts to slow, oil demand will slow. We can all remember 2008.
If WTI crosses $90, OPEC might start to worry. However will they have the spare capacity to try to control it? Six months from now we can revise our estimates.
Ovi,
Your big question is, is $100 a sustainable price for WTI or what is the sustainable price of WTI?
I have never understood why people behave as if oil ever goes to $100, the United States of America will stop. Absolute dead stop.
A couple of points for your consideration.
1) Historical prices
WTI averaged a bit below $100 from 2011-early 2014, a period of 3 1/2 years. Brent at that time averaged $110. The world didn’t stop as far as I remember.
Take into account the inflation and the increase in personal disposable incomes over the last 10 years. US gdp per capita in 2011 was $50k. It increased 30% to $65k in 2019.
Hence, $100/bbl in 2011 should be equivalent in terms of the customer wallet to $130 currently.
And remember, the world (and the US) was okay with those prices (i.e. the world ran didn’t stop) for 3 1/2 years. If the adjusted level ($130) is reached again – and that is nearly the double of where we are now in terms of the WTI/Brent price, I don’t see why the world will suddenly stop!
2) Current prices comparison across markets
Let’s run a comparison of prices of gasoline in the different markets along with the paying capacity. Gasoline is $3.05 in NY state. It is £1.40 per litre in London and INR 103 in Mumbai. That comes to, in terms of USD/litre: $0.93/lt in the US, $2.10/lt in UK and $1.50/lt in India.
Hence, people in India are paying 50% more at the pump for gasoline and people in the UK are paying more than double.
Now let’s compare the ability to pay by comparing the GDP per capita: $65k in the US, $42k in the UK and $2k in India.
So, people in the UK are paying more than double for gas while simultaneously having 35% less income. If I adopt that ratio of price of gasoline to GDP per capita, WTI price can go to: $72*1.35*2.1 = $204. Let’s round it down to $200. This means that if WTI went to $200/bbl, the avg American will pay the same at the pump as a proportion of income as does the average Briton NOW.
I won’t perform the same calculation for India vs the US because that will lead to a ridiculous result. A country that has 3% of the GDP per capita of the US is paying 50% more than the US at the pump.
These two countries (UK and India) are just examples of how much the rest of the world pays for oil. And how, even at those elevated prices, there is still demand for oil and the economies still run. The US has one of the highest per capita GDPs in the world and one of the lowest prices of gasoline at the pump. They can pay a lot more, the evidence shows.
How did you come to the conclusion that WTI price won’t be sustainable at $100?
In order to equal the $/mile of electric vehicle in the USA gasoline would have to be about 1$/gallon.
What price of crude could give gasoline at $1?
On oil price, there hasn’t been a time until just recently where major oil companies have announced they will be producing less oil in the future as a goal going forward. That hasn’t happened in the industry’s 150 plus years.
Likewise, there hasn’t been a time until recently where future demand projections have been for demand to decline over time.
These facts result in tremendous uncertainty and volatility. I argue these facts will have a major impact on the world economy.
I really do think we could see prices above $200. I also believe we could see prices as low as $25. Both WTI prices. Could even happen in the same calendar year.
shallow sand,
doubt we see it the same year unless there is a severe shock like WW3, Great Depression2, another pandemic, or other catastophe.
If oil producers choose to produce less because of high risk, then oil prices will rise, this will tend to accelerate the transition to alternatives to oil, difficult to guess how rapidly that might occur.
I still think higher prices through 2030 are likely (though I doubt $200/bo, perhaps $150 ), by 2030 to 2035 I expect demand may begin to fall fater than supply and prices might fall pretty rapidly. This is where it is possible we could see prices go from high to low rapidly, especially if there is also a supply or demand shock, depression or major war.
Difficult to know how it plays out, probably not a smooth ride.
ANCIENTARCHER
My basic question was “What is a sustainable price for WTI?” Unfortunately I added in the $100 as an example. I was looking for someone to bring together some economic info to get some idea of what sustainable price would be.
So thanks for the info and comparisons. We just might see if the US and world can sustain $200/bbl.
It is not clear to me that one can compare the price of gasoline between countries. Do the Brits travel 100 km to 150 km from the suburbs into London. More than likely they have access to a an excellent regional transit system and paid medicare. Not clear to me how much of their income goes to gasoline relative to a US consumer. Same for the other countries.
Thanks Ovi!
The average Brit here in the UK doesn’t travel as much as the American – I can say that having lived in both countries, though in the US I lived in NYC where I didn’t need to drive at all and drive a little bit in London.
However, consider that the average Brit is earning 1/3rd less than the avg American at a gross income level. Yes, (s)he gets (apparently) free healthcare from NHS but that is not entirely true. We pay it through taxes here which are higher in the UK than in the US. House prices also tend to be a bit higher in the UK as are basic utilities and necessities like food.
If you consider net disposable income that is available after taxes, rent/mortgage, food etc, the American should be substantially better off – maybe having close to 2x the disposable income of a Brit.
We can perform the same calculations for the rest of the developed world and we will be at a level closer to the UK than the US, in terms of disposable income vs the US and actual price of petrol at the pump.
There is no doubt that Americans are paying far less than anywhere else in the developed world in terms of the absolute price of gasoline. If you take the higher disposable income of Americans in general (gross income for Americans is substantially higher and taxes are lower than almost any other large developed market though for the others healthcare is covered from a part of the higher taxes) then the gap between what the Americans are paying and what the rest of DM is paying widens even more.
I believe $150-200 should be sustainable in the US, though at the higher end of the range, it will begin to depress demand.
$150-200 is what I am predicting a couple of years down the line i.e. 2023
Ovi,
2008 was a credit crisis due to poor regulation of financial industry, oil prices had very little to do with GFC, see “The Big Short”.
I also remember 2011 to 2014 with average Brent price of about $110/b over that period in 2019 US$, The World real GDP growth rate over that period (using market exchange rates) was about 3% per year.
Basically $100/bo for Brent (say $95/bo for WTI) is unlikley to be a problem, note also that as a percentage of current average World real income (essentially equal to real GDP) that $100/bo will be less today because real GDP has grown by much more than oil use over the 2014 to 2019 period. (I assume oil use will return to at least the 2019 level by 2022).
I see your 300 kb/d growth in US output as a minimum, something that would be achieved at $60/bo for WTI, currently WTI is close to $70/bo and likely to be $78/bo by the end of 2021 ( the Brent/WTI spread had dropped to $2/bo from a typical $5/bo when tight oil was booming).
I expect the average completion rate in the Permian basin will return to over 450 completions per month by mid 2022. Permian output would increase by about 600 kb/d in this scenario, I expect other tight oil basins may remain at flat output at these prices as well as GOM, conventional might also be flat at these higher prices in the US so overall a more reasonable guess would be 600 kb/d increase from April 2021 to Dec 2022, less than I had previously guessed over the weekend (I didn’t have access to my models so it was more of a guess than usual).
Scenario below for Permian basin assumes Brent goes to $80/b by Dec 2021 and remains at that level until 2032 and then oil price gradually declines to $25/b in 2075. No wells completed after 2041 in scenario, peak about 5500 kb/d in 2030, URR=45 Gb with TRR assumption of 75 Gb and 125 thousand total horizontal tight oil wells completed from 2008 to 2042, about 32000 horizontal tight oil wells have been completed in the Permian basin through April 2021 based on current well profiles and output estimates. The average Permian well is assumed to have an estimated ultimate recovery of 370 thousand barrels over an 18 year well life as of Dec 2019, well productivity is assumed to decrease after dec 2019.
this scenario assumes no more than 500 wells per month are completed after 2020 which assumes tight oil producers remain disciplined on their capital spending, to me this seems like a minimum output if the USGS mean TRR estimate of 75 Gb for the Permian basin is correct (oil pros doubt this is a reasonable estimate). A scenario using the low end USGS estimate of 44 Gb for TRR would yield perhaps a URR of 30 Gb (a guess as I have not run that scenario recently).
I have run the Permian scenario with lower TRR of 44 Gb, similar assumptions to earlier “mean TRR scenario” see below, URR of 27 Gb, I expect this is the minimum output we would see from the Permian basin, but I think the URR=45 Gb is more reasonable.
Dennis
Regarding the 2008 GFC, the banks through their mortgage policies literally created a house of cards. Something had to trigger the collapse of that house.
I think the high price of oil did it because too much was spent buying gasoline at $4/gal to $5/gal. I recall seeing pickup truck owners on TV complaining about paying $250 to $300 to fill up their truck. I think this lead to mortgage defaults, which then brought down a small bank and then Lehman Brothers and the other banks followed.
I just did a search and found this. Did the Oil Price Boom of 2008 Cause Crisis?
https://www.wsj.com/articles/BL-REB-4141
My 300 kb/d was an average for the year so it implies a 600 kb/d increase from January 2022 to December.
I think the projections made by Dennis are very useful.
He is the first to acknowledge that they are looking into the future, and thus will not be what specifically happens when we get there.
However, they give a sense for what may be possible given the various assumptions.
I think of it as what could happen if all the stars were aligned for optimal (desperate) LTO production.
If the country was desperate for transportation fuel (for example there was very little electric vehicle deployment- like the current status), then the price will be very high before long and even McCombs Bar B Que House in Rankin will be busy serving it up.
Credit (from thin air) will be extended to drillers by somebody.
Wont happen Dennis unless the New consolidated companies double the rig count. The new average well which is a child well IPs are roughly 60% of the parent wells. You may even see production decline. The Shale’s best days are behind us.
Also companies who pay dividends will have trouble growing organically. Look for more consolidation.
The future development of HZ tight oil in the US is only remotely dependent on product prices; credit/debt will continue to play a paramount role. As will regulatory matters, public sentiment and groundwater, groundwater and groundwater. Wells that decline 85% in the first 32 months of production and that can only dribble out 35%-40% rates of return over 15 year periods do not generate sufficient cash flow, fast enough, to NOT require credit/debt, particularly now in the face of $300B of public and private legacy debt. The Permian Basin is still adding debt, not paying it back.
THEN there is the matter of Mother Nature. In the end, She ALWAYS gets Her way:
https://www.oilystuffblog.com/forum/forum-stuff/the-heart-s-of-the-permian-watermelon
LTO survivor,
So far there is little evidence that average new wells are lower in productivity by looking at the data. See
https://shaleprofile.com/blog/permian/permian-update-through-march-2021/
Chart below has average cumulative output from Permian basin tight oil wells that started producing in 2018, 2019, 2020, and 2021.
The important factor is the frack spread count, rig count will increase as needed, perhaps it will need to double.
I suppose you believe the 27 Gb scenario based on USGS F95 TRR of 44 Gb is also too optimistic?
Cumulative output plus proved reserves for Permian basin tight oil is about 17 Gb, what is your expectation for Permian basin tight oil URR?
Dennis , “The important factor is the frack spread count, rig count will increase as needed, perhaps it will need to double. ”
Do you believe this will be done ? Maybe the “oilmen” will interject ?
Not true, as this person actually operating HZ tight oil wells in the Permian would know, of course. When normalized for lateral lengths and proppant loading per perforated foot well productivity in the Permian has been falling since 2016.
Dennis, from your link
“As is visible in the chart on the right, wells completed in recent years are trending towards somewhat lower ultimate recoveries per 1,000 ft of lateral length”
Permian well productivity does appear to be past its prime, as is Bakken and to a much greater extent Eagle Ford. Seems unlikely they will be able to flog this dying horse much harder…
Stephen Hren,
I agree that it has been decreasing, but not by 60% as indicated by LTO survivor. I do not have access to lateral length data, I take the output data reported by shaleprofile and estimate well profiles for 2010-2012 wells (single well profile estimate) then one for each year from 2013 to 2019. From 2020 tnto the future I assume well productivity decreases in my model.
Chart below shows the assumed decrease for average new well EUR for the 45 Gb Permian scenario I presented somewhere in the thread. The rate of decrease varies depending on number of wells completed per month.
Mike,
It has been falling when normalized by lateral foot, but not by 60% as LTO survivor suggests above. I do not have access to the normalized data.
The post I linked from shaleprofile shows a slight decrease in cumulative production in chart below, perhaps as much as a 12% decrease, all wells are still well above the 2015 average well, and I expect we will see continued decrease in productivity per 1000 feet of lateral length.
I assume in my models that productivity starts to decrease in Jan 2020. I use actual output data for wells that started producing in 2019 and assume an average lateral length of 10,000 feet (which overestimates actual length) so the acres per well I use is also an overestimate for the average well (10000 by 500 feet) roughly 250 acres per well. My well profile (estimated on limited well data last year) has output ay 16 months at 179 kb cumuative vs actual average output of 188 kb (based on shaleprofile data). Despite what you believe my estimates are relatively conservative the 2019 average well has an EUR in my model of 375 kbo and pays out at 35 months for a 10 million dollar well at a wellhead price of $60/b for crude, and $1.50/ Mcf for NG. Cost per barrel of oil(OPEX) over life of well is $13/bo, EUR for NG is about 300 kboe (5800 cf/b) and cumulative NGL is 122 kb sold at 25% of price of oil.
forgot chart, sorry
LTO Survivor,
Anything is possible, it will depend on frack spreads and horizontal oil rigs operating. Based on rig count alone and assuming it does not increase or decrease in the future, Enno Peters model has Permian supply increasing.
What has been happening to rig count in the Permian basin?
Seems the horizontal rig count from Sept 2020 to June 2021 has been increasing at a rate of about 150 per year in Permian basin. Currently about 228 rigs are running and in Sept 2019 about 380 rigs were running so we need about 150 more rigs to get back to Sept 2020 levels when drilling was near its maximum in the Permian basin. If the rate of the past 9 months continues for another year we will be back to 380 rigs, the frack spread count may approach its March 2020 level (when output was at a peak in the Permian basin) sooner, perhaps by late December 2021.
The completion rate is more closely correlated with frack spread count, the problem is that I don’t have the break down of number of frack spreads by basin as is the case for rig count.
typo above, I wrote maximum in Sept 2020, should have been Sept 2019 and assuming 6 month lag between drilling and first flow, the max output ends up being March 2021.
Mike
If you are around I would appreciate your thoughts on this P&A blowout.
https://twitter.com/sand_frac/status/1405312730282840070?s=19
As a matter of fact, there will be less of this due to the financial discipline of oil shale producers. But this is one the reason why fracking has been forbidden in France. By seeing what was happening in USA, people prefered to forbid this instead of experimenting it themselves.
To avoid drama amongst the anti-oil crowd here, I have answered your question the best I can, here:
https://www.oilystuffblog.com/forum/forum-stuff/red-bucket-well-control
Mike, please don’t worry about upsetting the anti-oil crowd. I do that almost every day. Don’t get me wrong, I know climate change is a very serious problem but those who believe that problem will be solved by renewables are living in a dreamland.
The climate change problem is just not solvable. I know, every little bit helps but we are headed for a much warmer world in the next few decades. And we will never get rid of oil until it is all gone.
Perhaps not for those who have 85% of their electricity produced by nuclear power.
JFF , yes , but they have another problem . How to dispose of the used nuclear fuel rods ? Life is full of unintended consequences and how to dismantle the past of expiry date reactors . 😉
No problem–
In 24,000 years they will reach a half life.
How were things 24,000 years ago?
Well, we have a specialized factory for the retreatment of the used nuclear fuel rods in La Hague in Normandy. Ideally, we should build a fast neutron reactor in order to significantly reduce the half-life of minor actinides by transmutation. This would facilitate the management of these nuclear waste because their storage time would be of the order of a century. Therefore, the people won’t have any difficulties to understand the instructions to manage the storage facility. About the dismantling of the nuclear power plants : that’s not so difficult. What is the main challenge is the dismantling of the reactor vessel. The rest has already been done for a few facilities such as superphenix. Simply, it will cost money. So, I imagine that the retirement plan is going to be planified carefully.
JFF , not all fuel rods are handled by the Normandy facility . Many are sent to a unit in the UK , I think it is called Hinckly point or Hincky Point . Dismantling of power plants is no kid stuff . I have been witnessing the dismantling of a small thermal power plant 20Kms away from my place . It is ongoing since the last 5 years . As to dismantling nuclear plants ,you have answered the question ” it is costly ” and the power industry is broke . They have been kicking the can down the road for the dismantling of the Doel and Tihange power plants in Belgium since the last 10 years . Both the plants have cracks in the cement casing verified by IAEA and have ongoing breakdowns which is leading to a capacity utilisation of about 65-70 % . By the way they are operated by the French power corporation . They keep on changing the name as they go thru M&A to keep solvent . Black hole for the government . It was called Electrabel, then GDF Suez , then Aviva , now Fluvius . Heck ,not much can be done . There are hundreds of nuclear installations around the world , how many can the system take care off . Chernobyl and Fukushima were close calls . Keep the fingers crossed and pray nothing bad happens .
The US had the integral fast reactor program, a superb bit of engineering that burned (as fast reactors do) the long lived problematic transuranic waste products that thermal reactors produce. It was demonstrated to be walk away blackout safe. Reprocessing was done on site (hence ‘integral’).
Fission products decay in 500 years or so to some quite valuable metals. 500 years of containment isnt a huge problem.
https://issuu.com/johna.shanahan/docs/110101_plentiful_energy_by_charles_
The program was shut down by John Kerry.
All those skills dissipated and perhaps lost.
IanH , you said ” Fission products decay in 500 years or so to some quite valuable metals. 500 years of containment isnt a huge problem. ” Valuable metals are not fission products .
I seriously hope you are not serious .
Thanks Mike.
Thanks Mike I will head over.
Currently some countries import more energy than others.
Net energy (including all sources, not only oil) import by country is shown here in the link
The value listed is % of the total energy use of the country, with Ireland importing 86% for example.
This table is from 2014 data.
Wonder what has significantly changed since then
https://www.indexmundi.com/facts/indicators/EG.IMP.CONS.ZS/rankings
As oil price stays above $70/barrel, most shale will come back. However the max reached by USA was 13,100 million b/d. So whether World will hit 75 million b/d is doubtful. But NGL keeps increasing because of increase in natgas output. Besides nearly 6 million b/d that comes from CTL, GTL and bio-fuels will keep overall oil consumption above 100 million b/d.
Despite rapid increase in electric vehicles, oil will hold above 100 minion b/d mark.
Ted , demand is governed by price and availability . Demand of 100 mbpd is immaterial if the supply is only 80mbpd . Shale is not coming back . USA has peaked . Period . The peak in shale was (is) the peak of oil production in USA . I have commented earlier that ” all liquids ” is BS . The 6mbpd of NGPL ,CTL , GTL etc. are just ” fill in the blanks ” . These are not transportation fuels and have 65% of the BTU of crude .
Hole- Hydrocarbon Gas Liquids are nothing to belittle. It is a lot of energy-
“HGLs accounted for over a quarter of total U.S. petroleum products output in 2018”
https://www.kindermorgan.com/getAttachment/babe6db9-ba7a-4f51-a100-5fd46b944540/White_Natural_Gas_Liquids.pdf
Hickory,
NGL has about 70% of the energy content of a barrel of crude. In addition most uses for HGLs are not for transportation which is the the main use for crude plus condensate.
As Ron has said we don’t count bottled gas. I would say NGL should be put in a basket with natural gas.
Or we could define liquid petroleum as that which is a liquid at 1 atmosphere pressure and 25C aka STP.
By that standard only pentanes plus would qualify, which makes sense as it is essentially condensate, the proportion of pentanes plus in the US NGL mix is less than 12% by volume, 2020 data (582
kbpd).
Might not count it, but it is far from trivial. If all you had was wood and coal, and then came upon some NGL’s you would feel extremely fortunate. Its only because of the incredible energy abundance of oil that we don’t get all excited about NGL’s.
Ted,
When world peaked at about 83 Mbpd in 2018, US output was about the same as it is now, about 11 Mbpd. Iran, Iraq. Canada, Brazil and Norway can all produceore in the future than they produced in 2018, and US can likely pruduce 12 Mbpd, though I think the US may be past peak for crude plus condensate output. We ignore th NGL output here because most of that is not used for transportation which is the bulk of liquid petroleum liquids use.
Propane , butane, and ethane are mostly used for heat. Lighters, plastics, and other chemical industry inputs.
Dennis , 2021 is not 2018 . In between we had a black swan they call Covid 19 . You discount that and presume it is BAU .
Hole in head,
I take that into account in more recent projections. The oil not produced remains in the ground and can be produced at a later date.
Now if your prediction of 25 dollar per barrel WTI in 2022 proves accurate then your output prediction would also be correct.
I think you will miss the mark on oil price.
Pretty sure 75 per barrel will be a bit closer to the mark. 😉
Dennis, my year for $ 25 is 2025 . You can check . I had already said that before we reach the price there will be spikes but these spikes will not be sustained . Still 4 years to go .
Ok.
If you make it 2035, we will definitely forget. 🙂
We will see what it looks like in 2025. So I do agree prices will be volatile, the average for the year is really what pays the bills. My guess for 2022 is $75/bo for the average WTI price, what’s yours?
I am expecting prices a lot higher in 2022. An average of $85 would not shock me at all. They will be higher because oil production will not fully recover to the 2019 level as everyone expects it to.
The EIA Short Term Outlook has production fully recovered by the end of 2022 and total liquids about one million barrels per day higher for non-OPEC.
Dennis 2025 is 2025 . In my view 3 years forecasting is an informed guess ,5 years is stretching your luck and beyond that is shooting arrows in the dark .
This year the average will be $75 . In agreement with you .
hole in head,
I just need to remember 25 in 25. 🙂
Ron,
I agree on your guess for price, I think of $75/b as a minimum I would expect, 75 to 85 per barrel seems a reasonable range for an average annual WTI price in 2022, at least to me.
China will be in outright contraction demographically speaking within 3 years. Oil demand will be headed lower as old people don’t do as much as 20-35 year old’s. I’d have to check again but average age in China is about 43 currently. Chinese economy is based on a pile of leverage/debt that looks like a 110 story building. In comparison US would be like a 20 story building. Whatever people are taught to believe about US having a debt problem it’s far worse in most places you look. I’m talking total debt to GDP. Europe, China, Japan, India, Turkey, Brazil, Canada pretty much everywhere you look is worse off than the US.
The credit market makes everything go. Be it your talking about stock prices or oil production. Largest single source of credit in the USA is the pension funds. And they have to have a 7% return on capital to meet obligations. Which is why pension were at one time heavily invested in US shale oil debt.
Right now this is how the capital structure in the US works. Pension funds buys corporate bonds. CEO of company uses those funds to repurchase his or her companies stock so he or she can get paid via stock options. Does matter one bit if it makes economic sense or not. Valuations are distorted beyond belief.
Capital structure can and will change in the future as benefits paid out to retires takes capital away from corporate debt. There is going to be a draw down at some point.
Inflation is already a problem. Can the FED really step in a do whatever it takes including buying stocks and corporate debt to make everybody whole and not make the current inflationary problems worse?
We get another oil spike that goes above $120 maybe above $147 and the asset bubble that was created by low interest rates and QE pops.
I don’t think congress can pass anymore spending until price inflation comes down a good bit. So no Green New Deal or any other spending is likely anytime soon. They’ll keep talking about it but it just won’t happen.
We got a pullback in the stock market last week. What i expect to happen is. Maybe it last for another week maybe not. And CEO’s will use it as a buying opportunity to ramp stocks higher. And oil will go higher right long with it.
Because everybody know as long as the stock market goes up it means all is well and the economy can handle higher price oil and everything else. 🙂
HHH , a gem of a post . An absolute out of the way all of us think . Not all is supply /demand , currency etc . A new angle of demographics . I have in an earlier post said that we are facing a confluence of 3 E ( Energy, Economy, Ecology ) and 3D (Debt ,Deficits ,Demographics) problems which are insurmountable as their cumulative effect is more than what the current system can adjust to. Keep commenting . Greatly appreciated .
Yes, the chinese population will shrink.
Western population will grow, with accelerating speed. Woke culture in all old industrial western countries leads to an open border policy growing population – with random immigration. Social benefits will feed these not able to get a job. That’s a growth industry here in Germany already, leading to an real estate boom and state driven boom (The state must give the rent for an apartment to anyone here being able to spell the word “Asyl”).
I still don’t see this market crash. Even when the FED talks about tapering in 2 years as last weeks, stocks are warning. They even didn’t anounce DOING something.
This will crash, as every bubble crashes – but the crash will get up. The FED can’t taper. People will lose confidence in money and (try to) sell these bonds and (try to) buy anything valuable. 1922 was an extreme busy year for the German stock exchange, after 1923 they had to print new money. And since all big currencies are coupled and intertied, all big countries will have this the same time.
After this, the debt is gone – together with pension fund money and insurance money.
I know this mood with colleagues already. Everybody owning a house goes for the big repairs or improvements, other try to buy one or at least start buying gold and real estate funds. Younger buy stock and bitcoins. The money starts moving.
In fact, China’s population is probably already shrinking.
https://www.ft.com/content/008ea78a-8bc1-4954-b283-700608d3dc6c
What matters for oil is not a miniscule drop in China’s population, but the ongoing rise in Chinese
living standards, car ownership, air conditioning, and petrochemical use. Also air travel. All of these
are booming and leading to a million b/d rise in Chinese oil consumption every year. Same for India. Another several
hundred thousand b/d increase every year.
What is important is rising living standards for 1.5 billion inhabitants. Between China and India nearly
3 billion. The rest of the Asian countries like Indonesia, Phillipines, Vietnam, Thailand, add many more
hundreds of millions whose living standards are also rising. And they all want more convenient oil
energy for their cars, motorbikes, rototillers and tractors. That is what will collide with peak oil.
And electric vehicles will not make much impact.
In the end, the gas tanks of Europe and America may
shrink to supply the hunger for oil in Asia. Their marginal value product from oil consumption is much higher than in the OECD. Just how steep is Seneca’s cliff. We may
soon find out. jmho pilot
One tends to overlook that population is rising by 80m (sic) souls per year.
Question: is the number of FF-powered vehicles still increasing? Are EVs even keeping up with demand from the 80m reaching driving age each year?
Ok – many in poorer countries, with low vehicle ownership. Perhaps motorcycle sales are booming?
And on a similar theme, giving internet access to everyone via these new satellite constellations will cause a big increase in supporting infrastructure – phones, computers, batteries, solar panels, etc. – along with the desire to travel and to buy all those goods on Amazon, from the remotest areas of the shrinking Amazon.
I do not see this ending well.
https://www.businesstoday.in/current/economy-politics/pandemic-perils-push-32-million-indians-out-of-middle-class-pew-research/story/434235.html
Pilot , you said “What matters for oil is not a miniscule drop in China’s population, but the ongoing rise in Chinese
living standards, car ownership, air conditioning, and petrochemical use. Also air travel. All of these
are booming and leading to a million b/d rise in Chinese oil consumption every year. Same for India.”
Get the info correct . India is now 60% below or at poverty line which is $ 2 per day .
Hole in head–
India has one of the largest middle classes in the world–some 300 million people– who
all want cars and other modern conveniences. This is more middle class people than
either Europe or North America, and is exceeded only by China. Yes there are a lot of
very poor people in India. But even they has rising living standards. But the middle class
is using more and more energy, especially oil.
Pilot , I have provided this info earlier but maybe you missed out so once again for your rethinking and coming to an appropriate conclusion .
India ; Total population 1300 million (1.3 billion )
50 million rich and ultra rich : Own the house + vacation home in the hills for summer . Vacation in Europe /USA or any other exotic place to talk about . Kids in Yale, MIIT, Oxford . Cars for each family member with chauffer . Brands BMW , Mercedese , Lexus .Clothing Armani/ Versace . For health problems prefer to go to USA . Drinks only Scotch or Fosters beer (Aussie) . They cannot create demand like the 1% in USA . Saturated .
100 million upper middle class : Own the house but no vacation home . Vacation in Singapore , Bangkok, Dubai, Maldives . Kids in the best college of India . Cars for the parents and mobike for the kids . Car brands Hyundai, Suzuki . Clothing high end local brands . Health care in private hospitals . Drink best high end Indian brands . Comfortable . Not much aspirations and so no additional demand . House Full .
200 million lower middle class : Own house but mortgaged . Car but with a car loan . Vacation domestic only . Kids in medium level college but aspire to be in the best college . Clothing local . Skinch on health care to save for the future . This is the aspirational class . They want a better lifestyle and a better future for the kids . They want a car for their kid , an A/C in each bedroom and other goodies . Unfortunately the 35 million (add 20 million of the first wave , total 55 million) who got downgraded from the “lower middle ” to the ” upper poor” . The rest of the 150 million have gone into absolute saving mode fearing that the same future awaits them . Zero demand creation .
150 million migrants with no fixed address . They keep moving from village to city and city to city . These are vegetable vendors , food stall vendors, daily labourers . Only survival mode .
800 million (60%) already explained above .
Yes as you said “all want cars and other modern conveniences. ” , the problem is the aspirational class is dying . The living standards are falling and not rising . Increased inequality .
That is why energy(oil ) demand will remain flat ( cars/trucks already on the road will burn gas/diesel) or decrease in the future . Growth in energy demand is a no .no .
Some info off the point . Capacity utilisation of industry is at 65 % since 2018 . No demand indicating lower living standards . The poor cannot even buy kerosene for cooking and now scavenge for wood or use cowdung cakes .
The truth ,nothing but the truth .
BP releasing bible 8 July
Exxon is on the back foot .
https://www.zerohedge.com/markets/exxon-fire-10-white-collar-workers-next-3-5-years
Hickory, to answer your question above, the last time gas was at $1 per gallon was 1976 with WTI at about $13 per barrel. At least, according to the chart at this link.
https://inflationdata.com/articles/charts/gasoline-crude-oil-prices-chart/
Also, US average fuel cost per mile is $0.12 for gas ($3.07 / 24.9 mpg).
For EVs it’s about $0.03 per mile using US average of $0.13 per kWh). Or $0.06 using CA’s $0.26 per kWh). This assumes 4.0+ miles per kWh. Here’s a list of 14 (mainly EU available) cars at or above that efficiency…
https://www.carwow.co.uk/blog/most-efficient-electric-cars#gref
PS Here in the UK my car costs $0.23 per mile in fuel; coincidentally my electricity is also $0.23 per kWh.
@John Norris:
UK annual subsidy for an EV doing, say, 10,000 miles per year, amounts to some £2,000.
This is made up of just 5% tax on electricity, compared to £0.80 per litre for petrol/diesel. I.e about 60% at a pump price of £1.30 per litre.
Then there’s zero vehicle excise duty for a battery EV, and a new vehicle subsidy of £2,500 for cars less than £35,000, down from £3,000 last year.
You can add things like reduced or zero congestion charges, and low emission zero charges. Also reduced parking costs in some places.
It all adds up to EVs being subsidy-soaked. This will have to change.
Will have to change when the number of EVs increase. Look at China and see what happened to the EVs sold when they removed some of the subsidies.
Why will the subsidies have to go?
Hey because someone has to pay for the roads and replace the tax that the petrol users were paying. That tax goes somewhere, mostly for the upkeep of the transport infra. The EV users use the infra but don’t pay for it. Can’t go on for ever. someone has to pay, rather those who use it have to pay. eventually.
And on top of it, when EV sales increase beyond a certain number, subsidizing EV purchase will lead to a higher burden on the govt.
Eventually, EVs will be taxed (probably on miles driven to pay for the usage of the transport infra) not subsidized.
Chinese EV sales are going through the roof, so I’m not sure what event you are referring to.
Shale oil and gas fraud: A sign of a peak in oil supplies? Bold mine.
Those of us who watched incredulously as investors shoveled more and more money into what we were sure were money-losing shale oil and gas drillers do not find the current spate of fraud lawsuits against these drillers surprising.
The gargantuan claims about shale hydrocarbon reserves—which were compared more than once to those in Saudi Arabia—were clearly designed to woo investors into bidding up the stock price and/or hoovering up the constant stream of junk bonds emitted by the shale oil and gas drillers. The hype succeeded for a long time, even during the crash in oil prices in 2015 and beyond when investors convinced themselves that they were picking up “bargains.”
It wasn’t until the pandemic-induced plunge in oil prices that the reality of those outlandish claims was revealed, and many companies disappeared.
But this story of fraud and exaggerated claims is much more than a legal story. The large production gains that did take place in American oil fields had people believing America would be or already was “energy-independent,” a phrase that meant the country would not be a net importer of energy resources. Though U.S. dependence on imported energy resources did decline, it didn’t reach zero until the pandemic dramatically crashed U.S. oil demand below U.S. production. But as the world and U.S. economies rebound, that dependence is almost certain to return as the so-called “shale miracle” turns out to be something less than miraculous, bankruptcies continue and reserve estimates come back into line with reality.
But the fallout extends even further. The U.S. oil boom was the principal source of increased world production for most of the last 15 years. Without that boom and the boom in the Canadian tar sands, world oil production would have grown little or even declined. Now that U.S. shale oil production is receding—from an estimated 8.3 million barrels per day (mbpd) in November 2019 to 6.9 mbpd as of February 2021—it is unlikely that U.S. producers could pull off a similar feat again.
The recent rise in oil prices against a backdrop of a still recovering economy suggests that the shale miracle is not returning any time soon, if ever. For those who scoffed at the idea that world oil production would peak in the near term, the test is just ahead. World production of crude oil including lease condensate (which is the definition of oil) peaked at 84.6 mbpd in November 2018 (well before the pandemic) and has yet to touch that peak again. In fact, the latest monthly production figures available from the U.S. Energy Information Administration show oil production in February still more than 10 million barrels below its November 2018 peak.
No one can say for certain whether we have seen the all-time high in world production. But I am personally on “peak watch” and have been since the middle of 2019. The implications for the world will be even greater than those of the pandemic if it turns out we are now past the peak in world oil production.
US May LTO production is out and it ain’t going anywhere.
Ovi thanks.
I looked at Permian vs the rest of US tight oil over the last 10 months (dropping the Feb data point as an anomaly) basically the rest of US LTO has dropped by slightly more than the increase in the Permian with US tight oil as a whole trending down by about an annual rate of 30 kb/d over the past 10 months. I imagine Permian output may pick up as more frac spreads and rigs are added. Probably very little increase this year in US tight oil perhaps we get to 7200 or 7300 kb/d by Dec 2021. Despite Mike Shellman’s comment above about prices having little influence, I think as oil prices approach $80/b, tight oil output may move a bit.
Dennis
According to the STEO chart in the post above, it claims that starting in June output will begin to increase at an average monthly rate of 61.3 kb/d/mth up to December 2022. Sounds a bit ambitious looking at LTO production from August to May.
Ovi,
I agree, the STEO is too optimistic, though 360 kb/d is not a huge increase, probably 250 kb/d is a more reasonable guess for the June to Dec 2021 period, imho.
Dennis Coyne, since you have likely never even SEEN a shale oil well before, I suggest before you lecture and argue with someone who has actually drilled over a hundred of them, you GET all that data you think you might need before opening your lobster intake.
Well productivity in the Permian (based on the definition of IP24 months), normalized for lateral length and proppant loading, is declining. Has been for the past 5 years. You missed that, badly. You are never going to be the analyst you want to be until you “get” that past results in the oil business are NOT indicative of future performance. Some people may define “productivity” as EUR, and none of us know that answer to that entirely, yet; you in particular. If THATS the definition, problematic children may indeed be 60% less productive than their mamas.
I wish only to debate this stuff with people who write checks to be IN the oil business, who respect my industry. You don’t respect my industry at all. I am pretty sure that everybody remotely interested in the future of oil in our great nation can see right thru your stuff, like cellophane.
I did not say “prices have little influence;” I implied, clearly, that in spite of $70 oil, the shale oil sector still needs credit/debt to function, to maintain current production levels and have a RRR of 100%, not go backwards.
Here we are 2H21 and Ovi says “LTO is going nowhere.” Why is it that almost every large independent in the LTO sector is still adding debt if this is the year of big free cash flow? Its now adding debt just to stay even. Not to grow, but just to “go nowhere.”
Get a grip, man. We’re trying to help people prepare for some difficult oil times ahead. I am, anyway. Your message of abundance, and a debt free shale oil sector able to stand on its own two financial feet and serve America’s long term energy needs, is dog dookey.
I’ll add that a big impediment also is oil price volatility. It is only going to get worse. A kid on Reddit can now trade .4 of a barrel of WTI.
How can a business plan when the experts are predicting an oil price range of $35-$130? I think that is tame, my range is $25-$250. I should probably go with a negative number on the low end, but think a monthly average of $25 is about right, given how far below that is many well’s LOE around the world.
Add in that anyone who is responsible is trying to build the P&A fund, given all the governmental talk about ending oil. We have to prepare for a far left President and Congress ordering us to cease operations.
The future is very uncertain. So into that uncertainty, producers are supposed to increase CAPEX? I think many have figured out what we did years ago. One can make a lot of $$ merely spending enough CAPEX to keep production flat. I’m sure there are still a few stupid shale management teams willing to borrow. But the majors are going to decrease production.
Shallow sand,
Quick question, ceteris paribus if oil price was $100/bo would your capex spending be different than if oil price was $30/b (both inflation adjusted at 2021 US$)?
I agree politics, interest rates, the weather, … (the list could be infinitely long, but I don’t have space for the entire list) will affect decisions on how much CAPEX spending will be, but oil prices would be ner the top of the list as far as importance in my view.
You may see things differently now than when oil prices were $25/bo, a little over a year ago. What oil price would entice you to consider drilling a new well, $200/bo?
Dennis. It isn’t a price at any one time. It is duration of a minimum price.
I’d say if oil was $90+ average for 2-3 years we would commence our 2-4 well a year drilling program, provided a rig were available and provided cost was roughly the same as pre-COVID, two things which aren’t guaranteed.
Thanks Mike,
I also am just trying to inform people, sorry to ask questions, for most people that is how they learn, and I have learned much from you.
I don’t have the money to spend on a subscription to shaleprofile.com.
I know that productivity per lateral foot is decreasing, but the data I have access to has output per well. Note that my analysis is simplified, I assume all wells since 2010 cost $10 million per well and that all wells drilled from 2018 forward are 10000 foot laterals spaced at 500 feet, roughly 250 acres per well. I use USGS data for net acres to estimate the number of potential wells for F95 TRR estimate and mean TRR estimate. I assume a future oil price (as one cannot do an economic analysis with some price being used, just as you cannot budget for next month or next year without making some assumption about the oil price and costs in the future. Obviously we don’t know anything about future prices, well productivity, interest rates, taxes, costs, transport costs, royalties, none of it. I try not to state the obvious too much, but this does not prevent others from doing so.
Debt does indeed matter, that is why in my analysis (which overestimates well costs from 2010 to 2015, by assuming well cost at $10/million in 2020$) I use an interest rate for debt of 7.4%, which is likely higher than the average tight oil company pays. I assume in my scenarios that well costs after 2020 are paid from cash flow, so no new debt would be needed. At $70/b at the wellhead, the debt can be paid back by about 2026, if the mean TRR estimate of USGS is correct. For the low TRR estimate of 44 Gb, probably not. I do not know which estimate is correct, but I do know that many of my past estimates for tight oil output have been too low.
This is likely to be true of my 27 Gb URR estimate for the Permian basin based on the 44 Gb TRR estimate, perhaps my 45 Gb estimate based on the mean USGS TRR will be too high.
For the Bakken the USGS estimate from 2013 leads to a URR estimate based on my analysis of about 8.5 Gb, nearly identical to cumualtive production and proved reaserves at the end of 2019. It is unclear why the Permian USGS estimate would be as far off as you believe. I am unconviced by name calling, so calling it crap tells me you haven’t looked at it carefully.
Dennis, how much does access to shale profile cost? I think you should ask for donations to this site so we can get you one. It sounds like you’re basing your forecasts on a large amount of assumptions that may not be accurate due to lack of information. I happily give money to help maintain other independent sites and would do so here. See something like http://www.wolfstreet.com for an example. Sometimes I wonder if you’re just playing devils advocate to keep the blog interesting. Do you really believe the charts you are posting about the Permian? Since your more optimistic view of oil supplies clashes significantly with many others posting here, some with lifetimes of experience, it would help if you had more detailed data to buttress your contrarian views. Just some friendly thoughts…
Stephen Hren,
I think asking for donations would drive many away from the site.
I also don’t think output per foot of lateral is that crucial a metric.
I take the data from shale profile to estimate average output for current wells and then project into the future.
Last I checked nobody has any data from the future, so that’s the best we can do.
My projections for the Bakken/Three forks match nearly exactly the proved reserves plus cumulative output at the end of 2019 for the Bakken/Three Forks (or tight oil from the Williston Basin in the US).
That projection starts with the USGS 2013 assessment of the Williston Basin with a mean technically recoverable resource of 13 Gb of tight oil. The model I use is somewhat less spohistaicated than the one I use for the Permian basin where I also utilize natural gas and NGL output from tight oil wells in the economic analysis (these are ignored in the Bakken analysis, or fudged really I assume some natural gas sales will offset a bit of the OPEX for the Bakken analysis).
The question I would ask of the “experts” in producing oil is why one USGS analysis (Williston Basin)would prove quite accurate while the analyses done 3 to 5 years later (the Permian analyses were done in 2016 to 2018,) which used the knowledge gained about tight oil production in the intervening period, would be a load of crap as some experts believe.
I just don’t buy it. Before the USGS studies on the Permian basin came out I had much lower expectations of future Permian output.
I adjust my thinking based on new knowledge.
Hi Dennis.
A Patreon account would allow people to contribute without driving away occasional readers.
Easy to set up, and my guess is that many of us have already used Patreon. There are enough of us regulars (and I am sure, many lurkers) who know this is a sideline for you, that wouldn’t miss a buck or two per month.
Thanks for your reply, Dennis, I think the Permian will increase substantially. But other basins don’t look good and the investment climate for oil is poor. As Shallow Sand states, it’s the minimum sustained price that is important for investment decisions. And everything about the energy picture right now suggests massive uncertainty and volatility.
I disagree with your concern that a small unobtrusive way to donate a few dollars a month would drive away serious readers. I also disagree with your assumption that controlling for lateral length is not significant. How do you justify dismissing this?
Stephen Hren,
I use actual output in my model, that information is available for free at shaleprofile.com, lateral length is not an input as I do not have access to that data.
My thinking is as follows.
Over time producers will increase lateral length and find some optimum length where further increases no longer are cost effective, so the general principle of diminishing returns will apply and lateral length will no longer increase. I simply assume that by December 2019 we have reached that level and the average lateral length will remain relatively fixed. This is what has happened in the past in the Bakken and I expect it may have happened recently in the Permian basin as well.
My model assumes average well productivity starts to decrease starting in Jan 2020 (with the assumption of fixed lateral length this is tha same as an assumption of a decrease in normalized output per foot of lateral.)
That’s the basic idea, I simply assume 10 thousand foot laterals with 1000 foot spacing or about 230 acres per well, the USGS estimates about 50 million net acres are prospective for dvelopment in the Permian basin as of the end of 2017. That would give about 217 thousand wells to be drilled at that point in time, many of these would not be profitable, my scenarios typicaly have 80 thousand to 150 thousand total wells completed in the Permian basin (including the nearly 31 thousand wells that have been completed through March 2021).
To give you an idea about my well profile projections, I will take the 2016 well profile I found using the first 30 months of data I had about 2 years ago for the average Permian well that started flowing in 2016, the model well profile predicted 249 kb of cumulative output over the first 48 months. Actual output was 256 kbo, so I underestimated. For the average 2017 well I estimated 233 kb at 40 months, current data shows 247 kb. For the average 2018 well I estimated 218 kb at 28 months, current data shows 227 kb.
Mr Shellman points out that I do not know future well output. He is correct, I consistently underestimate actual well output because my estimates are conservative.
See post below to check my numbers for current data
click on well quality tab
https://shaleprofile.com/blog/permian/permian-update-through-march-2021/
“ Over time producers will increase lateral length and find some optimum length where further increases no longer are cost effective, so the general principle of diminishing returns will apply and lateral length will no longer increase.”
If lateral length had been optimized then new wells would show a similar dynamic of decreasing productivity. It appears length must still be increasing because new wells are producing more than would be expected based on holding lateral length steady. If lateral length is increasing then new wells are taking up more real estate and more likely to cause parent/child interference.
Stephen,
The lateral length has little effect on well interference, it is the spacing of wells (the distance between the laterals that effects well interference. Based on some articles I have read, about 1000 foot spacing seems to be the optimum spacing in the Permian basin, that is what I use to estimate the potential number of wells based on USGS analysis, note also that I assume 10000 foot lateral length and 1000 foot spacing which is a slight overestimate, the average lateral length is about 8500 feet.
Yes I realize lateral length has been increasing, but eventually it will reach some optimimum level which I assume is about 10000 foot (this is roughly the average lateral length in the Bakken).
So let’s say average lateral length ends up at 8500 feet. At the end of 2017 there were about 46 million net acres in the Permian that could potentially be developed for tight oil production. I assumed 230 acres per well for about 200 thousand wells for a 10000 foot by 1000 foot well footprint (wells spaced at 1000 feet and 10000 foot lateral length). An 8500 foot lateral length with same spacing is 195 acres and would lead to a 236 thousand well estimate.
Note also that LTO survivor is talking about closer spacing (maybe 500 to 750 foot spacing) which I exclude from my model as not viable. If we assumed 500 foot spacing and 8500 foot lateral length we would get 470 thousand wells for potential URR of 75 Gb, my model starts with 245000 thousand wells total (including wells drilled through Dec 2017) with about 200 thousand remaining to be drilled after Dec 2017 (this uses the 230 acre per well assumption or 10000 by 1000 footprint).
As always my assumptions are conservative. If anything my estimates will tend to be an underestimate of future output, as has been the case in the past.
Dennis,
Shale productivity (production in the first 6 months per ft) peaked in 2018. In 2019, if you look at basins individually, it declined in all basins apart from Delaware (where it increased by around 3.5%). However, in 2018 productivity in the Delaware basin had also declined, so maybe 2019 was a one-off. The overall decline in productivity (production in the first 6months per ft) from all basins in 2019 was 5%.
The lateral length has kept on increasing but at a decreasing rate. In 2019, avg lateral length was 8,500ft – increasing by about 6% from 2018 which increased by 6.3% vs 2017 which increased by 10% from 2016. I have heard that propant loading has declined from its peak, but don’t have any data.
Ancient archer,
Productivity per foot over the first 6 months may not be the best metric. If I had lateral length data I would compare EUR/lateral foot.
Dennis,
EUR is only in the imagination of the researcher. You can estimate it but you can never know it to be true until all the oil is out.
6 months production is real. It is oil you can or rather have used.
I prefer to stick to reality. I have done enough models to know that all models and estimations can be gamed.
Ancient archer,
EUR per lateral foot dropped from 2016 to 2017 (using my well profile estimates at 200 months) significantly from 55 kbo per 1000 feet to 50 kbo per 1000 feet using the numbers you gave in your comment (I do not have access to that data from shaleprofile). From 2017 to 2019 the EUR per 1000 feet of lateral has only dropped a bit to 49 kbo per 1000 feet of lateral over a 2 year period.
The drop from 2016 to 2017 was about 9%, from 2017 to 2019 the average rate of decrease was about 1% per year. Perhaps 2016 was anomolous with high grading due to low oil prices at the time.
The model I use assumes 1000 foot spacing is optimal, about 5 wells per section width. The child wells LTO survivor is talking about might be spaced at 500 to 650 feet, my model assumes no such wells will be profitable to complete. Also for USGS TRR estimate such narrow spacing (500 foot spacing between laterals) would imply 430 thousand wells completed (ignoring economics), my model has half that number and when the economics is applied it falls further to 125 thousand to 175 thousand depending upon price assumptions for oil and natural gas, I assume real costs are constant and oil prices go to $75/bo for WTI maximum in most of my models. Future wells are financed from cash flow while debt is paid down.
We don’t really have enough data yet to get a good estimate for 2020 well EUR.
ancient archer
I have done a few models myself,
I tend to be conservative.
My 2016, 2017, 2018, and 2019 well profiles were last updated over a year ago.
When I compare the projected output at 52 months for 2016, 40 months for 2017, 28 months for 2018 and 16 months for 2019, in every case my model underestimates actual average output.
I think using more tather than less data is better. Six months is too short, it shouls be 18 months minimum.
Mike,
I do respect your industry. The agenda is very simple. Try to estimate future oil output. I use a set of prices and well costs and estimates of future output from individual wells based on past average output.
I utilize the information I have from reputable sources such as shaleprofile and the USGS. I start with the USGS best guess estimate which has proven very good for the Bakken and so I assume it will be pretty good for the Permian basin as well. If so the debt in the Permian basin will get paid back with oil prices only as high as $70/b at the well head (maximum price of the scenario).
Not really worth explaining any further, so what is your expectation for Permian basin tight oil URR?
Makes no difference to me if oil exports end. I agree we should conserve as much as possible. My scenarios are not what I think should happen, they are what could happen under a specific set of assumptions. Of course any set of assumptions which try to model the infinite number of possible scenarios for future output of tight oil have zero chance of being correct. The math is quite simple, 1 scenario divided by an infinte number of possible scenarios gives us a probability of a correct scenario equal to zero.
Only oil producers know the correct scenario. 🙂
Your first sentence contradicts your last, with the little 4th grade smiley face. You’ve been in the Google oil business now, what, seven years?
The E in EUR stands for estimated; how are you going to “compare” EURS per lateral foot when these new well designs are only 4-5 years old? Will you be using your DCA or just investor presentation EUR’s?
Enno uses IP24’s to determine productivity and it works fine. Its too soon to know about EUR’s but it appears to others, just not you, that front end loading for cash flow purposes will indeed lead to lower EUR’s. Increasing GOR from high grading sweet spots will, obviously, just not to you, lead to reduced RR of OIP. Even us dumb asses in the oil business know THATS not good.
The remaining Permian estimate of 235,000 more locations was big work, BTW; you must have missed the memo about GOR and high grading though. See above. Its not all the same rock and past results are not indicative of future performance.
Enno makes great charts. Why in Aubrey’s s name people want to give YOU money to take his raw data and make new charts is beyond me. Imagine all the money you could have made by investing in shale oil years ago; hell, you could be giving all of US money.
Mike,
I agree productivity per lateral foot is decreasing, but do not have access to that data at 3500 per year.
I can do the economic analysis if I have the data.
My well profiles from over a year ago match up with current data fairly well from shale profile (not the normalized data as I do not have average lateral lengths.)
Read more carefully I take net acres from the USGS reports (around 50 million roughly at the end of 2017) and divide by 200 acres per well (1000 foot spacing by 8500 foot lateral length is 195 acres). No not big work, simply an explanation of where my estimates come from based on the analysis of the professionals at the USGS. Enno no longer provides the GOR information at his blog so I only have old data.
On normalized cumulative production see
https://shaleprofile.com/blog/permian/permian-update-through-september-2020/
This is the last post where the advanced insights are available for free, at that pont the GOR was not really a big deal.
My EUR estimates are conservative, lower in every case compared to actual output, despite what you believe.
From Enno’s post linked above I quote:
Average well productivity has steadily increased in the basin, although the rate of improvements has dropped significantly since 2016 (see “Well quality”). But this does not consider the increase in lateral lengths. Once you normalize for this factor, you will find these results:
the chart I refer to is just below this quote, it shows normalized productivity increasing through 2019 for Permian basin with a slight drop in 2020. I don’t think 6 months is the best metric.
And yes I use DCA for my well profiles, I use a hyperbolic fit and assume the best fit to the data will project future output until annual decline rate is about 12.5%, after that point I assume exponential decline at 12.5% until net revenue reaches zero (dependent on future price assumption, typically 70 to 75/b at wellhead for oil and 1.50/Mcf for natural gas and 25% of oil price for NGL barrels). Typically for recent wells this accurs around 200 months with an EUR around 380 kbo.
Chart from http://www.shaleprofile.com on Permian normalized productivity from blog post linked above (Dec 2020).
Click on chart for larger view.
Dennis,
I hear that when the price goes up there will be more shale oil added. I just don’t buy it. All of our child wells which is mostly what all shale companies have remaining IPs are only 60% of the parent wells. We could double the rig count in the Permian and still see only modest growth. The Shale game is virtually over and much higher oil prices are need to make even the child wells economic. All of the LTO charts are fantasy and by the way in December of 2019 things were slowing down considerably even before the Pandemic.
Thanks LTO survivor,
Are child wells cheaper when looking at full cycle cost because facilities are already in place, and if so by what %. Also what is your typical spacing, I have read that around 500 foot spacing is optimal on average in Permian (though no doubt there will be variability). Productivity per lateral foot may be down a bit since 2016, but over that period the total drop based on shaleprofile data is about 12%.
I have asked before and did not get an answer, I did a low TRR (44 b) estimate with assumed $75/bo oil price at well head and get a URR of 27 Gb and note that cumulative production was about 6 Gb at the end of 2019 and proved reserves were about 11 Gb for Permian basin for a 17 Gb total. Often proved plus probable reserves would be 1.5 times proved reserves, so perhaps 15.5 Gb for proved plus probable reserves and 6 Gb of cumulative output for 21.5 Gb.
As prices increase (they were pretty low in 2019, lower than at present at least) some possible reserves move to the probable category.
If the average well EUR drilled drops by 60% for all of the Permian basin, you are right tight oil will be done (unless oil goes to $150/b, then it still might be profitable to complete more wells). I just don’t see it in the basin wide data, but I also don’t have access to lateral lenth data, just the output per well. By that metric there has been no decrease in productivity per well visible in the data.
Also, let’s say all wells are now on average producing at levels for EUR that are 60% of the average 2019 well. How do you explain the increasing frack spread and horizontal oil rig count in the Permian basin?
If the 60% number were correct on average, it would be unprofitable to complete any new wells.
Just trying to learn here and square what you are saying with the data I see.
Lto survivor,
Permian Basin tight oil peaked at 4200 kb/d in March 2020, from Sept 2020 to May 2021 output has increase at an average monthly rate of 35 kb/d, by December 2021 Permian output may return to its previous peak (if this increasing trend continues). My guess is that output accelerates (slope of trend increases) if oil prices continue to rise.
“ The Shale game is virtually over and much higher oil prices are need to make even the child wells economic.”
There’s always the TMS, and somewhere north of $140/BO there will be more. Give it a couple of years…and never underestimate the power of greed.
US May LTO production is out and it ain’t going anywhere.
Surprise, surprise! 😉
API weekly draw -7.199M for June 22, 2021
Presumably the LTO guys have extensive hedges at their ‘profitable’ price point of $50 or so, so dont see the full benefit of $70 (and if they cant deliver for whatever reason, may see a loss?). Or would they have some more sophisticated insurance, collars etc?.
They do what the banksters require.
Agree with ancientarcher, the world does not stop just because of a high price of oil.
In fact, the world doesn’t stop because of anybody or anything. Atomic bombs have been dropped in war and the world didn’t stop. Empires have come and gone. My father passed in Oct. 2020…the world is still here, I’m still here, you are still here reading this.
It just goes on, and on, and on, and on. Eventually, yes, humans must go extinct or evolve into something else, but that’s a philosophical speculation on something that takes place over millenia.
Dolph and Ancient Archer , the world does not stop . Of course it does NOT stop . It will continue even after all of us have left the planet . The issue is that $ 100 oil will cause a lot of pain and also slow things down . Lower living standards to begin with , rising unemployment leading to both mental and physical health issues , social distress , etc . How resilient is society to take what could be a long term problem if prices remain above $100 for two years ? One year of the virus has knocked us out . We must understand that ” Oil(energy) is the economy” . Money(currency) is only a lien on energy . Just a few thoughts which need to be said specially for the West and the devolped world .
1. Just because it has not happened to you , does not mean it is not happening .
2. A fully functional heart is useless without a functional liver and kidneys . David Korowitz
3. For something to work every time it must work anytime and anywhere . David Korowitz
$ 100 oil will cause problems for our way of living by disrupting the no 2 and no 3 of the above . Our civilisation is a complex + connected system which is not ” anti-fragile ” . A small slip can trigger determinable cause and effect sequence with a negative feedback loop . The downward slope of peak oil is not going to be pleasant and was never meant to be . Take care .
Experience does not equal expertise.
My spouse has fifty years of experience managing Type 1 diabetes. He has monitored blood sugars, watched his diet, and taken shots of insulin three times daily for thousands of days.
However, he is by no means an expert in diabetes. The expert is his endocrinologist, a graduate of medical schools and recipient of extensive training, a woman half my husband’s age. She’s the expert.
In fact, it could be argued that my spouse’s experience with diabetes actually distorts his understanding of it, because his experience is based on a sample of … one. The endocrinologist, on the other, has seen hundreds of patients under the guidance of other experts. Yet she has ZERO experience managing her own diabetes! But I would recommend her for advice about diabetes over my husband.
This is just something to think about when people in this discussion start dissing other analysts for never having drilled an oil well.
Mike B , my view is that your comment is unfair since you are comparing two different fields of engineering and medicine . Since I have established and owned engineering ( auto parts manufacturing) for about 40 years I know what Mike S is talking about . I would any day prefer the opinion of the guy who came up from the shop floor to that of an engineering school . In my experience the engineering school man knows the tuning but the shop floor man knows the ” fine tuning ” . If my life was at stake I would send the shop floor man to go and bat for me . My experience and view has been affirmed by other business owners in my industry and believe me all of us write our own checks and got paid last . Just something of interest to you , in my discussions on this subject with a few US based firms they all universally agreed that they would rather employ a German schooled apprentice than a US graduated mechanical engineer . Of course this is my personal experience and others might have a different viewpoint . Be well .
P.S : Just for info sake . German corporations (VW, Siemens, MAN etc) in co-operation with the German government pass out thousands of apprentices from their factories . The apprenticeship is funded jointly by the industry and the government . During the apprenticeship the candidate gets a monthly stipend of Euro 1000 . The candidate on completion can continue working at his current position with upgradation to a full time employee or can go looking for a job in another company on completion without costs or any reimbursements . The quality of these apprentices is real high quality .
Brent futures are over $75/bo this morning, the last time Brent was higher than this was October 2018. The peak price that month was just under $85/b and was the peak price form Sept 2016 to present. The price is up by about $29/b from one year ago (about $46/b near end of June 2020), perhaps June 2022 Brent will be $104/bo (though I doubt this steep trand will continue). Probably $85/bo as Ron and Ovi have guessed (though if they were talking about WTI, Brent would be higher, perhaps $87/b or $88/b).
Short story is that prices are up and if supplies continue to be short, they will continue higher.
In the three years before the pandemic, 266% of the increase in world oil production came from the USA and Russia.
…….. World USA+Russia
16-Dec 82,094 19,676
19-Dec 83,594 23,673
…….. 1,500 3,997
I believe the USA has peaked. And we know Russia has peaked because they told us they have peaked.
World oil production has peaked.
I rest my case.
Ron I disagree.
US plus Russia will be able to return to the average 2018 level, there are other producers such as Saudi Arabia, Iran, Iraq, UAE, Kuwait, Brazil, Canada, Norway, and China that as a group can likely produce more than their 2018 level and can more than make up for the decline in the rest of the World (apart from the 9 nations named plus the US and Russia).
So I remained unconvinced that the 2018 peak cannot be surpassed, it would require that extraction rates for conventional oil never recover to the 2018 level. Perhaps that’s possible, but with oil prices rising to $85/bo, doubtful in my view.
Note that my conventional oil resource estimate is 2800 Gb, relatively conservative compared to the gold standard estimate by the USGS in 2000 which estimated 3000 Gb for World conventional resources and only a bit higher than Jean Laherrere’s estimate of 2700 Gb (whose estimate for World C+C less extra heavy oil has risen from 2200 Gb in 2012 to 2700 Gb in 2018). Bottom line, though many here think my estimates are optimistic, other places see them as too pessimistic and historically they have in fact been too low for every best guess estimate I have made in the past. Future could of course be different.
Dennis, I am aware that I am repeating myself . Everyone is producing flat out . Just like in the stock market ” cash waiting in the sidelines ” waiting for an opportunity is a narrative , so is ” spare capacity awaiting ” for better prices (or market conditions etc ) . The world will/can not exceed the peak of 2018 . The price can go to whatsoever but it is not going to prevail geology . Mother nature does not care , it makes the rules . Best to repeat you for a change “Future could of course be different.”
Hole in head,
I do not think all OPEC producers are producing flat out, I also think more CAPEX spending in tight oil plays in response to higher oil prices and higher profits will result in higher tight oil output in the 2022 to 2027 period.
Many think the 2018 peak will not be exceeded, I think those who believe that will be wrong, just like other earlier peaks that were later surpassed. I stand by my estimate of a peak in World C plus C in the 2025 to 2030 time frame, with a best guess of 2027 or 2028 at around 85 to 86 Mbpd. We will see.
I do not think all OPEC producers are producing flat out,
Just curious Dennis, but what do you think OPEC could produce if they were producing flat out, that is even assuming Iranian sanctions were lifted?
Want to see production flat out –
have a global subsidy to bring oil up to $120 a barrel (or just market demand).
And drop all tariffs and sanctions (including on Venezuela).
That should bring out all production capable.
Hickory, There will always be wars and other political problems. There will always be constraints on some nations that have a negative influence on their oil production. The world is what it is.
True, but I still think that it is a valid point-
Sustained higher prices will stimulate production beyond what we see today. No one knows if it will be higher than Nov 2018.
We don’t know if the Russian statement is accurate, for example.
Personally, I am a lot more interested in the slope steepness of the post peak production decline than the particular moment of peak, but I certainly appreciate all of your observations.
We don’t know if the Russian statement is accurate, for example.
Hickory, nations often lie about how much oil they do have. They never lie about how much oil they don’t have. Russia has peaked, you can take that to the bank.
My sister used to hide some of her food until I finished mine. Then she would slowly eat hers while I watched.
Why wouldn’t countries keep their cards hidden under the table?
Hickory, that question makes no sense whatsoever. Russia’s production is dropping. According to Reuters, in the third quarter of 2021, they will export 300,000 barrels per day less than they did in the second quarter. And that is while oil prices are higher than they have been in years. Oil exports are 36% of Russia’s federal budget revenues. But I am sure you can think of some reason they just love losing money.
I have no idea what your point is Hickory, but there must be one hidden in that absurd logic somewhere.
Ron, if a nation thinks oil will be higher priced in the future, it makes sense to keep more production for later. If lying about how much they have drives up the price, why would they NOT do that?
Stephen, every nation uses private contractors to produce oil. And in many cases, including Russia, they depend on private investors to buy bonds from those contractors as well as stock in those companies. Saying they have less oil to produce only discourages those contractors and investors.
When companies and the public lose faith in a country, for whatever reason, that nation’s production will start to collapse. Venezuela is a perfect example. Though they have plenty of oil, companies will not touch them.
Every country wants other nations and their oil companies to have faith in their ability to produce the oil that would justify their investment. They are far more likely to lie on the upside to keep the investment money rolling in.
Also, it’s a matter of prestige. Bragging rights are important.
Ron about 32000 kb/d for OPEC if Iranian sanctions are lifted, obviously it will take 6 to 12 months for Iran to ramp up, perhaps longer. Also some of the large producers (KSA, Iraq, Kuwait, and UAE) may be able to increase their capacity. The 32 Mb/d guess does not consider that possibility.
Ron about 32000 kb/d for OPEC if Iranian sanctions are lifted,
Is that OPEC crude only or OPEC C+C as reported by the EIA?
Ron,
I used C+C data from the EIA, that is the basis for the estimate.
To my question: “Just curious Dennis, but what do you think OPEC could produce if they were producing flat out?” Dennis replied: Ron about 32000 kb/d for OPEC if Iranian sanctions are lifted.
My guess would be about 31,000 kb/d. Noting that they peaked in November 2016 at 34,384 kb/d. Their 12 mth ave peak was in April 2018 at 33,787 kb/d.
Anyway, it is good to know that you agree with me that OPEC has peaked. I think you are beginning to come around to reality Dennis. Congratulations.
Note: We are speaking of OPEC C+C as reported by the EIA.
Ron,
Note that the 32000 kb/d estimate for OPEC C plus C output was a near term estimate, for a case where Iranian sanctions were lifted next month and 12 months more had passed (so perhaps July 2022 in this scenario). If oil prices rise to $100/b and remain at that average price level for 4 years (say 2023 to 2026) we might see OPEC output rise above 32000 kb/d and perhaps approach the previous 12 month peak.
In short I make no claim that OPEC has peaked, I would put the odds at 50/50 that future peak output for OPEC C plus C will be higher or lower than the previous annual peak. We do not agree on this point, only on US being likely past peak (66% probability in my view).
I would put the odds at 50/50 that future peak output for OPEC C plus C will be higher or lower than the previous annual peak.
Well, at least you are making progress. I think the last time you quoted odds it was 10/90 that the peak had been reached. That is a 10% chance that we were post-peak.
Ron,
That was for the World, not OPEC, I remain convinced that it is very likely that the 2018 annual peak in average World C plus C output will be surpassed in some calendar year in the future, and I would still put the odds at 9 in 10 that before 2035 we are likely to see a new peak. My current expectation is that the peak in World C plus C output will be between July 2027 and June 2028 (the centered 12 month peak will fall within that range) with roughly equal odds it will be before or after this.
Dennis, Pollux posted this link last Friday: Russia’s quarterly crude oil exports to drop 7.2% -schedule
Russia’s crude oil exports and transit volumes are set to drop to 57.1 million tonnes for the July-September period, from 60.9 million tonnes in the April-June plan, according to the quarterly schedule seen by Reuters on Thursday.
I did the math. That comes to just over 300,000 barrels per day for the entire third quarter. That is if June production is close to April and May production and domestic consumption remains flat.
So, the Russian Oil Minister says they have peaked. Reuters says Russian exports are falling. That could only be because production is falling. Yet you say: US plus Russia will be able to return to the average 2018 level, Okay, if you say so. But I am not going to argue with the Russian Oil Minister or even Reuters. But I am really not surprised that you do not hesitate to do so.
And even if they both do return to their 2018 level, they will still be 1.37 million barrels per day below their 2019 peak. USA + Russia will never again have a combined total of 23 million barrels per day. Their monthly peak was 23,713,000 barrels per day in November 2019.
…USA + Russia
2018 …. 21,717
2019 …. 23,093
………. 1,376
Ron,
I agree USA plus Russia combined output may have peaked, the important figure is 2018 which for US and Russia was about 26% of total World output.
I think OPEC could raise output to at least 32000 kb/d if Iranian sanctions are removed. As oil prices rise Iraq might be able to push output higher and Saudi Arabia might be able to expand capacity in a high oil price ($90/b or higher) scenario. Potentially OPEC might approach the previous peak of 33646, but 33000 is a more realistic estimate, in 2018 OPEC output for the year was 33527 for C plus C (EIA data).
Below is a shock model that has 2018 as the peak, it uses the same underlying resource assumptions of scenarios presented earlier, but assumes lower future extraction rates for conventional oil. Of course we do not know what future extraction rates will be, but this scenario assumes historically low extraction rates in the future, note that extraction rate in 2005 was the lowest point from 1950 to 2005, and extraction rates for this scenario are lower than the 2019 extraction rate for all years from 2020 to 2200. I suppose it could happen, but I am skeptical this scenario will be correct. In other words, this would be the minimum output we would expect barring another oil shock in the future,
”As oil prices rise Iraq might be able to push output higher” : how long will it take you to understand that sometimes, the management of oil reserves is not intended to produce more with the assumption of higher prices making it possible to reimburse the investments but simply for the purpose of saving reserves oil for the future? How do you analyze the stability of oil production in Iraq between 2016 and 2020? I’ll give you two clues. First, they literally buy social peace with oil revenues. 2) Due to the geopolitical problems that Iraq has gone through, they have extracted less than half of their oil reserves.
Jean,
That is why I said they might choose to increase capacity, the future is unknown.
Due to the geopolitical problems that Iraq has gone through, they have extracted less than half of their oil reserves.
I have no idea what Iraqi reserves really are but you can be assured they are nowhere close to the 145 GB they claimed in 2018. But I would bet they are well over 50% depleted.
That being said the normal trajectory for oil production would be up until half their reserves are gone then down for the last half. However, reservoir creaming has changed all that. Nowadays, for nations possessing giant reservoirs, like those in the Middle East, Russia, and a few other places. They cream the very top of the reservoir with horizontal wells right at the surface of the reservoir. Production stays high until well past the 50% mark, then a steep decline takes place.
Ron,
The unconventional oil output for the scenario above (and the earlier shock model in this thread) is below, unconventional output is the sum of extra heavy oil from Canadian and Venezuelan oil sands and US tight oil and is read from right axis, the tight oil (lto) and extra heavy oil output for the scenario are read on left axis. Peak for unconventional is about 14 Mb/d from 2028 to 2032,
Agree.
LTO Survivor,
Who do you agree with? It is difficult to follow the thread.
Perhaps you agree with Ron that the World has peaked? Or that the US has peaked (I agree with Ron on that, but note the US peak did not coincide with the World peak, the US peaked a year later in 2019, US output averaged about 11 Mb/d in 2018, similar to current level).
Dennis, it depends on which peak you are talking about. The World monthly peak was in November 2018 at 84,631,000 barrels per day. But the 12-month average peak was April 2019 at 83,157,000 bpd. Either way, neither will ever be surpassed.
I agree with Ron Patterson that 83/84 million b/d will never be surpassed.
Ron,
Only 12 month peak is important, so I use 83157 kb/d, but I center it at Nov 2018. Note that Russian and US output in 2018 is the number to focus on, that number can be maintained for a few years. Peaks in individual nations are less important than the aggregate number that adds up to the World total.
Looking at top 10 or top 20 producers and their aggregate production gives us a feel for where the World might go.
“Note that Russian and US output in 2018 is the number to focus on, that number can be maintained for a few years.”
Dennis, that is a statement of faith and nothing more. A few years??? Russia is already having problems. And US shale is will not perform to anywhere near your expectations.
“Looking at top 10 or top 20 producers and their aggregate production gives us a feel for where the World might go.”
I know Dennis, you believe past performance is a good indicator of future performance. That is flawed logic. Every nation has to peak sooner or later. Just because they have not peaked yet does not mean they will not peak in the near future. Many nations have already peaked Dennis, that fact alone should tell you it does happen.
I know Dennis, you believe past performance is a good indicator of future performance. That is flawed logic.
Indeed, this is the problem of inductive logic. Which was proposed by David Hume in the 18th Century and it still hasnt been solved. One reason been that probably Ron you are right. That type of logic is indeed flawed.
https://www.youtube.com/watch?v=9_Gor1E8IxI
Ron,
I simply propose a different timing than you based on the information I have available. I am not proposing a very big increase in tight oil output, basically the scenario I use has tight oil output increasing by 2% per year on average from 2020 to 2029, that might seem like a lot, but note that the average rate of increase in tight oil output was 29% per year from 2010 to 2019.
The Permian basin still has a lot of oil, higher oil prices will make it profitable to produce in my opinion. It can be done out of cash flow while paying down debt, despite what others believe.
If we would like to restrict exports, we could do that, but generally this is bad practice as it leads to inefficiencies and market distortions. Not clear it would be good for the oil industry and would tend to reduce output and raise oil prices, but would allow less freedom for oil producers to make decisions they think best for their business.
Despite what Mr. Shellman believes I wish the oil industry well, but eventually oil output will decline and we need to move to other sources of energy and it will take time to make such a transition in my opinion.
Ron,
It is a statement based on reports from Russia, they expect a plateau in output around 11 Mb/d, as do I.
I think sometimes trends from the past continue into the future and sometimes they do not. The fact is I almost always say I don’t know, sometimes I forget and inadvertantly say something can or will occur in the future when I should have said it might or may occur. Every time I make a statement about the future it should be qualified by the fact that I am naming one scenario from an infinite set of scenarios with a zero probability of correctness. This is true of every future scenario created by anyone.
The US has peaked. Unless oil prices go to $150. The only way to increase the shale locations is to enable the child locations which will produce 60% of the parent locations to have an NPV that justifies more wells per section rather than less wells per section.
Correct boss . The US has peaked . Never 12,896 Mbpd again .
We all agree US has peaked, even me. I think tight oil can go a bit higher than 2019/2020 highs around 8 Mb/d, an perhaps reach 9 Mb/d, but it will not be enough to offset decline in conventional and offshore, so it might reach 12500 at most in the future.
LTO survivor,
Earlier I think I may have written 500 foot well spacing for Permian, but I remembered incorrectly, it is about 1000 foot spacing that some consider optimal so about 5 wells per mile at 10000 foot laterals for about 230 acres per well.
I may have the spacing wrong, but let’s say an operator has 5 wells spaced at 1000 feet, when you say a “child well” do you mean a well placed in between these existing wells and in this example they would be at 500 foot spacing?
Also do you think there are no more viable “parent well” locations in the Permian basin?
If I have the child well description roughly correct, I would agree those wells are not likely to be viable, what is not clear is that there are no potential parent well locations left to be completed.
I would think a 60% drop in productivity would be evident in the shaleprofile data, I don’t have the money for the normalized well data at shale profile.
LTO Survivor,
Found the following, interesting read, no doubt you have seen it already.
https://jpt.spe.org/how-close-too-close-well-spacing-decisions-come-risks
Chart from JPT article
A new piece by Tim Watkins that is relevant to much of the discussion here.
https://consciousnessofsheep.co.uk/2021/06/23/mere-statistics/
I found this authors summary of the energy situation an interesting read/summary of the state of affairs.
However, a comment near the end comes across as absurd thinking to me.
His comment in is reference to the idea that renewable energy sources will be insufficient to replace fossil fuels
“There are many green activists who simply don’t care, and will continue to argue for a rapid switch from fossil fuels to NRREHTs irrespective of the damage and loss of life that this will inevitably bring about”
Yeh, blame those who advocate for attempting to replace fossil fuels with other forms of energy for the problems associated with fossil fuel depletion and failure to discover affordable new vast reserves [sarc]. I suppose he suggests it would be better to just keep producing and using fossil fuels as fast as possible, pretending that a cliff in supply will be always next year, and will always affect someone else.
In regard to the idea that renewable sources of energy will be insufficient to replace fossil fuels, I agree with that. The timely replacement of all fossil fuel energy will not happen quickly enough to keep the energy prices and consumption levels that people are used to. Not by solar, not by nuclear, and not by corn, for example.
Some things like nuclear are very expensive and take a long time to implement. With solar- the reserve is massive in much of the world, but the effort to implement is limp.
Decision making/energy policy in the world is generally F grade. And the outcome will likely reflect that.
But I’d sure as hell would prefer to live in a place that decided to ramp up the electrical system, in this post peak time.
Pile on.
A number of years ago it was the late Jay Hanson (developer of the dieoff.org website) who said that we should consume the oil resources as fast as possible, so that the crash would come earlier and fewer people would die. This is quite cold logic, and in its defense one can say that the world population has increased by nearly 2 billion people since the early days of peak oil discussion so these are the people who will die. Also it is only right that the people who have created this situation would suffer. Unfortunately, the burden would mainly fall on people who did not create the situation. We are in front of Skylla and Charybdis, not a pleasant choice.
The remnant of the Hanson’s website is https://dieoff.com/ where he quoted John Grey thus:
“The destruction of the natural world is not the result of global capitalism, industrialisation, “Western civilisation” or any flaw in human institutions. It is a consequence of the evolutionary success of an exceptionally rapacious primate. Throughout all of history and prehistory, human advance has coincided with ecological devastation.” — John Gray, STRAW DOGS
This morning the EIA reported a weekly crude inventory drop of 7.6 M barrels (excluding the SPR). Weekly output was down 100 kb/d to 11,100 kb/d. Total stocks were down almost 200 M barrels from one year ago. WTI was over $74 for a while this morning.
Looking at the futures table, I have never seen such steep backwardation. The front month is higher by 77¢ and the September October roll is $1.01.
Can someone interpret the significance of such steep backwardation and what is it signalling.
The steep backwardation is signalling that oil is in short supply in the spot market. Hence spot prices are higher than future prices. There is also an element of pessimism regarding oil prices in the future leading to lower prices further down the line.
Contango – the opposite of backwardation – means that spot prices are lower than futures. This exerts itself when oil is very plentiful, too plentiful. This happened at the peak of the GFC and March/April last year.
But there is also the issue of the market being too pessimistic about oil prices in the medium/longer term. Brent future for Jun 2025 is trading at $60, so that’s the market expectation of the oil price in 4 years time. Which frankly is ridiculous! But everyone is on the EV bandwagon and oil is killing the planet so there is a lot of pessimism regarding the price over the longer term.
AncientAracher
Thanks
That is my understanding also. In backwardation, refiners are saying to the producers, I want oil and I want it now and I am prepared to pay extra to get it now. In contango the refiners are saying keep your oil in the ground and send it to me in the future and I will give you a little extra while you keep it in the ground or in storage.
Exactly!
What I don’t get is $60 Brent that the market is pricing for 2025.
Absolutely ridiculous
I thought backwardation was the normal structure for all commodities. The higher front price should bring on more investment to produce more and subsequently drop the price. Contango is usually a temporary structure, any where from one or two months to a year. A few months back I recall the contango only lasting for one or two months for WTI before rolling over into backwardation
The more active June 25 contract for WTI is $55.93. Open interest is 1,383. Sounds a bit far fetched.
Ovi, both are normal in the commodities market, especially in agriculture. If it was a very good year, but a terrible year is expected next year, you will always have backwardation. However, if the reverse is true, you will always have contango.
It is all about trader’s expectations. The trades, and only the traders, are the ones who determine whether the market is in backwardation or contango. One happens just about as often as the other.
Shale’s 400% Rise in Frack Crews Not Enough to Boost OutputBold mine.
Even a more than 400% jump in the number of fracking crews working the U.S. shale patch isn’t enough to send oil output soaring. In fact, it’s just enough to keep production relatively flat this year, according to Primary Vision Inc., which has tracked data on frack crews since 2013.
After an 85% tumble in the number of crews completing wells during the depths of the pandemic, the figure has steadily recovered over the past year. It now stands at 235, up from 45 on May 22, 2020. That could grow by roughly another 6% to 250 crews by year end, Scott Levine, an analyst at Bloomberg Intelligence, wrote last week in a report.
But because of the way well production decreases over time, the jump in crews is only enough to keep output flat, rather than boosting it.
“Operators are still focusing on getting out of 2021 with a little bit better managed expectations and better hedge profile,” Matt Johnson, chief executive officer of Primary Vision, said Tuesday in a joint webcast with Bloomberg Intelligence forecasting the pressure-pumping market. “Where is that relative to the actual production? We’re pretty close to managing it at this point.”
Because shale wells see steep declines early in their life of production, the U.S. oil market requires more wells to be drilled and completed in order to replace them and hold output constant. After dramatically turning off activity last year due to history’s worst crude crash, the oil service companies had to ramp up frack crews in order to get new production back online. The mantra among shale’s biggest explorers is to keep output relatively flat this year and send profits back to shareholders.
Ron,
Chart below shows trend for frac spreads from Sept 2020 to June 2021 with a trend line.
If that trend continues, the frac spread count will be at about 320 at the end of 2021 roughly the same as in February 2020, US tight oil was near its peak in March 2020, so tight oil output may rise over the next 6 months, though I doubt it will reach the November 2019 peak until 2022 or perhaps 2023.
Yep. The Shale companies are buying other companies because they know like I know that it is cheaper to buy the production than to drill child wells. Look at the month to month production. Flat as a pancake. Most of my career was spent in the conventional arena of oil and gas gas exploration. The carcas of the US oil fields has been picked clean. I am investing in a vertical gas well and it has the potential for a 5 to 1 return. It was seismically delineated but it’s only a 1 well deal and this was by far the best prospect I have seen this year. The opportunities for substantial growth in the US are simply over. I am not am expert on offshore but it is probably the only frontier that can fill the gap.
I read the article above and I am concerned and have been what this world will look like as we fight over the scarce resources. We as a nation have been profligate in our energy usage and too ignorant and misinformed to to have spent resources researching and developing true alternatives. This should have happened in earnest in the 1970’s when we peaked conventionally. Our politicians on both sides of the aisle have been more concerned about sound bites and re-election than actually being good stewards of a functioning democracy. The Press today is also grossly irresponsible in its sensationalistic reporting and opinionated bias towards saving the planet. Go ask a guy on the work over rig in west Texas how important climate change is to him when he is trying to feed a family of 4 or 5. He is worried about a roof over his head groceries and staying cool in tue summer and warm in the winter. We have succumbed to an elitist agenda that is out of touch with true micro survival. I have always been an advocate of alternative energy because fossils fuels are finite. I only hope and pray that it isn’t too late to find real and viable alternatives to transition to in the near future.
Sorry for the rant but I have been so fed up with the lies of the governmental agencies who make production predictions with zero common sense or experiential evidence as to what they are predicting. I don’t know what the oil price will be in 2022 or 2025 or 2030. All I know is that we are running out of fossil fuels quickly and we better find a suitable replacement or there will be a world ending war fought over scarce resources.
Excellent points, LTO. Most live in the everyday world of making a living day to day.
What I see from my front door is much the same as it was 50 years ago. Wind, rain, clouds, ice in winter and occasional snow. The UK meteorological office record of rainfall shows little change over the past century. A tad wetter in the 1930’s.
There are more immediate problems, imo. Such as peak oil, and ensuring decent relations with Russia that continue Europe’s supply of NG. Russia has been a reliable producer for us these past 40 years. Let’s not f**k it up.
Bingo!! I am more worried about China and it’s quiet acquisition of dominance over the worlds scarce resources. They know what’s coming.
Thanks LTO survivor,
I agree we need to transition to something besides fossil fuel. Note that just because the averae person does not care about climate change does not mean it is not a problem. It is a very real problem.
Note also that the USGS has much better estimates than the EIA, I don’t think EIA estimates are very good, I just try to estimate based on USGS analysis. and well profile data.
The estimate may well be wrong, but note that I assume 1000 foot well spacing in my model, not 500 foot spacing, there is not a bif difference in EUR per well between 2000 foot well spacing and 1000 foot spacing, perhaps you are talking about infill wells between wells spaced at 1000 feet, I agree that’s unlikely to work well.
Also my model assumes wells on average are spaced no closer than 1000 feet and lateral length is assumed to be 10000 feet (actual average lateral length in Permian basin is about 8500 feet for tight oil wells), so if the 1000 foot spacing is correct actual acres per well is an average of 195 acres, my model uses 230 acres per well and thus would underestimate total wells (relative to a model assuming 195 acres per well).
The local news station here in South Texas reported the current administration is considering to classify water produced from fracs as “Hazardous Waste” , further the disposal sites for such waste are very few and costly. They went on to say such an action would be the death knell for the LTO producers. The story was not clear as to whether the waste was only the initial frac flowback water or all the produced water for the life of the well.
JAM.
You are correct in your prediction should the report turn out to be true. Furthermore, this is truly a slippery slope issue.
For the uninformed, produced water is injected into EPA Class 1 Underground Injection Wells. Hazardous waste is injected into Class 5 Underground Injection Wells and you are correct, they are few and far between as they are much more expensive to construct and operate. My guess is that the chemicals blended into the frac water presumably return as hazardous waste. EPA logic on similar issues results in the application that one bad apple spoils the whole bushel. Suffice it to say that as long as trace amounts of the chemical additives are in or are suspected to be in the produced water after flowback, then the produced water will likely be deemed hazardous waste.
The slippery slope consequences of such rules/laws are the reclassification of all oilfield produced waters as hazardous waste due to the application of various scale, paraffin and asphaltene inhibitors, demulsifiers, hydrate controls, bactericides and other production/stimulation chemicals in the vast majority of producing wells or flow streams. If every injection/disposal well is to be reclassified as a Class 5 UIC well, then the jig is up except for the most profitable producing wells or fields. This would be way a way bigger hit than methane mitigation regs. As a practical matter, the operators of commercial disposal wells will be on the hook for disposal of produced waters deemed hazardous waste even though they aren’t aware of the composition of the water. If anyone thinks that indemnification language in disposal contracts with well operators or sufficient surety to cover potential EPA fines will be economical or viable they are sadly very wrong. If I’m not mistaken, bankruptcy won’t protect you from the EPA so why take the risk.
If I am off base here please educate me as my experience as an engineer and operator has led me to these assertions but I could be materially wrong. This is too big of an issue to brush aside.
I don’t think this new big rock from the Biden administration is going to leave a mark in Texas; earlier this year the EPA essentially gave up on Texas and left all matters relative to the Federal Clean Air and Clean Water Acts to the TCEQ. The EPA is essentially gone from Texas.
It will, however leave a big mark on other oil producing states and potentially have a very negative affect on US HZ tight oil development. As will methane emissions regulations coming down the pike, loss of IDC and, the big one, running out of water to frac with. The Permian and the Bakken are both in serious droughts and groundwater sources are declining rapidly. Less than 25% of frac source water in the Permian is recycled. It can’t go on much longer; draining valuable groundwater from arid W. Texas just to export the damn oil to Asia, including China, the same people we imported COVID from, is stupid. Eventually, after its too late, people will get how stupid it all was.
So there are just four examples of how “extenuating circumstances” prevent the oil and gas industry’s past performance from being indicative of future results and why more and more data, more models, more statistics… are really worthless in predicting the future. People IN the oil business understand this and its part of why we don’t answer dumb questions about that future, particularly about prices. We don’t really know. We prepare for the worse and adapt; we work thru it. Or, in the shale oil sectors case, file bankruptcy.
Mike. We have read this and are very worried (again).
Do you read this to say that even water used in a waterflood project would be classified as “waste.”
Water injection is the lifeblood of our operations. We produce about 100 BW for every BO. Produced water is injected back into the producing zone. This began accidentally in our field in the 1920s and large, planned waterflood development began shortly after WW2.
Our injection wells are heavily regulated already. Regular mechanical integrity tests. Surprise spot checks that can result in fines.
It never is going to end, is it.
I doubt this legislation would pass. If I am correct, this is just noise.
Dennis
Back in the 90s there was a congressman from CA I believe, that went on a mission to ban fracking. Of course there was/is little done there but who cares. If he was successful his base wouldn’t vote him out. But I digress; here we are today with that ever present threat and the banning of the process outright in other countries.
As for the reclassification of produced waters pushed by a non producing state congressman as a moot point, I disagree. While it may take some time it might happen. Consider the woke environmental advocates from entertainers to suburban energy addicts, the wholly ignorant yet vocal media and elected/non elected officials nationwide and their influence. I used the word woke intentionally for emphasis on emotion over fact. This may turn out to be the methodology for banning hydrocarbon emissions (CO2 and methane), or fracking at the minimum, without banning both directly. Just make the business too expensive with unattainable standards for most operators.
Fools planting bad seeds in fertile ground is never good.
Considering that my livelihood and retirement are at stake I truly hope that I am wrong and you are right. However; my track record is better in seeing the regulatory future albeit with inaccurate timing.
Rasputin,
I stand by my earlier comment, such a law will only be passed when tight oil and shale gas are no longer being produced in the US.
Last I checked, legislation has to pass both houses of congress.
Such a law has about the chance of passing in the Senate as a snowball fight in hell.
Dennis. If I recall correctly, Rasputin has operations in Colorado. Colorado was oil and gas friendly for decades. That has turned on a dime. Production is falling in CO and part of the reason is a very difficult political and regulatory environment.
So, just because a Federal law cannot be passed doesn’t mean a state cannot pass the same thing. Upstream oil and gas is primarily regulated by the states.
Contrary to popular belief, upstream oil and gas is very regulated already. Much of the issue in the past was enforcement.
Where we operate, that has changed drastically. The state employs many more inspectors than it used to. These inspectors have 24/7/365 free rein to go to any facility and upon any lease without notice. They go inside pump houses without notice. They monitor injection well rates and pressures without notice. They can touch all equipment and shut down any and all equipment without notice. There is no limit to the number of times they can go upon a lease, again, without notice.
I doubt that there are many other businesses where inspectors are permitted on the property 24/7/365 without notice.
But even that apparently isn’t good enough for many.
Very few want to work in upstream oil and gas and many want to put and end to it altogether.
Shallow sand,
Yes states can pass different regulations that are stricter than Federal standards, that is as it should be imo.
If the voters in a state don’t like the regs they can elect representatives that will pass legislation to change the rules.
Your state might have stricter enforcement than neighboring states, which may be unfortunate as the rules of the game seem to change over time and it may be difficult to adjust.
Hopefully $73/bo WTI helps.
I mislabeled the EPA UIC well classes in my comment. Sorry for the confusion but maybe I’m a little too close to the impact here with all of my skin in the game and a bit lacking in unemotional output. Nonetheless, the essence of my comment is intact.
There is an Oilprice.com article up right now addressing this very situation.
“considering to classify water produced from fracs as “Hazardous Waste”
Well, you guys who have direct experience, is this water hazardous waste?
‘Hazardous waste is waste that has substantial or potential threats to public health or the environment, due to properties such as corrosiveness, toxicity, flammability, chemical reactivity …
In our case, we are injecting salt water back into the zone it is produced from. It is a closed loop, unless the injection well(s) casing and cement job fails. This is why pumpers check wells daily, including tubing and casing pressure, and injection rate. Also why wells are subject to mechanical integrity tests in the presence of a State well inspector on a routine basis.
The concern is salt water getting into the fresh water zone.
If all injection wells are shut down in the US, for all practical purposes 90+% of US onshore oil production would have to be shut in.
Of course, this whole movement is the result of US shale. Shale has given us all a very bad rap.
Thanks for the explanation.
It is amazing to me that mechanical integrity of the casing and tubing can be established, and maintained. Pretty amazing accomplishment.
What about the fluids used in the areas where hydraulic fracturing is done?
The mechanical integrity test is a test of the pressure between the casing and the tubing. A minimum pressure must be maintained for 30 minutes, with a no more than 5% drop in pressure.
I hope all readers understand that without the ability to re-inject produced water, the vast majority of US oil production would be required to cease.
This legislation appears to be in response to the US shale industry’s frac water disposal methods. But it may well be intended to end most US oil production? Who knows.
@Hickory
You can count almost all water pumped from deep earth as “Harardous Waste”. It almost always will contain at least heavy metalls ions, which are very poisonous when brought into enviroment. Think lead poisoning. Other problems are often radioactive materials – and even high concentrated salt has not to spoil farmland or ground water.
You can shut down any mining / drilling operation when you ride this very far – there has to be a reasonable balance between collateral damage and costs.
Pumping the water back to where it came from as with shallows wells should be a good enough approach – but crazy town living woke enviromentalists together with dump burocracy can cause much damage here.
One example: In one German country there was a order that any earth conainting organic material was declared hazardous waste for a few years. It was any organic material – when you had to move topsoil you had to put it on an expensive depony. Outright Idiotocracy. Every construction and geologic company bend the law to get around this, wasting valuable resources because a paper shuffler thought only “Chemical contaminated” and not “cointains roots” with organic materials.
My brother works in a geologic company. They got very creative to avoid this law.
Another example: A company wanted to use local earth from construction to build a noise protection embankment, right behind the houses where the earth came from. It wasn’t possible – there was cadmium in the earth (from natural ressources) and it was declared hazardous waste.
All,
A few have suggested I have an unobtrusive donate button on the site so folks can chip in for the cost of the web hosting and perhaps a subscription to shaleprofile.com. Maybe we could pay Ovi and Mr Kaplan for their excellent posts as so far all of this has been done for free. Note that nobody has asked to be paid, just so that’s clear.
What do people think? I would prefer not to drive people away, personally I do not like advertising so I would not go there.
It would be a great test of the free rider problem.
I am inclined not to do this unless most say it is not a problem.
Dennis , ready to chip in . All you folks do such great work . Edit . Keep it volunteer based . Let the free riders read also . The ” Wolf Street ” model is good . Why , I say so ? We are now over peak ( yes we disagree ) and as the world will face the consequence of POD (Peak Oil Dynamics) the blog will attract new viewers . Remember what happened at TOD when the deep water horizon accident happened . It was the “go to” site . If my memory serves me correct there was a day when the comments ran above a hundred .
Thanks Hole in head,
Just checked prices at shaleprofile.com, it is $279 per month for the “professional subscription” which is the least expensive option that gives access to lateral lengths and proppants and such, I guess I could collect money and get it occassionally, the cost for the web hosting is around 250 per year.
I will see what others think, so far three yes votes.
Happy to chip in $10/month, very few sites on the internet that allow intelligent conversation about vital topics. Would love for Dennis to have a premium subscription to shale profile
Stephen,
Cost is $259 per month, so maybe I could get it once or twice a year if donations allow and people are willing to donate.
Hey, just a cotton picking minute here guys. If Dennis gets a subscription to Shale Profile, what good will that do us? Will he be authorized to then post everything on Peakoil.com? I really don’t think so. Dennis would be wise to check out exactly what he would be authorized to post before he pays out so much money for a subscription.
On the contrary (to Ron), I’d be quite curious to see how the new data modifies his scenarios.
Ron,
Wise advice, I checked with Enno, I can share charts with the data, just need to say I got the data from shaleprofile.com.
Lloyd,
Thanks for the tip in Patreon, probably the way to go.
Still mulling it over.
Also would chip in. Though I rarely comment, I read the comments here nearly daily and would be much more bored without this site to occupy me and offer imo the only good peak oil discussion on the net.
That’s 4 by my count, besides me.
#Metoo#
Hoping the woke police don’t jump on me for using that phrase!
Now we are up to 5 in favor.
I looked further and realize an annual subscription would be required (I can’t just get the service for a couple of months) so the yearly cost is $3348 per year, yikes.
Let’s see if we get 6 people to donate $10/month (which is a stretch in my view). We would have enough money for a one year subscription in 4.65 years. So this seems to be unlikely, though I have no idea if anyone would donate and I think it looks like too much of a scam unless I drop the 3500 up front and ask for donations.
I would make sure I am allowed to use the data to create charts that can be posted on the blog, if not it may not be worth the money.
I would contribute.
Denis, you should look at Patreon (your subtle “Donate” button could lead to your Patreon page). It would let you take credit cards and Paypal without setting up accounts. You could get the Lite account, which would take about a 9% cut between their fees and payment processing charges.
It would allow us to make monthly payments: I know that a lot of Patreon clients make the most money from $1 to $3 monthly payments.
You could see how much you get before committing to Shale Profile. Even if the money went to yearly fees for hosting and to occasionally hire someone to assist with the tech side of the website, it’s worth doing.
Just so everyone knows, Enno Peters responded to my question about sharing what I learn from shaleprofile.
It is ok for me to use the data to create charts in a spreadsheet, I am not allowed to share large amounts of raw data. For exampe if I downloaded data into a spreadsheet it would not be ok for me to share that spreadsheet with others.
Perhaps it would be worth trying to see if money could be collected to do this. I will think about it. If I do it I will comment briefly, probably would locate a donate button near the top of the sidebar so it is visible.
Dennis and followers
I have no interest in getting paid for what I do these days. Up to a year ago, pre-COVID, I volunteered at our local hospital trying to raise money. It was fun but COVID shut volunteering down. I am at point in my life where it’s time to give back.
I became interested in peak oil when I read the seminal paper by Campbell in Scientific American around 1998. It was further tweaked by Simmons and Deffeyes a few years later. I am still interested in this subject and appreciate the feedback and animated professional discussion that occurs on this board.
So I will continue to take the EIA data and convert into charts and hopefully be around long enough to see who got it right, us or them.
Thanks Ovi.
Nothing for me thanks – please don’t bring it up again.
Sorry George,
I will not mention it again.
Thanks for sharing you extensive knowledge with us.
My take: neither you (Dennis), Ovi or George are asking for money. Patreon etc might be an option for the future but that in itself would need some admin work. Let sleeping dogs lie…
Mr Kaplan + Ovi , not are you gentlemen only intelligent but also gracious . A rare quality in these times . Appreciated .
+1
Ron, Ovi, George, and many others have contributed their work to this blog.
Ron deserves special credit for having created this in the first place, I am just trying to keep it going with a lot of help from Ovi and George Kaplan.
Thanks to all of them and also to all of you who share your thoughts and knowledge here.
Yes thanks all who contribute to the great work on this site! Perhaps we should just let sleeping dogs lie. The shale profile subscription is really expensive and may only add marginally to our understanding. I stand by my offer of helping to contribute to maintaining the site if that ever turns out to be useful.
Stephen,
It would make my job much easier, now I pick data from the charts by hand (those still available for free).
I think it would help a lot, still thinking about it, maybe I’ll put up adonation button to pay for hosting which comes out of my pocket since Ron handed over the blog to me and from Ron’s funds up to that point, not a huge expense about 200 to 300 per year. The subscription to shaleprofile is 10 times that, I can’t justify the expense out of my own pocket.
Dennis, I wonder if you could work out some deal to pay for a few months instead of a year… The yearly price tag seems prohibitive.
The EIA’s Monthly Petroleum Review just came out. May estimated production was up a mere 5,000 barrels per day to 10,955 kb/d. Looks like US production is going nowhere fast.
Just what I have been seeing. We have two rigs running since January and drilling twice a fast and production is up just 3%!!!!!
Good reading .
https://oilprice.com/Energy/Energy-General/How-Much-Oil-Can-Saudi-Arabia-Really-Produce.html?fbclid=IwAR3xXTshXKPqsoTx3pPj9tD6YQQjyZWTkCRChF830idZUHuxFK_Y9Wiq3VE
Another good one . This one from Kurt Cobb for those who have heard of him .
https://resourceinsights.blogspot.com/2021/06/shale-oil-and-gas-fraud-sign-of-peak-in.html
Thanks to all who keep this site running.
Yes Hightrekker, I second that. This site is so important, a rare piece of public petroleum truth.
Thanks Peter and High Trekker.
I third it. The site I spend the most time on.
Note: the only sites I will pay for are not behind paywalls just as the only software I will pay for is free.
Schinzy,
Thank you.
Just to be clear, I do not intend to have a paywall, simply a donate button, possibly through patreon which I will not mentioned unless people ask a question about it.
I am happy to donate as much you need to keep the site open. I have been following this site since the inception.
LTO Survivor,
Thanks. We will stay open, Mike Shellman complains that I should have all the data he has access to.
I don’t. Others have suggested I get donations so I have access to the shale profile professional data. It is quite expensive about 3500 per year, doubt we would get donations to support that.
A bit too much for me.
Some seem opposed, like Mr Shellman,
though he tends to disagree with me no matter what.
A few others think its worth a shot, I may try it, still undecided.
He is the most disagreeable person. Ever. I do appreciate his thoughts, though.
Greenbub,
I also enjoy his comments. He knows far more than me and is very much worth listening to imo.
I just thought about the Bakken and looked up rigs there. Just 20 running in ND, which is really something given the price of oil.
The Bakken really took off in 2008 when oil spiked over $100 and stayed strong after GFC. I will never forget oil prices falling over $100 in 3 months.
So, here we are a little over a decade later, and it looks like the Bakken’s growth days are behind it. Other than the Permian, where will there be shale growth? Even with the Permian, how much more can it grow?
Shallow sand,
Most tight oil growth will be from Permian basin. I did this scenario back in May.
I have not done one recently. My thinking changes as oil prices change. This scenario assumed a maximum WTI price of $70/bo.
New posts up
https://peakoilbarrel.com/annual-reserve-revisions-part-iv-shale-producers/
https://peakoilbarrel.com/open-thread-non-petroleum-june-26-2021/
I don’t “complain” about you not having the same data I do; where did THAT come from? You don’t know what to do with the data you HAVE. What are you whining at me for?
I don’t like your analyses of the future of US shale oil. Its not accurate and sends a message of abundance and financial sustainability, the absolute wrong message for Americans needing to conserve hydrocarbon and groundwater resources. The lie of abundant HZ tight oil resources leads to exporting, below costs, and is mortgaging our children’s future with debt. Private enterprise should stand on is own financial feet.
I spent 60 years of hard manual labor and took enormous financial risks, with my own money, to learn what I know about oil and natural gas, whatever that might be. I never asked anybody for financial help to further my “education.” If I wanted something I went out and by God worked for it.
I am only “disagreeable” toward people who seek relevance in an industry where relevance is EARNED. I don’t want anymore to do with any of this. That should help, Dennis; consider it my contribution. Please don’t mention my name anymore and I won’t question your personal interpretation of shale oil data. Predict away.
M,
Sorry, complain was a bad word choice. Perhaps points out that my analysis would be better if I got more detailed data would have been better.
On the abundance of my scenarios, I try to make the most realistic scenarios based on the information I have. If peak oil is to be taken seriously, then relatively accurate estimates of the future should be attempted. I interact with other oil pros at other blogs and typically they find my scenarios much too pessimistic.
Fernando Leanme used to find them pretty good. In fact there was a time that you thought they were not too bad, though it has been a few years (probably since 2017).
In any case I appreciate all you have taught us.
My scenarios are likely inaccurate, I agree. The basic assumption is that USGS mean TRR estimates are correct (as has been the case for the Bakken/Three Forks) for the Permian basin. Neither of us knows how the future will unfold, perhaps we might agree on that point. Do you have a rough estimate (or a range) for future Permian URR, my guess is 27 Gb to 58 Gb. I have no doubt that your guess would likely be better than mine.
My analysis assumes average well spacing of 0.2 miles (1056 feet), not sure if that qualifies as a child well.