By Ovi
The focus of this post is an overview of World oil production along with a more detailed review of the top 11 Non-OPEC oil producing countries. OPEC production is covered in a separate post.
Below are a number of Crude plus Condensate (C + C) production charts, usually shortened to “oil”, for oil producing countries. The charts are created from data provided by the EIA’s International Energy Statistics and are updated to December 2024. This is the latest and most detailed/complete World oil production information available. Information from other sources such as OPEC, the STEO and country specific sites such as Brazil, Norway, Mexico, Argentina and China is used to provide a short term outlook.

World oil production increased by 383 kb/d in December to 82,386 kb/d, green graph. The largest increases came from Brazil, 109 kb/d and US, 95 kb/d. January’s World oil production is projected to decrease by 165 kb/d to 82,121 kb/d.
This chart also projects World C + C production out to December 2026. It uses the April 2025 STEO report along with the International Energy Statistics to make the projection.
For December 2026, production is projected to be 83,936 kb/d. The December 2026 oil production is lower than the November 2018 peak by 656 kb/d. December 2026 production has been revised down by 187 kb/d from the previous report. December 2026 crude has been downwardly revised by 289 kb/d.
From December 2023 to December 2026, World oil production is estimated to increase by 920 kb/d.
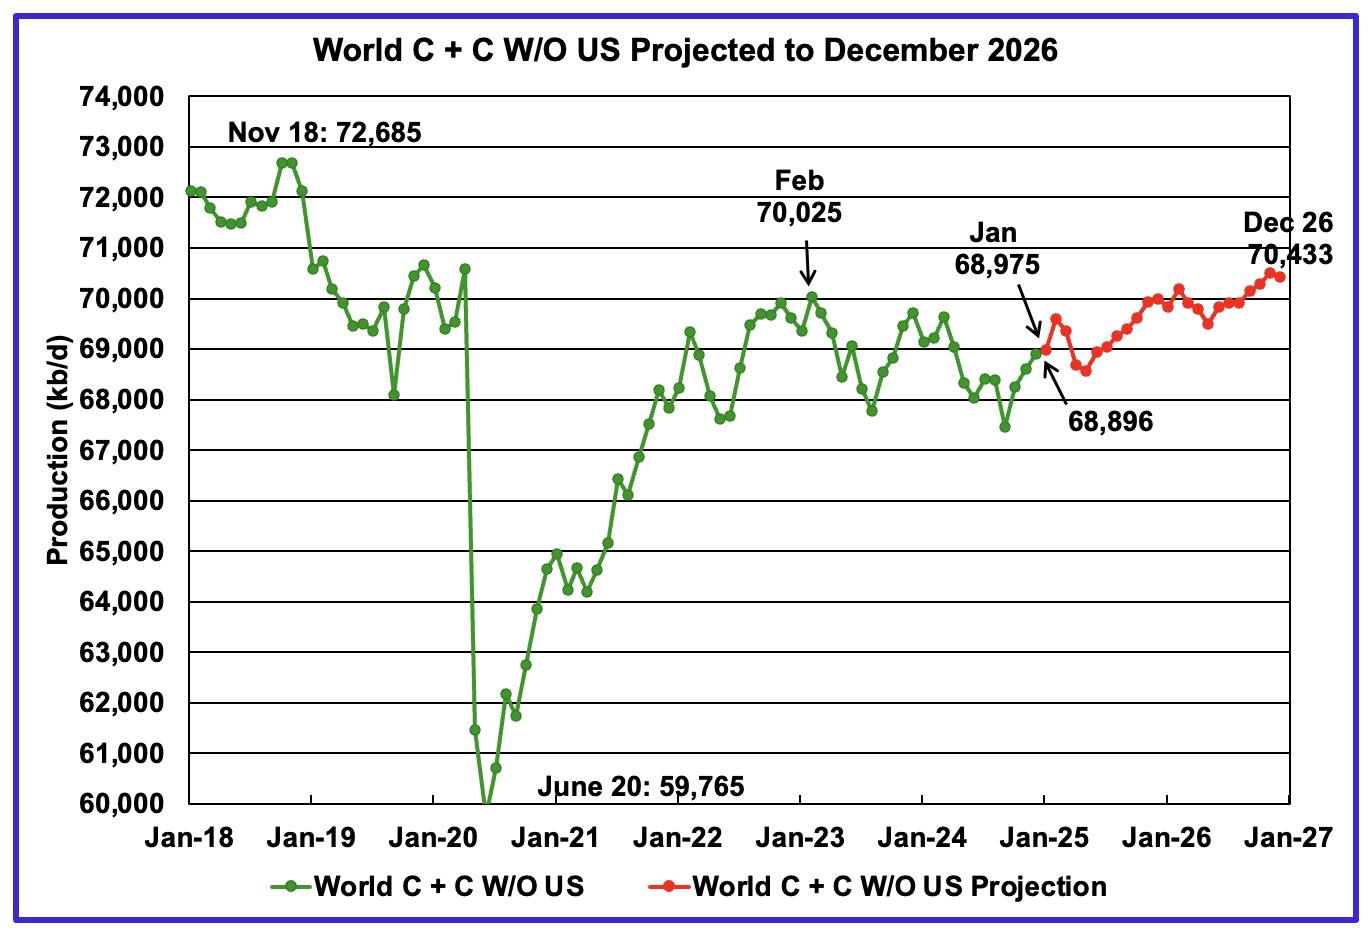
December’s World oil output without the US increased by 288 kb/d to 68,896 kb/d. January’s production is expected to increase by 79 kb/d to 68,975 kb/d.
The projection is forecasting that December 2026 crude output will be 70,433 kb/d. Note that the December 2026 output is 2,252 kb/d lower than the November 2018 peak of 72,685 kb/d.
World oil production W/O the U.S. from December 2024 to December 2026 is forecast to increase by a total of 1,537 kb/d.
A Different Perspective on World Oil Production
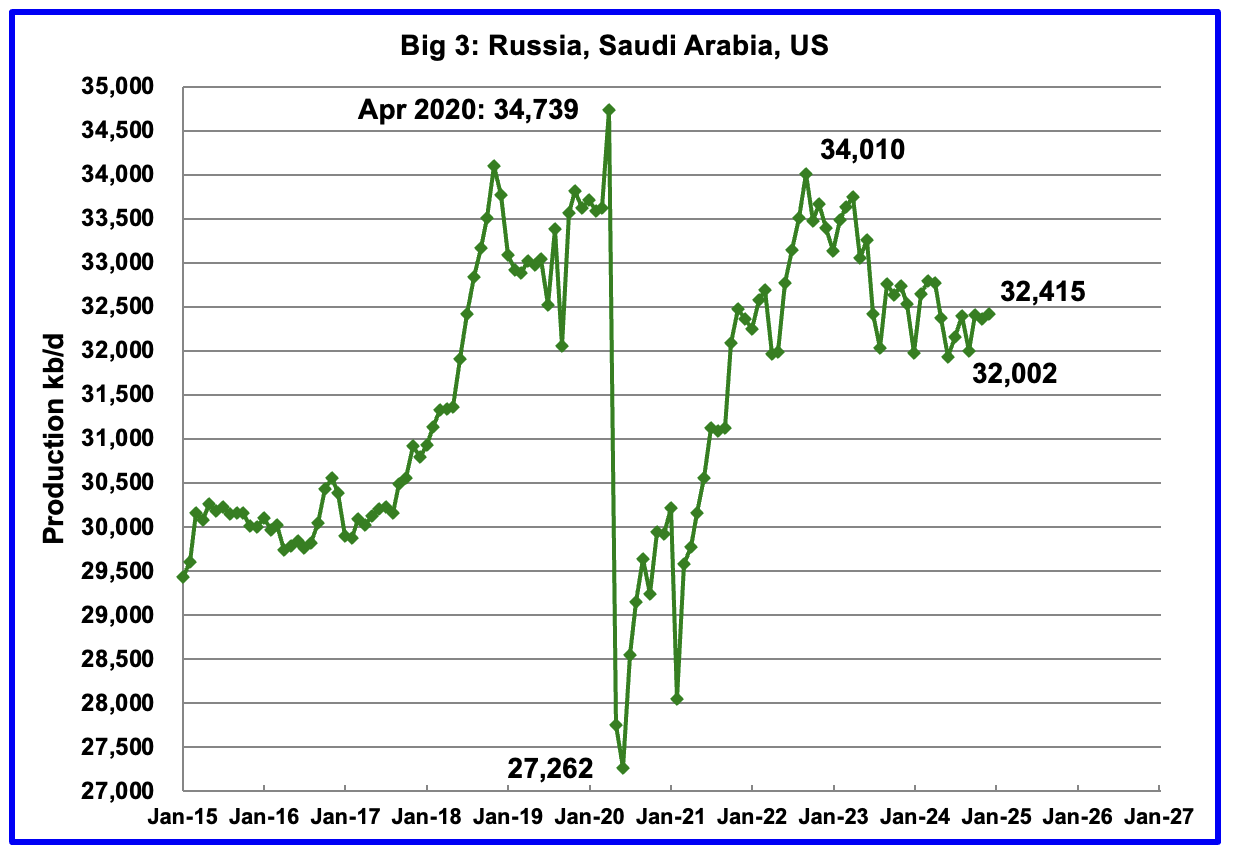
Peak production in the Big 3 occurred in April 2020 at a rate of 34,739 kb/d. The peak was associated with a large production increase from Saudi Arabia. Post covid, production peaked at 34,010 kb/d in September 2022. The production decline since then is primarily due to cutbacks by Saudi Arabia and Russia.
December’s Big 3 oil production increased by 55 kb/d to 32,415 kb/d. Production in December was 1,595 kb/d lower than the September 2022 post pandemic high of 34,010 kb/d.
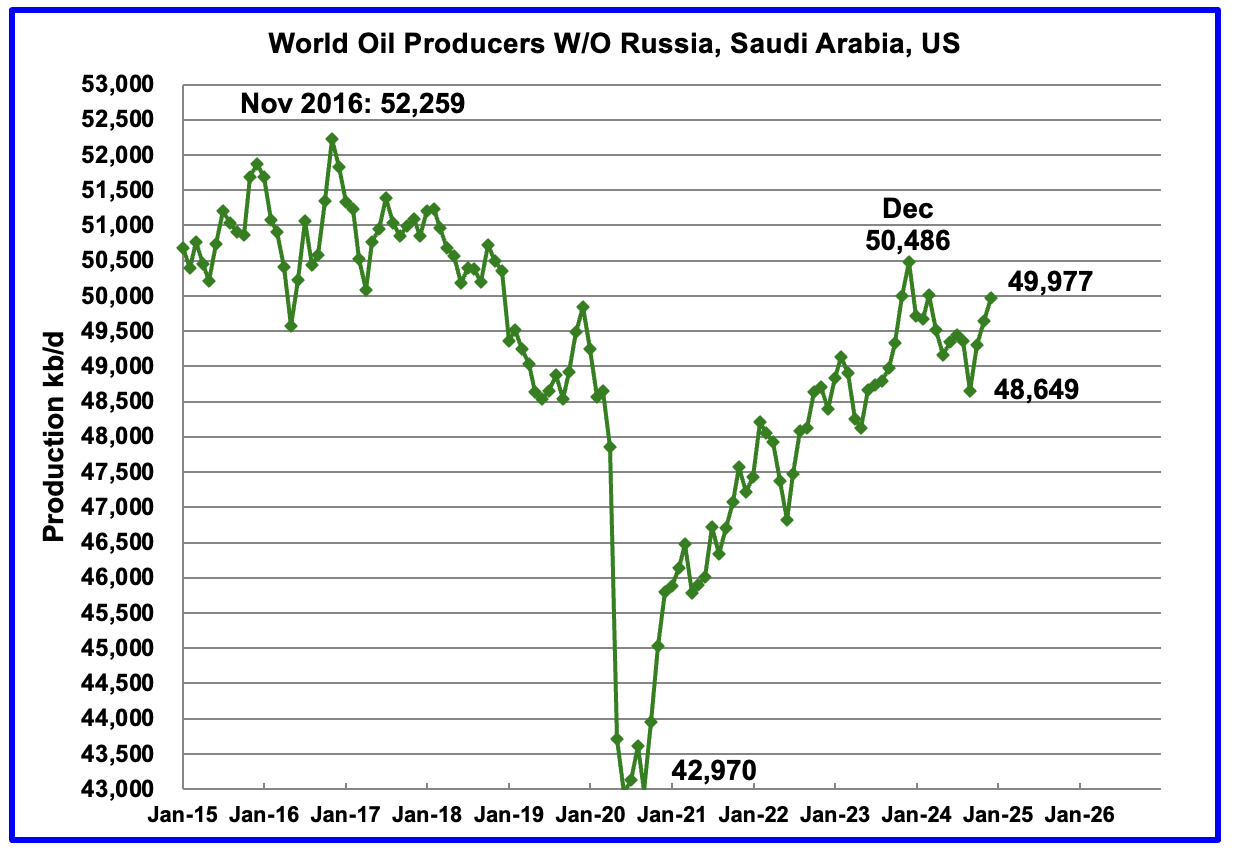
Production in the Remaining countries had been slowly increasing since the September 2020 low of 42,970 kb/d to December 2023. Production has been rising for the last three months and output in December increased by 334 kb/d to 49,977 kb/d and is now 509 kb/d lower than December 2023.
Countries Expected to Grow Oil Production
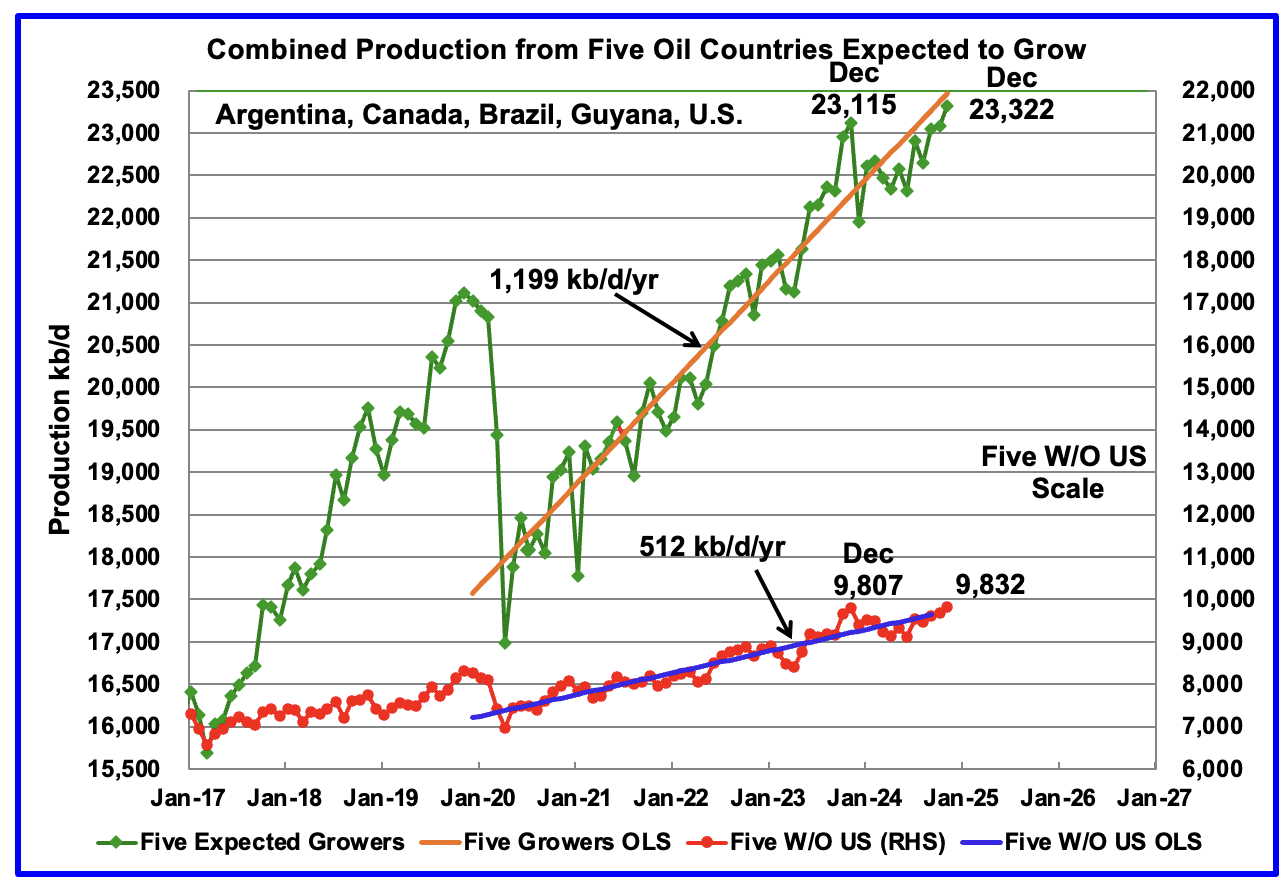
This chart was first posted a few of months back and shows the combined oil production from five Non-OPEC countries, Argentina, Brazil, Canada, Guyana and the U.S., whose oil production is expected to grow. These five countries are often cited by OPEC and the IEA for being capable of meeting the increasing World oil demand for next year. For these five countries, production from April 2020 to August 2024 rose at an average rate of 1,199 kb/d/year as shown by the orange OLS line.
To show the impact of US growth over the past 5 years, U.S. production was removed from the five countries and that graph is shown in red. The production growth slope for the remaining four countries has been reduced by 687 kb/d/yr to 512 kb/d/yr.
December production has been added to the five growers chart, up 236 kb/d to 23,322 kb/d. For the Five growers W/O U.S., December production rose by 141 kb/d to 9,832 kb/d, up 25 kb/d from December 2023.
The OLS lines have not been updated and will not be updated going forward unless additional production data provides a strong indication that production is rising.
Production up to December 2023 may be a situation where the past is not a good indicator of the future. In this case it may be more important to focus on what has happened to production after December 2023 rather than before.
Countries Ranked by Oil Production
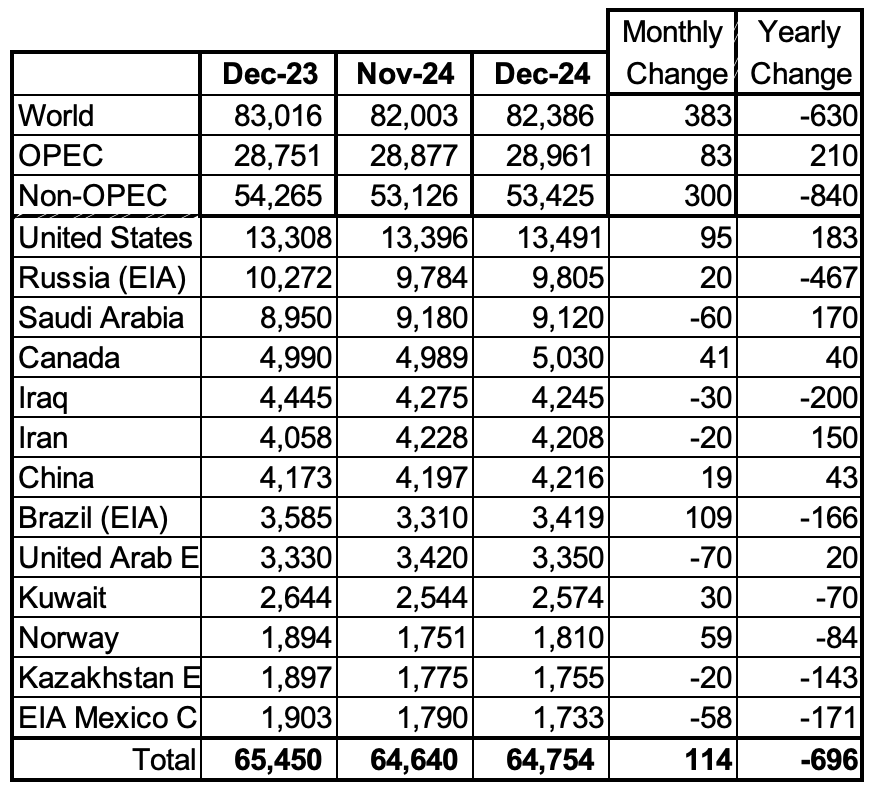
Above are listed the World’s 13th largest oil producing countries. In December 2024, these 13 countries produced 78.6% of the World’s oil. On a MoM basis, production increased by 114 kb/d in these 13 countries while on a YOY basis, production dropped by 696 kb/d.
December Non-OPEC Oil Production Charts
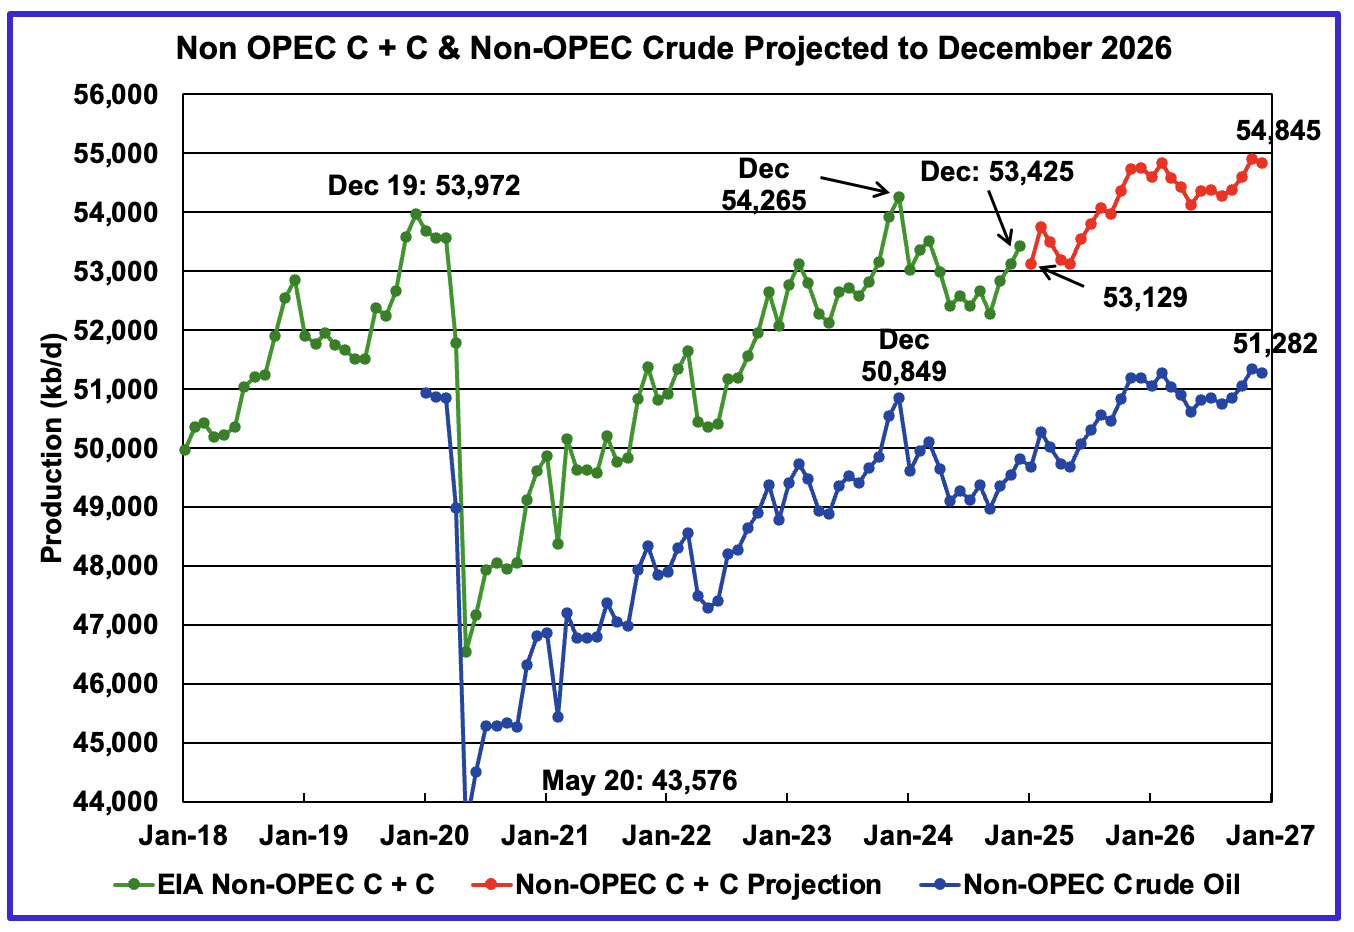
December’s Non-OPEC oil production increased by 300 kb/d to 53,425 kb/d.
Using data from the April 2025 STEO, a projection for Non-OPEC oil output was made for the period January 2025 to December 2026. (Red graph). Output is expected to reach 54,845 kb/d in December 2026. December 2026 was revised down by 70 kb/d from the previous report.
From December 2024 to December 2026, oil production in Non-OPEC countries is expected to increase by 1,420 kb/d.
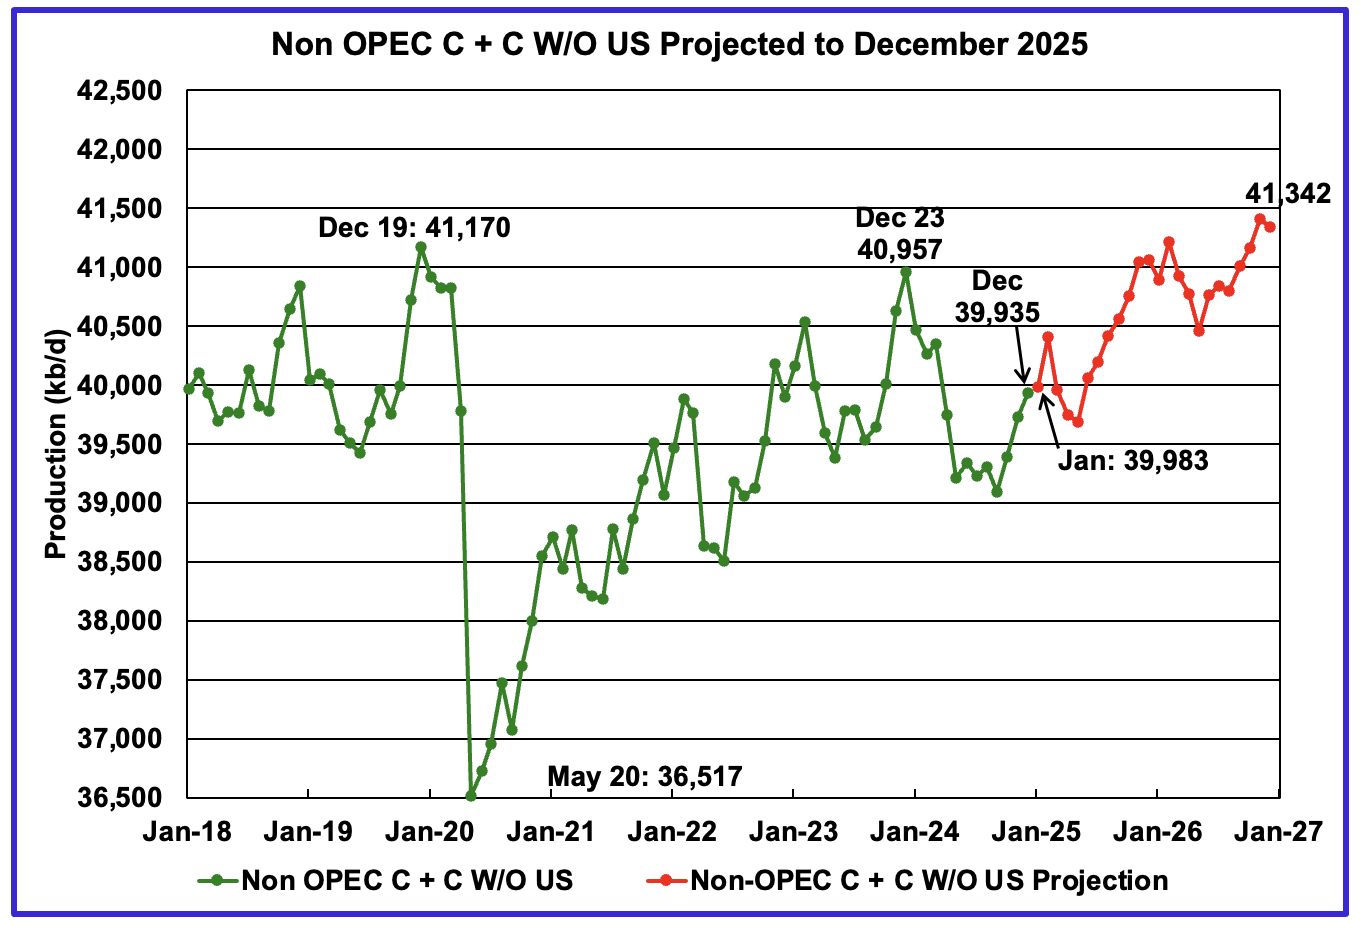
December’s Non-OPEC W/O US oil production rose by 205 kb/d to 39,935 kb/d. January’s production is projected to rise by 48 kb/d to 39,983 kb/d.
From December 2024 to December 2026, production in Non-OPEC countries W/O the U.S. is expected to increase by 1,407 kb/d. December 2026 production is projected to be 172 kb/d higher than December 2019, essentially no growth over seven years. December 2026 production was revised up 125 kb/d from the last report to 41,342 kb/d
Non-OPEC Oil Countries Ranked by Production
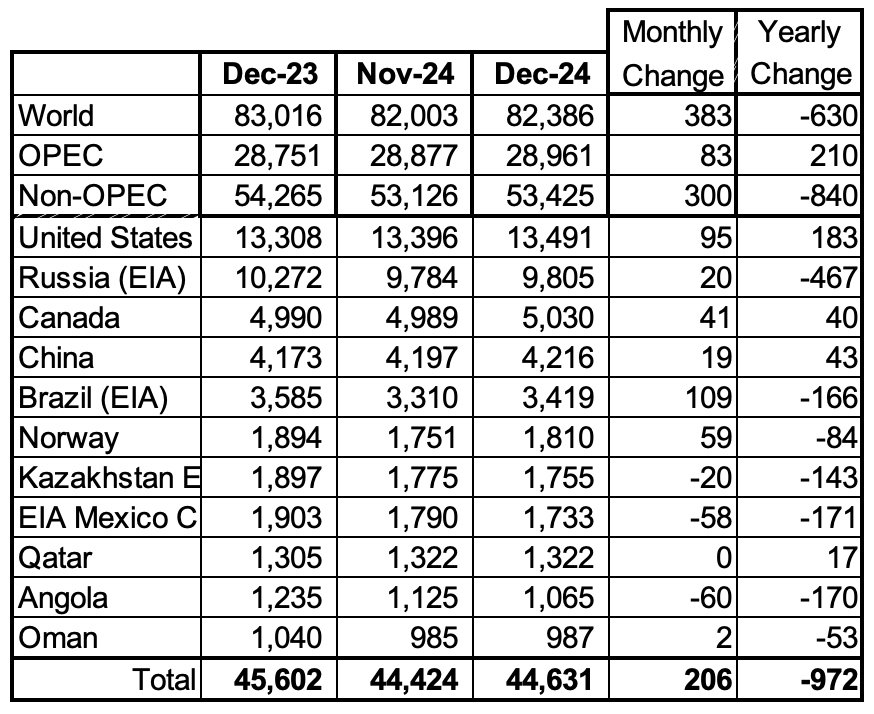
Listed above are the World’s 11 largest Non-OPEC producers. The original criteria for inclusion in the table was that all of the countries produced more than 1,000 kb/d. Oman has recently fallen below 1,000 kb/d.
December’s production increased by 206 kb/d to 44,631kb/d for these eleven Non-OPEC countries while as a whole the Non-OPEC countries saw a yearly production loss of 840 kb/d to 53,425 kb/d.
In December 2024, these 11 countries produced 83.6% of all Non-OPEC oil.
Non-OPEC Country’s Oil Production Charts
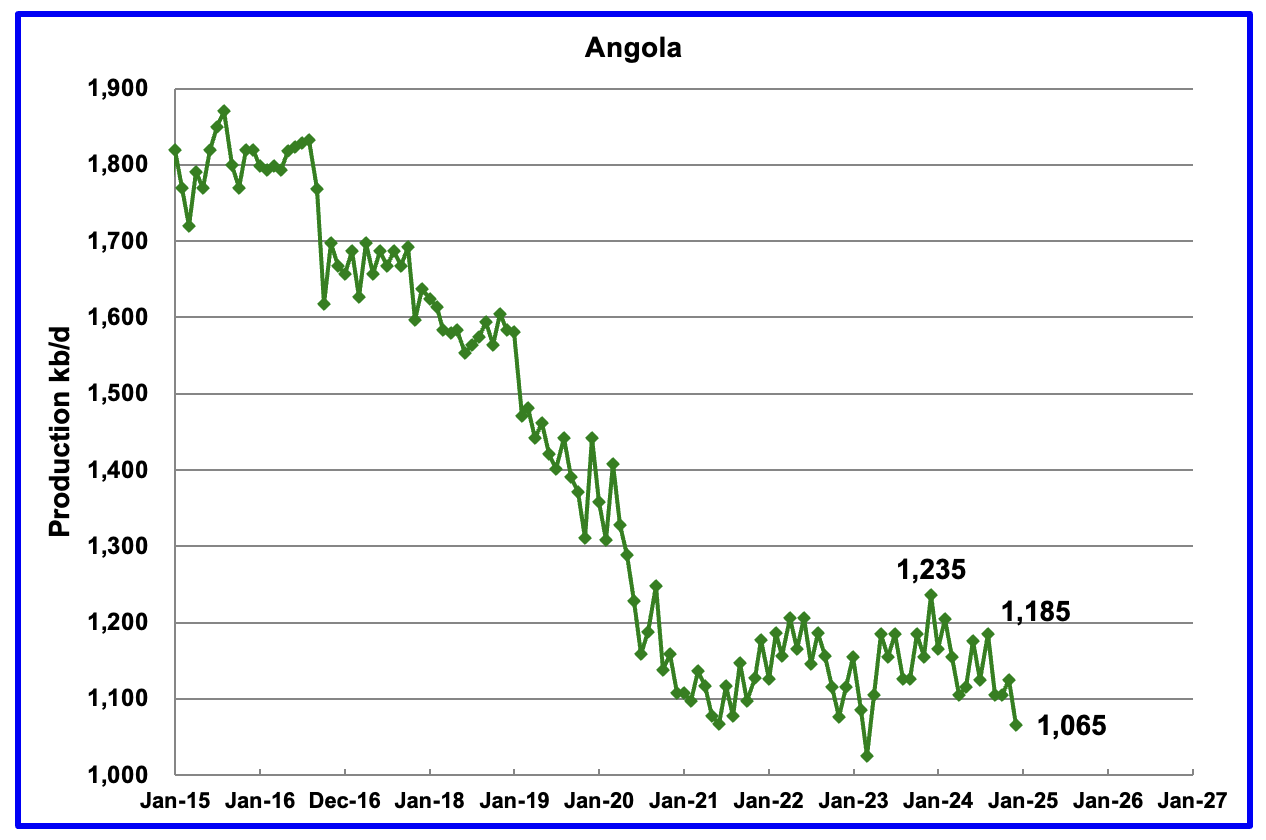
Angola’s December production dropped by 60 kb/d to 1,065 kb/d. Since early 2022 Angola’s production appears to have settled into a plateau phase between 1,100 kb/d and 1,200 kb/d. However December brought a drop below that plateau.
According to the March OPEC MOMR: “Growth is set to be driven by the US, Brazil, Canada and Norway, with the main decline anticipated in Angola. Is the December drop the beginning of the forecast decline for Angola?
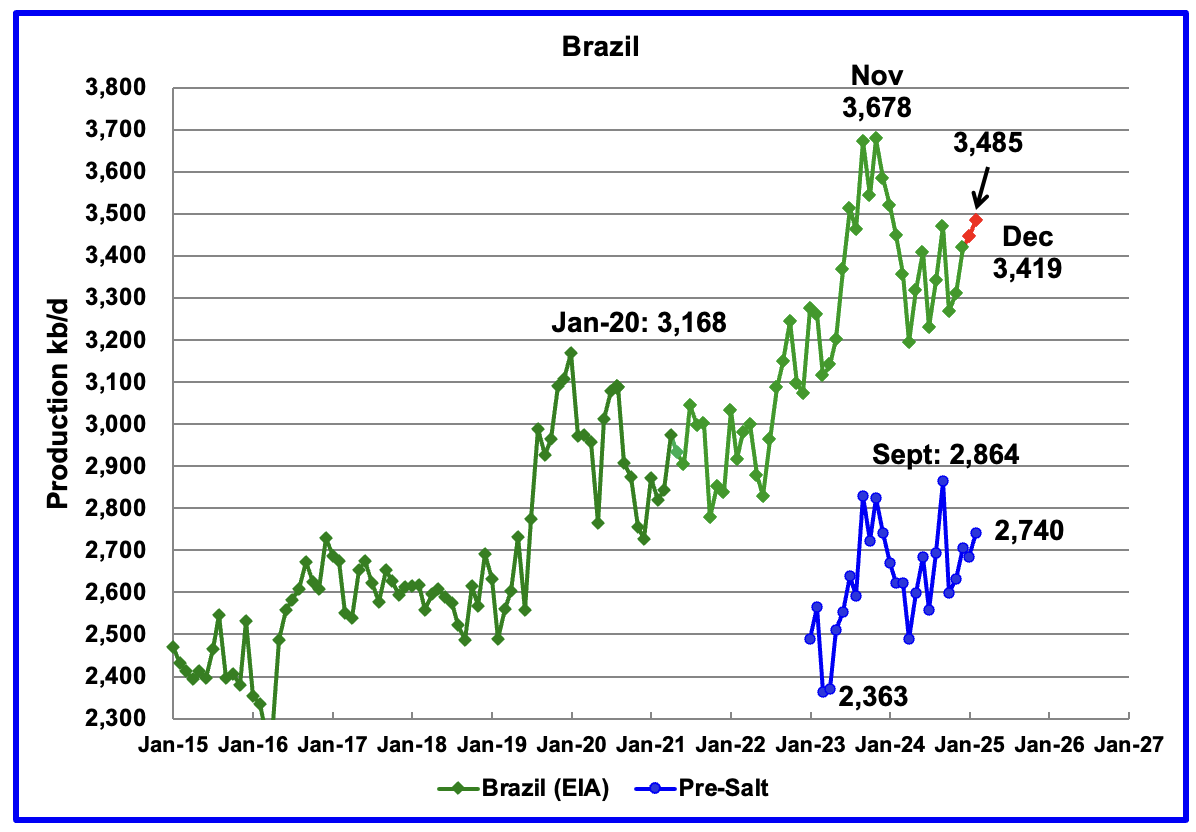
The EIA reported that Brazil’s December production increased by 109 kb/d to 3,419 kb/d.
Brazil’s National Petroleum Association (BNPA) reported that production increased in January and February to 3,485 kb/d. The pre-salt graph tracks Brazil’s trend in the crude oil graph. For February, pre-salt production increased by 55 kb/d to 2,740 kb/d.
The December to February increase could be related to the addition of the two new floating platforms. The December OPEC report states that two new floating production storage and offloading (FPSO) platforms came online in November. It also mentions operational issues and slow ramp-ups in several offshore platforms continue to be an issue.
The March OPEC report states “Petrobras initiated production from the FPSO Almirante Tamandaré (Buzios 7) in mid-February at the Buzios field, located in the pre-salt layer of the Santos Basin, as the sixth production system in this field.” It also states that scheduled startup of planned new platforms could be delayed, “Nevertheless, operational issues and unplanned disruptions could potentially delay some scheduled start-ups from the platforms.”
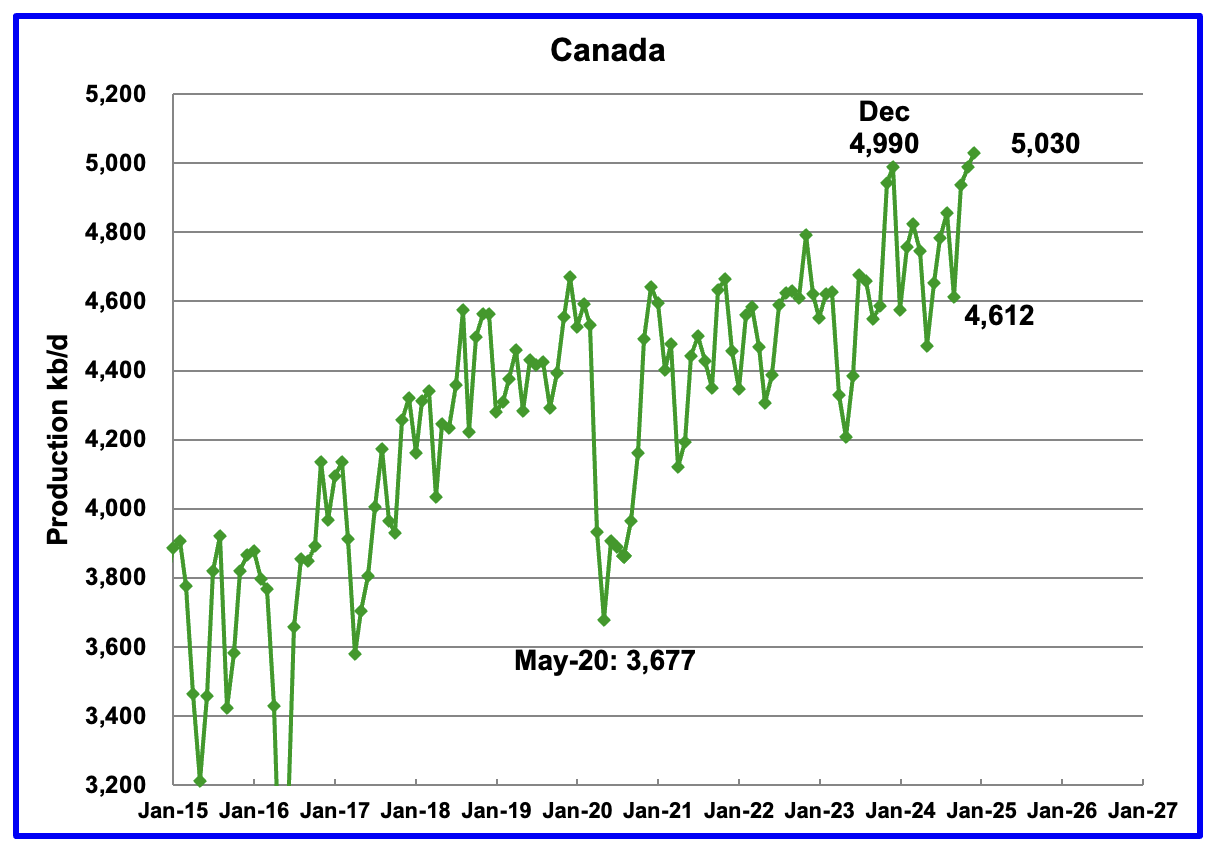
Canada’s production increased by 41 kb/d in December to 5,030 kb/d a new record high. The increase is primarily due to site restarts related to wild fires in the oil sands area around Fort McMurray, the completion of maintenance and enhancements to oil sands cokers and bringing new SAGD sites online.
Canada has escaped US tariffs on its crude oil, natural gas and refined products according to this Article. Regardless it is not clear how the $10/b drop in WTI will affect production going forward.
“His administration’s latest sweeping tariffs on global trading partners exclude crude oil, natural gas and refined products, and Canadian goods, including energy, that are compliant with the Canada-United States-Mexico Agreement (CUSMA) will continue to move free of tariffs across the border.”
While no tariffs have been levied, Canada has woken up to the risks associated with becoming too close/dependant to a very close trading neighbour. There is much talk of building new pipelines to tidewater.
An election is scheduled in Canada for April 28. Both major parties are indicating a friendlier approach to oil sands production than the previous government.
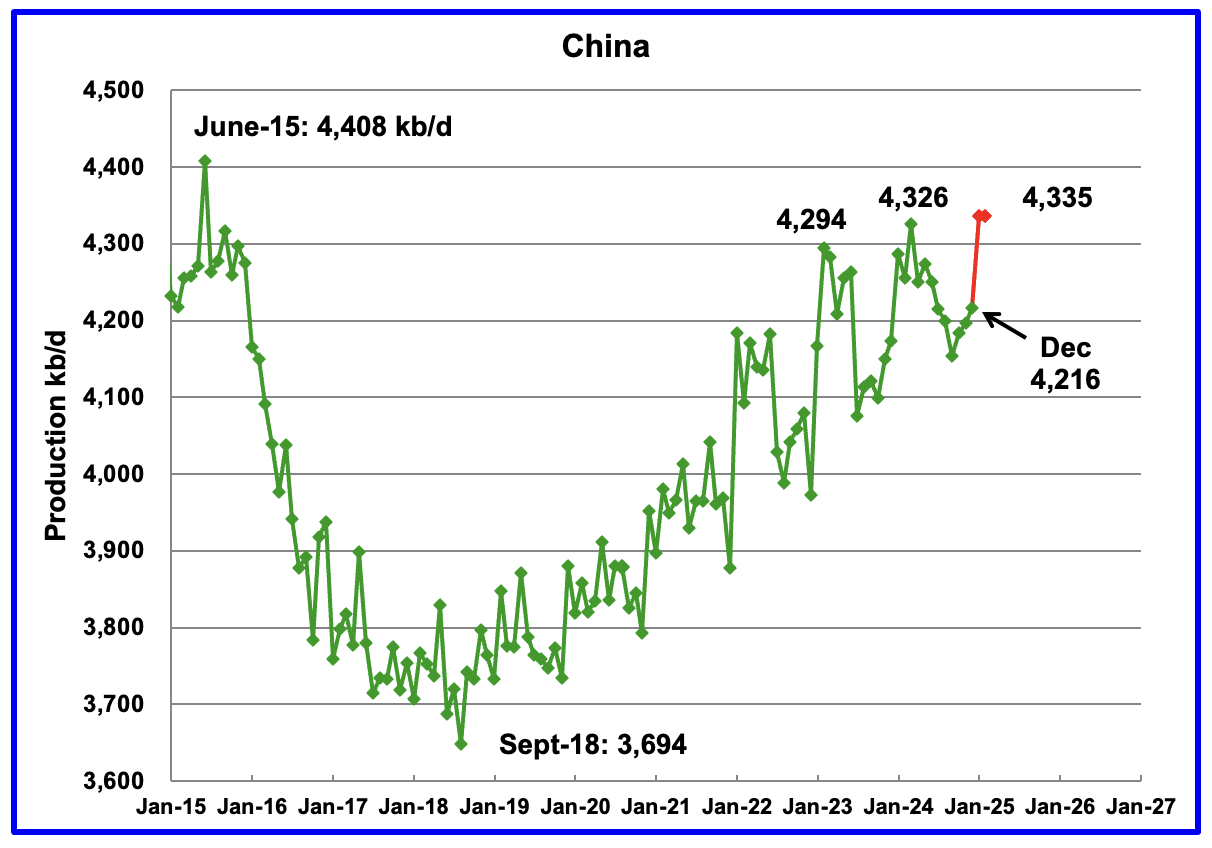
The EIA reported China’s December oil output increased by 19 kb/d to 4,216 kb/d.
The China National Bureau of Statistics reported average production for January and February. The average came in at 4,335 kb/d. January/February production added 119 kb/d to 4,335 kb/d, red markers. This is a new high for China’s oil production. However note the slowing growth trend associated with the last three peaks. Has China reached peak production?
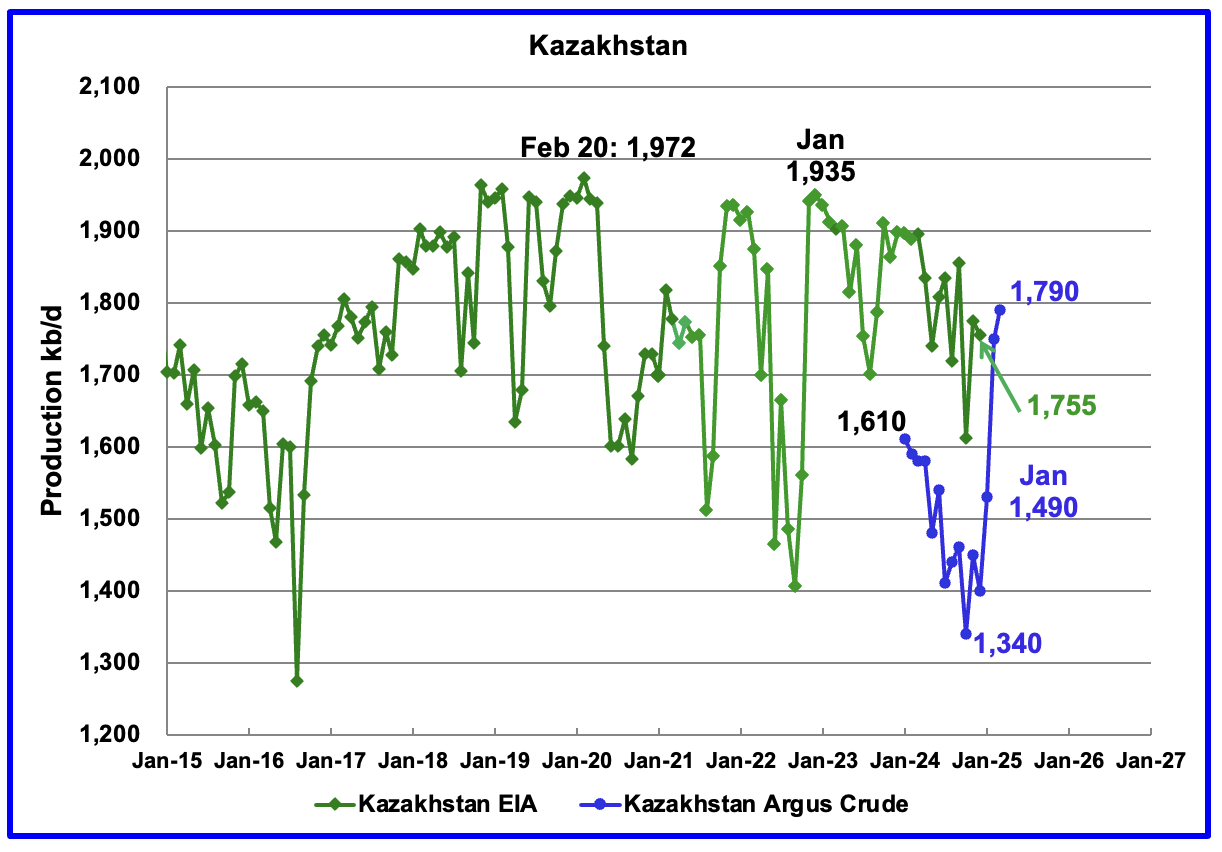
According to the EIA, Kazakhstan’s oil output decreased by 20 kb/d in December to 1,755 kb/d.
Kazakhstan’s recent pre-salt crude oil production, as reported by Argus, has been added to the chart. In October pre-salt crude production dropped by 120 kb/d to a low 1,340 kb/d. Since then production has risen by 450 kb/d. February production came in at 1,790 kb/d due to a New Field coming online. Note this is Crude whereas the EIA numbers are C + C.
Kazakhstan’s OPEC crude production target is 1,468 kb/d. At 1,790 kb/d, Kazakhstan is 322 kb/d over their target. According to this Article, Kazakhstan does not expect any major reduction in crude output in April after massively exceeding its Opec+ target in March.
Since Kazakhstan’s reduction promises have not materialized, OPEC announced it would “accelerate plans to revive halted supplies next month, with an increase triple the size originally scheduled”, according to this Article. The May production increase will be 411 kb/d.
Combined with the Trump tariffs the increase dropped the price of WTI/Brent by close to $10/b over two days. OPEC is trying to send a message to comply to Kazakhstan.
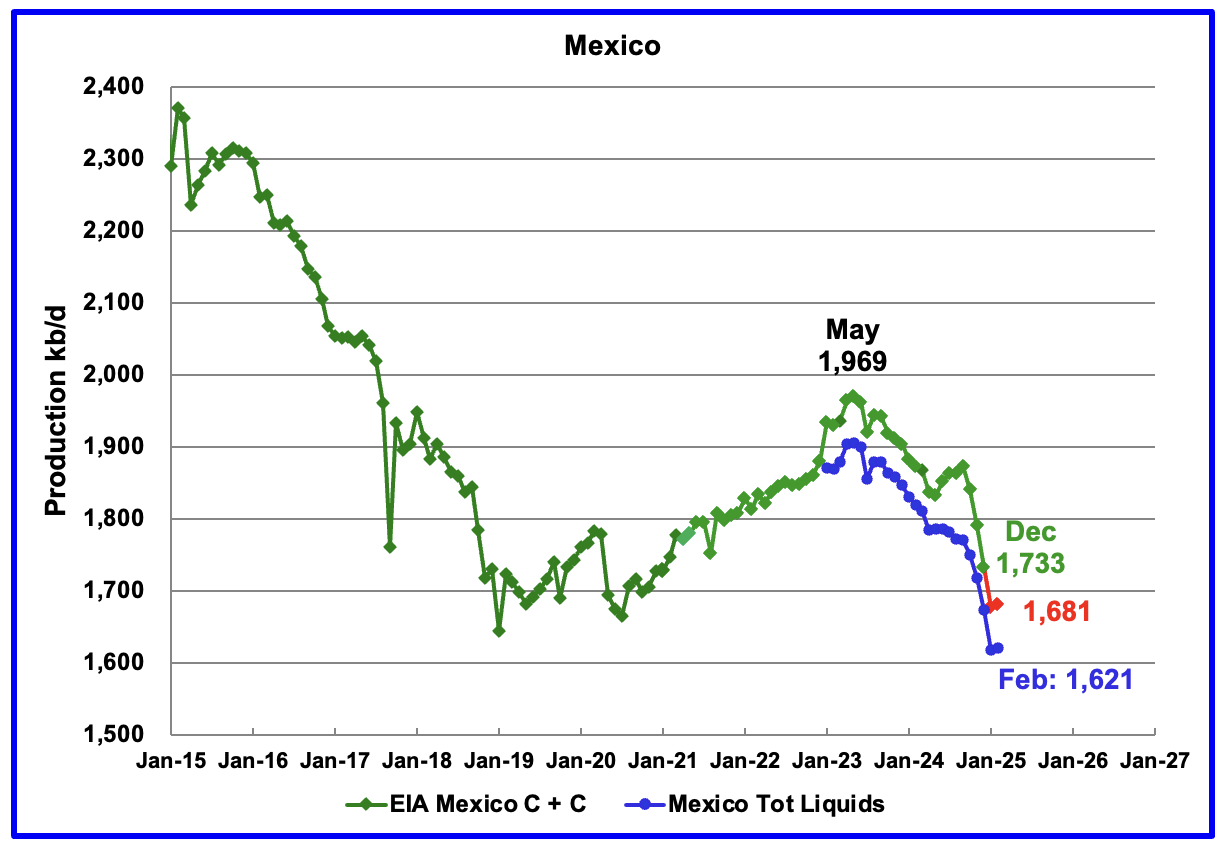
According to the EIA, Mexico’s December output dropped by 58 kb/d to 1,733 kb/d.
In June 2024, Pemex issued a new and modified oil production report for Heavy, Light and Extra Light oil. It is shown in blue in the chart and it appears that Mexico is not reporting condensate production when compared to the EIA report.
In earlier reports, the EIA would add close to 55 kb/d of condensate to the Pemex report. However for October and November it was increased to 122 kb/d and 117 kb/d respectively. For December, the condensate addition has returned close to its original increase of 55 kb/d. The December addition was 60 kb/d.
For January and February production, 60 kb/d have been added to the Pemex production to estimate Mexico’s January and February C + C production, red markers. Note that Mexico’s production, according to Pemex, has continued to fall every month since May 2023, except for one month. However February’s oil production is little changed from January.
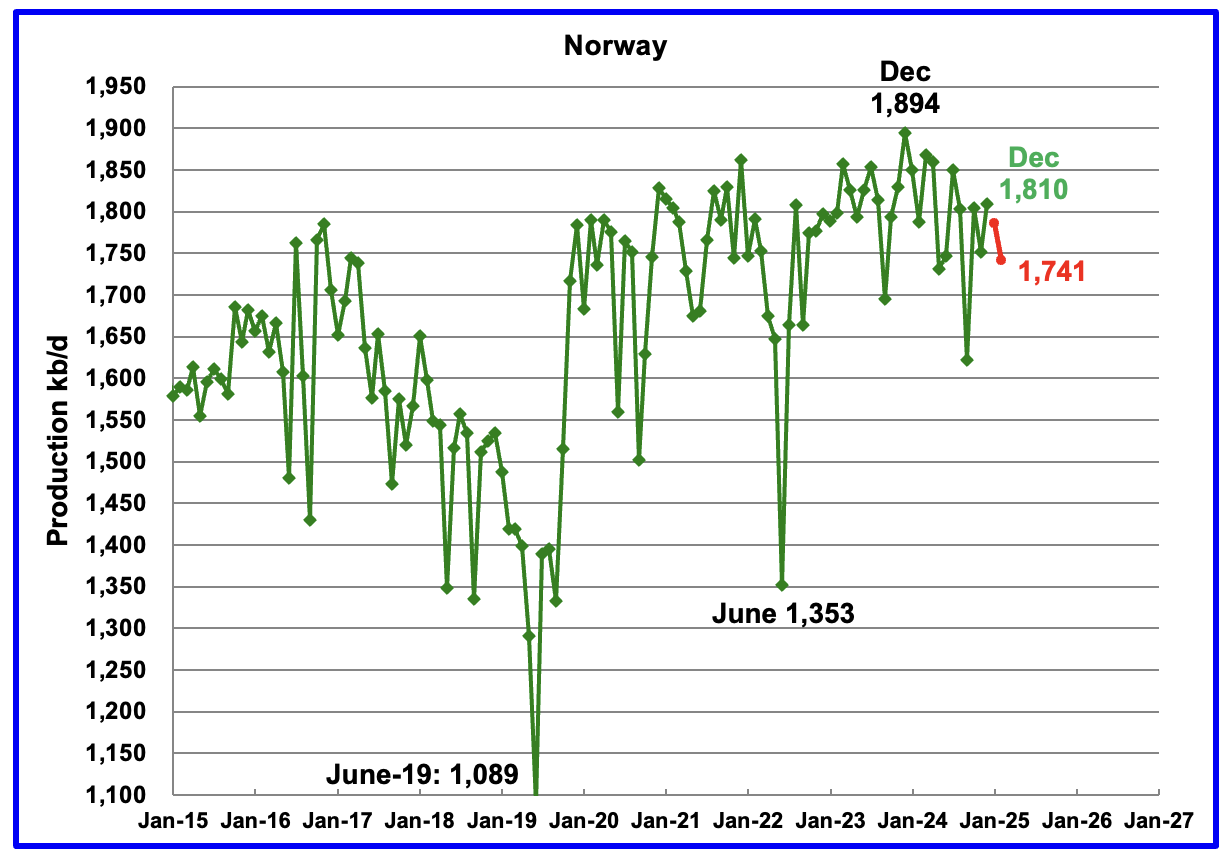
The EIA reported Norway’s December production rose by 59 kb/d to 1,810 kb/d.
Separately, the Norway Petroleum Directorate (NPD) reported that January production decreased by 24 kb/d to 1,786 kb/d and February dropped to 1,741 kb/d, red markers.
The Norway Petroleum Directorship reported that February’s oil production was 1.3% above forecast.
Last month S & P Global reported that the Johan Sverdrup oil field is expected to start declining from late-2024/early-2025.
“Europe’s highest producing oil field, Johan Sverdrup, is expected to start declining in late-2024 or early-2025 — earlier than expected — amid increased signs of water production at some wells”.
Are the January and February drops the beginnings of Norway’s steady oil production decline?
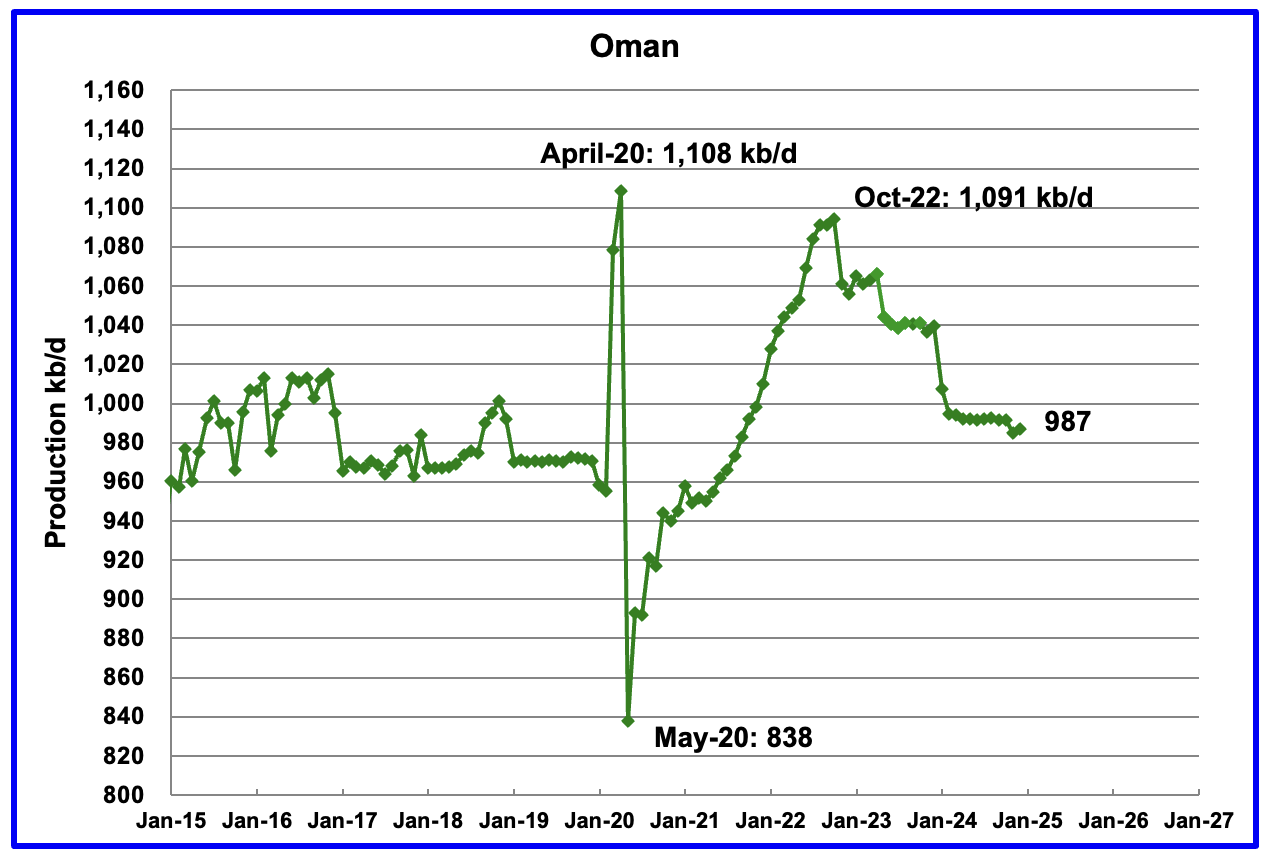
Oman’s production had risen very consistently since the low of May 2020. However production began to drop in November 2022. According to the EIA, December’s output rose by 2 kb/d to 987 kb/d.
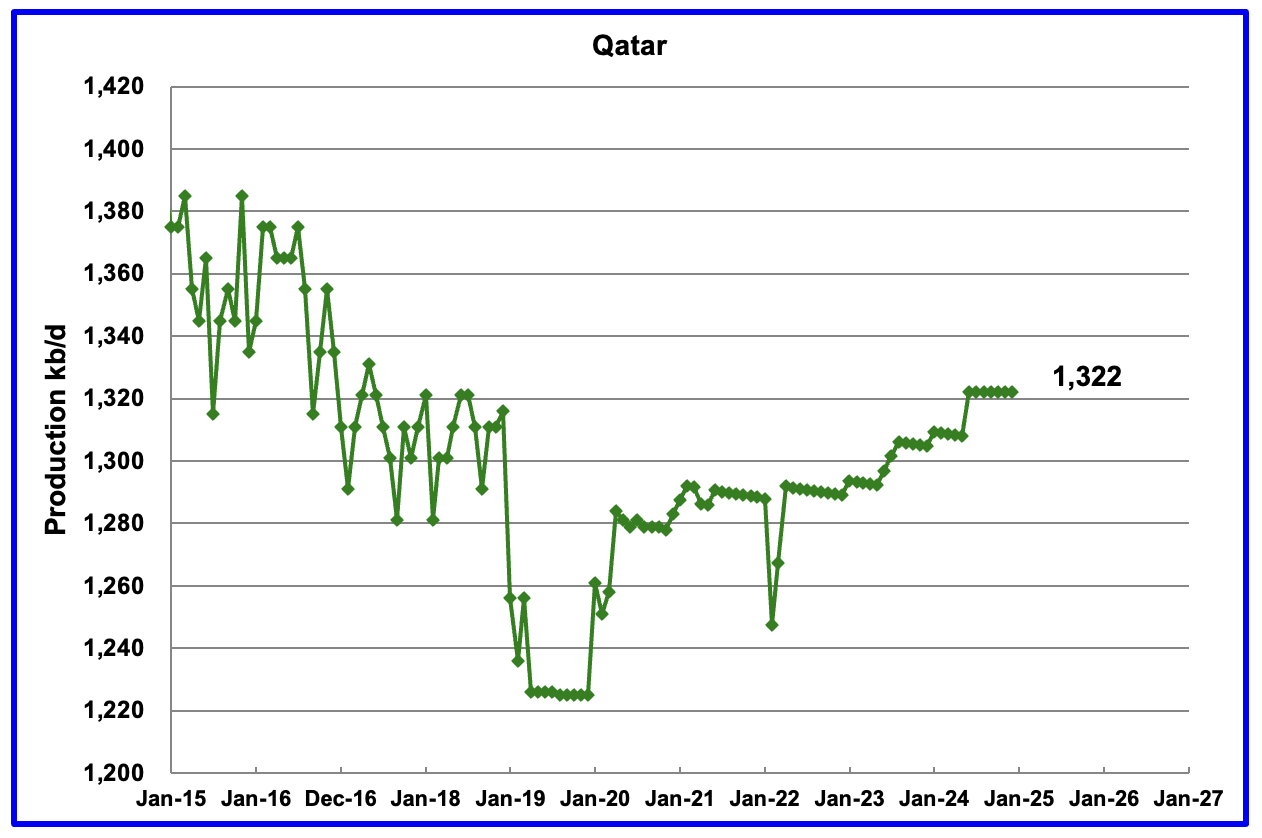
The EIA had been reporting flat output of 1,322 kb/d for Qatar since early 2022. However the EIA has revised down all of the previous production data. Qatar’s December output was reported again to be 1,322 kb/d.
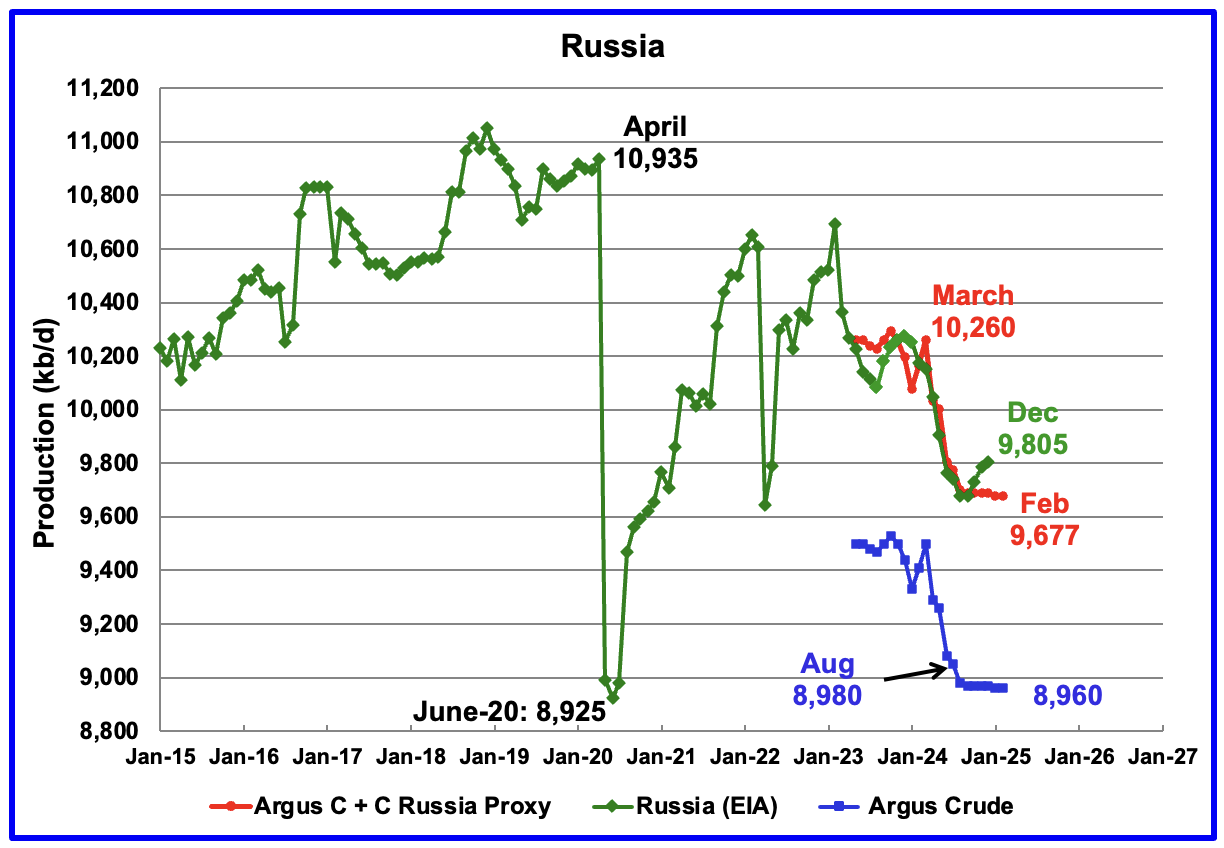
The EIA reported Russia’s December C + C production rose by 20 kb/d to 9,805 kb/d and was down 455 kb/d from March 2024. It is also 117 kb/d higher than the Argus Russia proxy estimate of 9,688 kb/d for December.
Unfortunately S & P Global and Argus are not providing oil production information for the OPEC + countries as of March 2025.
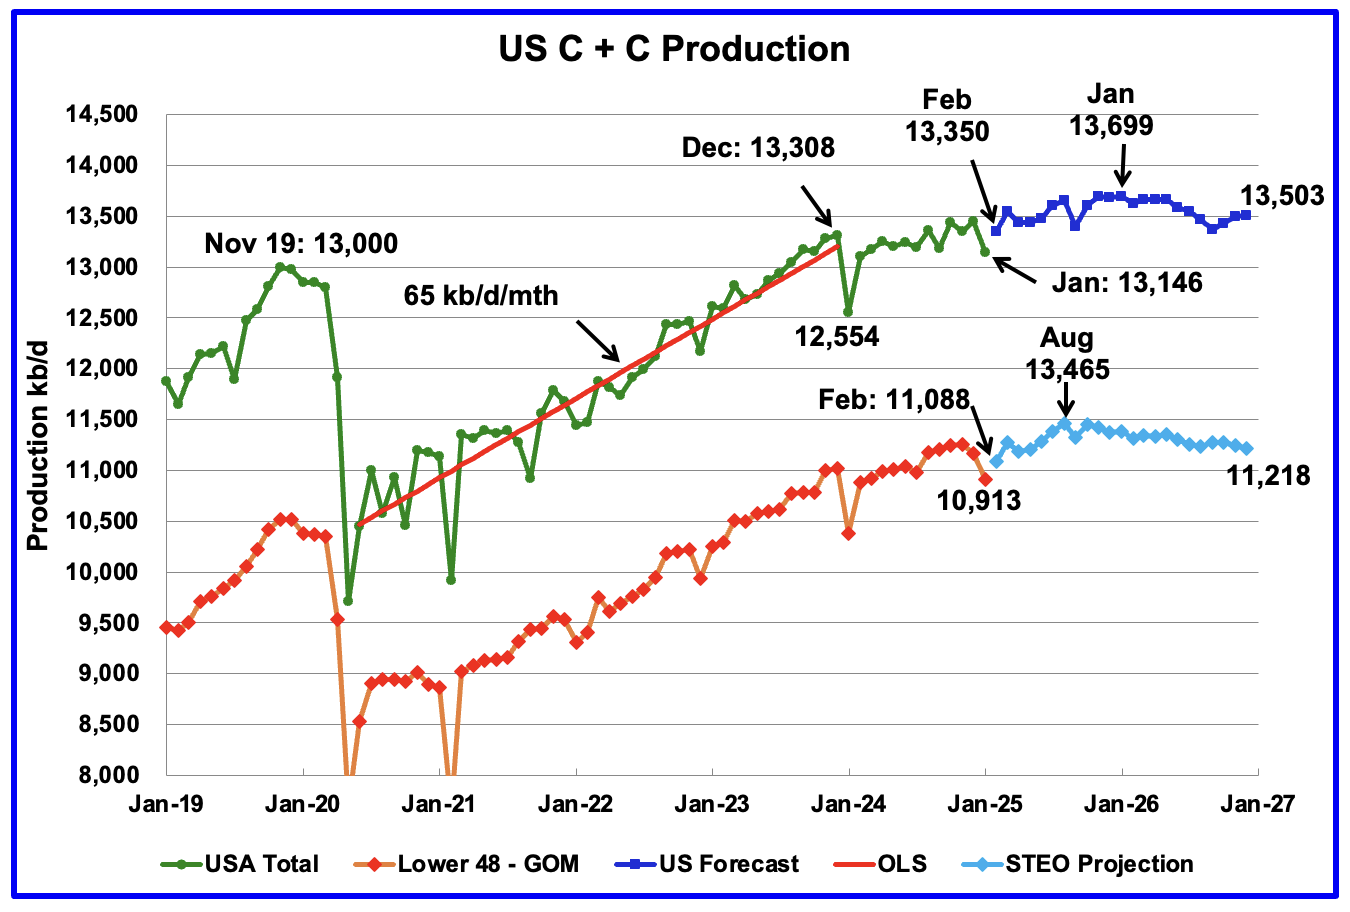
This US production chart is very similar to the one published last week in the US update post. However the STEO portions of the two graphs have been updated using the April 2025 STEO.
Production in December 2026 at 13,503 kb/d is 195 kb/d lower than reported in the previous post. For the onshore L48, oil production starts to fall after August 2025 and production is anticipated to be 11,218 kb/d, revised down from 11,440 kb/d in the previous post.

Normally, Argentina oil production is not reported because its production is lower than 1,000 kb/d. However production has been steadily rising over the last five years due to the startup of shale oil and gas production in the Vaca Muerta basin.
According to this Article, “Vaca Muerta production could hit the 1Mb/d mark by the end of the decade, up from around 420,000b/d at the end of 2024. YPF and Vista Energy account for around 70% of production.”
In December, the EIA reported Argentina’a production rose 7 kb/d to 758 kb/d.
The Argentinian Energy Secretariat reported oil production in February dropped to 744 kb/d.
Hickory
The answer to your question in the US post may be in this post.
Thanks for the good work Ovi. Canada up to 5 Mbpd…milestone.
I know that there is no accurate answer to the question (at year 2040 which few countries will still have export capacity?), but worth pondering the implications.
I’d say the bigger problem will be for exporters: what will they do when their customers leave? China is moving fast to reduce oil consumption, Europe is close behind. The US will get serious about reducing oil consumption when it is forced to, and then it will be able to move very fast.
Developing countries are waking up: Asia, Africa. The global transition is being held back by political maneuvers by oil exporters and oil defenders like Charles Koch and Rupert Murdoch, but they’re gradually losing the fight.
Russia, KSA and the ME will be in a world of hurt. Canada and the US will be fine…
How many electric cars and trucks in Africa and South America?
How many electric cars and trucks in the former Soviet Union?
That’s 2.3 billion people
I’m not quite sure what you’re suggesting. There’s nothing stopping Africa and S. America from electrifying – China is selling very cheap EVs, and both Africa and most of S. America have great solar insolation.
I agree that oil exporters like Russia and some of the FSU will be slow to convert – that will be painful for them, I agree.
If the available oil imports disappear. Think this thing through. Coal production in say Indonesia will fall. Nickel production in Indonesia will fall.
The supply of nickel to make batteries will fall.
Same thing can be said about Mexico’s silver production. Which is also needed.
China isn’t going to be mass producing everything under the sun so other countries can have cheap solar 20 years from now. They will be doing good just to replace the first generation of solar farms and wind farms in 20 years for themselves.
Global supply chains for the most part are going away. Everything will have to be produced at home or much closer to home. With the resources that are available at home or close to home.
A lot of the building and construction of things currently is for a future that isn’t going to be there.
All the ship building that happens in South Korea and China. It takes a lot of energy usage primarily coal usage to build all those ships. A lot of them will be sitting idle and anchored somewhere with no cargo 20 years from now.
There is no real plan. Everyone is just trying to make a buck not realizing that the future will be very different than their current reality.
If the available oil imports disappear.
Why should oil imports disappear? Oil exporters will be desperate for customers, and will sell to anyone willing to pay.
Your arguments seem to assume that oil will disappear quickly, which is unlikely, and that it can’t be replaced. Really, there is no use for petroleum that can’t be replaced. Most of the replacements will be cheaper (e.g., EVs, both light and comercial/industrial), a few will be more expensive (aviation and smelting, probably) and the replacements overall will be cheaper than oil.
Nick
Oil is not used to manufacture renewables, or very little. It is coal that powers the electricity plants in China, Indonesia and India.
China consumes 4,800 million tonnes of coal and is at geological peak of production. The surface mines are close to depleting and they are having to dig into deeper and more expensive sources.
Any idea how many square meters of solar panel China would need to make up for a fall in production of just 100 million tonnes of coal. Remember coal can be stored for months next to a power plant and produce electricity at 8am or 5pm in winter.
Horrendous temperatures are causing India and China to use more coal to keep cool.
https://www.bbc.co.uk/news/articles/cw555ny3q9xo
Indian government has stated it intends to be consuming 400 million tonnes more coal by 2030,.
Any idea how many square meters of solar panel China would need to make up for a fall in production of just 100 million tonnes of coal.
If you know you could tell us. I guess you don’t.
Never mind, I’ll give it a whack. It’s not clear what timespan you’re talking about, so let’s say a year.
One GWh is 123 tons of coal, according to this:
https://www.convertunits.com/from/tonne of coal equivalent/to/gigawatt hour
Let’s say 100, it’s easier to calculate. 100 m tons would be a million GWh or a thousand TWh.
Here is an estimate from IRENA on how much land would be needed in Tanzania: 123 TWh per square kilometer.
https://www.irena.org/-/media/Files/IRENA/Agency/Events/2014/Jul/15/9_Solar_power_spatial_planning_techniques_Arusha_Tanzania.pdf
(See page 38)
We can reduce that as well to 100 to make the calculations easier and to compensate for latitude. They reckon with 18% capacity factor.
1000 square kilometers would be needed, an area roughly 31 km on a side. The Gobi Desert, which is on the border between (Chinese controlled) inner Mongolia and Mongolia proper, is about 1300 square km. You’d need to cover about 2.5% of it with solar panels to generate as much electricity as burning 100 million tons of coal.
Feel free to check my math.
In not very sunny Germany where a lot of solar is on rooftops, solar generated about 70 TWh in 2024. That would replace 7 million tons of coal by our lowball estimate.
Actually, slightly more than half of China’s solar installations are rooftop: industrial, commercial and residential construction has to include PV.
So that half doesn’t require any land at all.
Alim
Good guess.
China produced 9% of its electricity from solar last year.
https://climateenergyfinance.org/wp-content/uploads/2025/02/MONTHLY-CHINA-ENERGY-UPDATE-Feb-2025.pdf
No matter where in the world wind and solar fluctuate to the same degree. Wind can vary from nearly 50% to 5% and solar from 100% to 0% installed capacity.
Europe has about the same % of wind and solar output as China and is already having real problems balancing load.
As China’s coal production falls and water availability reduces, wind and solar will not be able to maintain a stable grid. Regular shutdowns of factories on a rolling basis will happen. The debts held by companies and regions will default and you will see China falling in on itself.
Germany which can produce more electricity from wind and solar in the right conditions, they regularly produce less than 10% of it’s needs.
all the renewable electricity, including hydro are not reliable unless you put on lots of battery, or charge-regenerative processes, and ultra-high voltage grid. China happens to be leading in these too.
LoL,
“Record high for renewable energy: Germany’s electricity supply will remain very stable in 2023. In 2023, the average power interruption time per customer was 13.7 minutes. Power supply in Germany remains one of the most reliable in the world. Feed-in from renewable energies is higher than ever before – successful intervention by grid operators to ensure grid stability.”
https://www.vde.com/en/press/press-releases/vde-fnn-fault-and-availability-2023-statistics#:~:text=In%202023%2C%20the%20average%20power,operators%20to%20ensure%20grid%20stability.
Wind and solar behave a little differently from FF, and the grid need adjustments in engineering and control, but it’s pretty straightforward.
” Internationally, Germany has one of the most stable power supplies.”
Some details:
“Necessary regulatory and technical precautions have been taken in Germany to prevent blackouts or power cuts resulting from grid overloads when there are high levels of sunshine and therefore solar PV output and low levels of power demand, the German Solar Industry Association (BSW-Solar) has said. Reforms to the Energy Industry Act (EnWG) that passed through parliament at the end of January had brought regulations that keep the risk down, the association said. The integration of renewable energies into the grid has been optimised and distribution grid operators will be obliged to regularly check the controllability of photovoltaic systems in the future, among other interventions, said BSW Solar.
The act builds on the System Stability Ordinance from 2012, which mandated that photovoltaic systems are not turned off when the frequency of the grid is exceeded. Instead, “the output is continuously throttled by the inverters, the control instruments of a solar system,” said Professor Bernd Engel, grid integration expert at the Technical University Braunschweig. “The higher the frequency rises, the more the inverter reduces its feed-in power.”
Rather than switching off strictly at 50.2 Hertz, photovoltaic systems now switch off in stages at different frequencies. Since 2018, this system-friendly behaviour has been mandatory across Europe for photovoltaic inverters. There have already been cases where progressive power reduction by inverters has worked well and led to a stabilised grid frequency.”
https://www.cleanenergywire.org/news/solar-power-poses-no-risk-german-grid-stability-even-peak-feed-times-industry
After 20 years the solar panels are worn out and go to landfill. Repeat every 20 years until the end of time. If people last 80 years on average and thus consume four generations of solar panels, and with average annual power consumption of 13,000 kWh, what weight of solar panels will someone send to landfill in his lifetime?
I have done the sums. For someone in the northeast US with 4.5 hours of sunshine per day it will be 2.3 tonnes of solar panels going to landfill over their lifetime. It will engineered landfill because of the cadmium of up to 10 grams per square metre.
David,
“The estimated operational lifespan of a PV module is about 30-35 years, although some may produce power much longer.”
PV can be recycled when desired or necessary, though landfill is still cheaper. Which, sadly, is the same story for a lot of things, like computers and TVs, which are sold in pretty high volumes and have much shorter lives.
https://www.energy.gov/eere/solar/end-life-management-solar-photovoltaics
Coal produces enormous amounts of somewhat toxic waste, in holding ponds of various sorts. Oil and gas leave wells that must be capped – somewhere in the range of 500,000 or more just in the US – who will pay to cap them?
FF is functionally obsolete (expensive, unreliable and polluting) but is still around, like landlines and CDs, and like them it will be around for awhile. But its still obsolete.
FF was a great thing up to about WWII, but after that point we went overboard. The US should never have allowed itself to become dependent on oil imports. The UK should never have allowed itself to become dependent on “Persian” oil to power the British navy. Around 1980 we could have moved aggressively to alternatives, but the oil industry managed to stave off the inevitable for 40 years.
Tesla started EVs, and China has picked up the mantle and is going to force the issue. The US and Europe can allow their car industries to become isolated and backwards, protected from competition with tariffs, but eventually they will fail, and fail far more thoroughly than if they faced the challenge directly. I feel sad for the US car industry, on it’s current path.
Yeah and diesel is used to get the coal out of the ground. Fine use natural gas or the coal itself to get more coal out of the ground. Better yet use solar and wind to get more coal out of the ground.
Just so you can have solar panels that replace coal. Which will all need to be replaced 20-30 years max. When your coal production and diesel imports are gone.
Because of the enhanced oil recovery techniques used in the supergiant oil fields in Saudi Arabia and Russia to arrest natural decline there will be a day where that decline accelerates and the two biggest oil exporters disappear from the global market in a short period of time.
So are we sure they have the oil reserves they say they do? Because if those reserves are actually overstated by half this downturn in production is a lot closer than any of us are thinking.
Considering that KSAs production is based on reserves and reserves are based on price I’d say 50% overstated would be a conservative estimate. The same holds for the Permian basin. I find it annoying that people use Hubbert’s linearization on the backend decline in production. First of all it was an observation based on production techniques of the time in a world that had no structural deficiencies in production of oil.
Today is not the same today is extremely different. EOR creates a much steeper decline and the profit margins are already too thin for both production and refining. 20% of global refining is set to close in the next 5 years. Government might try to force oil companies into continuing production but how has it worked out in California refineries recently ?
Right now we have a shortage of dollars in the Eurodollar markets. Why? Because banks aren’t lending. Why? Because in China 35% of loans are nonperforming. Better believe it’s not an isolated issue it’s a global problem. Deflation is already happening in Real Estate there as well as here. Equities are collapsing oil prices are falling bond yields are rising because of panic selling not inflation fears.
We were headed there in 2019 remember the repo troubles? COVD bought some time but that’s all it’s a structural problem based on a per capita decline in net energy. Everyone on MSM doesn’t have their head in the sand but do have their heads in the silicon. Solar isn’t going to save the neither will wind or AI but it very well might hasten the demise.
solar panels that replace coal. Which will all need to be replaced 20-30 years max. When your coal production and diesel imports are gone.
How odd: the way FF defenders talk, you’d think that FF production equipment just lasted forever, and never needed to be replaced or maintained…
it’s a structural problem based on a per capita decline in net energy
The way FF apologists talk, you’d think that FF was magic, rather than just a way to provide services, services that can be provided in a variety of ways
You’d think that a single passenger SUV at 15MPG commuting to work somehow added more to the economy than a Prius with four people, at 220 passenger miles per gallon. Or, of course, an EV at zero gallons per mile.
Which is another way of saying that a decline of FF per capita is a good thing. A feature, not a bug.
And if your economic analysis is based on FF being magically necessary, then your analysis is completely unrealistic.
The price of coal in China is falling. China’s coal imports are falling. Not because coal consumption is being replaced by renewable energy sources.
Chinese manufacturing is being decimated by lack of new orders.
This started well before tariffs came into play.
US inventory is at record highs. We sitting on a bunch of unsold inventory.
We ordered even more in anticipation of the tariffs. There will be a huge lack of demand. Lack of new orders moving forward. Until this inventory gets sold down.
Meanwhile US consumers have a record amount of debt they are dealing with. Not really in position to increase personal consumption.
David Archibald:
After 20 years the solar panels are worn out and go to landfill
Not in Europe. Throwing PV panels into landfills is not allowed under the EU landfill directive.
Landfills should be banned everywhere, they are a primitive idea.
To me, landfills may end up being a good thing eventually. A concentrated selection of a variety of molecules waiting to be mined, separated and reused with future technology.
Probably already happening to a minor degree.
Ovi,
Couid you check your spam folder? I meant to leave one comment as a reply to your comment.
Nick, it was in the spam folder. I have no idea how it got there. Anyway, I have approved it and it is now posted.
Thanks, Ron.
I tried some variations on the comment to test the spam algorithm – apparently it objected to the inclusion of the two individuals mentioned in the comment….!
And, I made the mistake of trying to edit the comment! (I had “their” instead of “they’re”.)
And it’s back in spam…
Nick G
Is this the comment you are trying to post. I have copied it from the SPAM folder
I’d say the bigger problem will be for exporters: what will they do when their customers leave? China is moving fast to reduce oil consumption, Europe is close behind. The US will get serious about reducing oil consumption when it is forced to, and then it will be able to move very fast.
Developing countries are waking up: Asia, Africa. The global transition is being held back by political maneuvers by oil exporters and oil defenders like Charles Koch and Rupert Murdoch, but they are gradually losing the fight.
Russia, KSA and the ME will be in a world of hurt. Canada and the US will be fine…
Yes, that’s it. In fact, it looks like Ron helped restore it too.
Thanks to both of you.
China raised tariffs on U.S. goods to 125% in response to U.S. tariff hikes.
This move has caused oil prices to drop and reignited fears of an economic downturn.
Despite a 90-day tariff pause on some countries, the U.S.-China trade war continues to create market uncertainty.
Full article at link below
https://oilprice.com/Energy/Energy-General/Oil-Prices-Drop-as-China-Retaliates-With-125-Tariff-on-US-Goods.html
WTI Futures price at about $60/bo currently.
here is a chatbot translation from a Chinese comment on Tariff turmoil,
At the same time, using China’s countermeasures and its refusal to revoke retaliatory tariffs as an especially shameless excuse, they raised tariffs on Chinese goods from 54% all the way to 105%, then increased them further the next day to 125% and 145%!
With this single move, the world war was pulled back into a U.S.-China battle.
Tariffs that were originally at 30-40%, even 40-50%, were slashed to just 10%. The stock market, which had previously plummeted, saw this change as a major positive and surged right back up. Meanwhile, the countries subjected to the 10% tariffs were all too pleased—politicians and netizens alike were overjoyed, feeling like they had scored an incredible bargain.
And just like that, amid chants of “Long live President Trump,” the 10% tariff was happily accepted by 75 countries. This single measure alone brought in over $300 billion annually, neatly covering the U.S.-China trade deficit gap.
Now, let’s think about it in reverse—what if Trump had flipped the process and started by announcing a 10% tariff on all countries from the beginning? How would they have reacted?
Everyone would’ve been scowling, cursing Trump as an old bastard for taxing them and squeezing them dry. It wouldn’t have been like it is now, where everyone is all smiles, getting screwed by Trump yet celebrating like it’s gift from Santa Donald!
In the process of 2 days, Santa Donald gang made 30 billion dollars while US made $300billion. Giving good feelings to Japan, Eu and China that their treasury bill power is real.
At the same time, giving Puting zero Tariff gift , yet drain the real oil cash from Russia by beating down the oil price
KSA makes New discoveries.
https://www.saudigulfprojects.com/2025/04/saudi-arabia-announces-new-oil-and-gas-discoveries/
Lightsout,
LOL… according to the data those 14 new Saudi discoveries will net a MASSIVE 8,000 bd of oil and 80 Mcf/d of natgas.
This certainly isn’t going to move the needle that much.
steve
For the recent (April 2025) STEO, WTI oil price is expected to fall below $62/bo after August 2025, so it may be that the EIA thinks this is a critical price level below which the tight oil completion rate will fall significantly. Note that from October to December 2026 they are forecasting WTI at $56/bo for each of those 3 months. Also the April 2025 forecast for WTI is $63/bo with $62/bo for WTI from May 2025 to August 2025.
There is also a likely delay between the sharp drop in prices since January and changes in rig count and completion rate, probably around 6 to 8 months.
Dennis
Note in the US chart above oil production starts to fall after August 2025 in the onshore L48.
Ovi,
Yes, my guess is that the EIA’s model might be sensitive to oil prices less than $62/bo. I did notice that USL48 onshore C plus C starts to decrease after August 2025, which I believe you pointed out in your post. This is what made me look at the oil price forecast closely.
U.S. energy secretary says shale industry will ‘survive and thrive’ despite plunging crude prices
ABU DHABI, United Arab Emirates — U.S. Energy Secretary Chris Wright is not worried about falling oil prices and their impact on America’s shale oil industry, and is stressing that the coming years should be a time of energy abundance for the world’s largest economy.
“The U.S. shale industry is going to is going to survive and thrive,” Wright said in an interview with CNBC’s Dan Murphy in the United Arab Emirates’ capital Abu Dhabi. “But of course,” he added, “investment decisions are going to be tailored if prices stay long for stay this low for a long period of time. But I’m quite bullish on the U.S. industry.”
https://www.msn.com/en-ph/money/markets/u-s-energy-secretary-says-shale-industry-will-survive-and-thrive-despite-plunging-crude-prices/ar-AA1CJXuN?ocid=finance-verthp-feeds
Ovi,
The Trump Secretaries are not truthful, Wright is wrong (or perhaps just a liar.)
There are a lot of Baghdad Bob’s.
lets not degrade liars by comparing them to Trump Secretaries
BOEM just released the following regarding 1.3 BBOE of reserves adds:
https://www.doi.gov/pressreleases/interior-announces-major-increase-gulf-america-oil-and-gas-reserves
In the Trump era, an announcement like this is accompanied by much bluster and happy talk, but it’s actually just the competent folks at BOEM doing their jobs.
About 1.3 BBOE of reserves were added between the end of 2019 and the end of 2023. Most of it is oil. About 600 MMBOE (520 MMBO, 490 bcf ) is from new fields, 3.8 BBOE (3.1 BBO, 3.7 tcf) is from reservoir performance, and then backing out 3.1 BBOE (2.5 BBO, 3.1 TCF) of production – that gets you to the 1.3 BBOE reserve add (1.1 BBO, 1 tcf)
So, BOEM’s estimate for remaining reserves (these are what I would call proven reserves) is 7 BBOE ( 5.8 BBO, 7 tcf). The GOA should ultimately produce more than this as future discoveries and reservoir performance reserves adds are made.
Any idea what the range of breakeven production costs are for the Gulf fields are? Thank you.
(can we call them fields when they are under water?)
Hickory,
I’ve seen ranges from about $30 (for low risk infield drilling) to $60 per barrel (for new green field projects or small tie-backs).
I’ve always referred to them as fields even though they are offshore, and I’ve always seen others refer to them as fields as well.
Is that why they are also more often referred to in the generic sense as “plays”? I’ve never understood the origin of that jargon. ChatGPT says “The word “play” in this context is believed to come from the idea of “playing one’s hand” in a figurative game — much like in cards or gambling. It captures the speculative nature of oil exploration:”
The word “play” in the oil industry is used pretty loosely.
One can say they are drilling a well that is in the “subsalt” play – while the reservoir they are pursuing may be either Miocene or Wilcox. Or, more generically, one may say they are pursuing an “offstructure” play, if they are looking at a prospect that is downdip of a big field or structure.
Sometimes the word “play” and “trend” can be used interchangeably. Someone may say they are pursuing a prospect in the Wilcox play, but that also means they are pursuing a prospect in the Wilcox trend.
Bob
Any idea on whether these additional GOM reserves will results in daily production exceeding 2,000 kb/d.
Ovi,
I used to think GOA production would get over 2 mm bopd on a sustained basis for a year or two, but I’m less sure of that now. There may be a month or two that does exceed 2 mmbopd, but I don’t think any annual production will – at least that is my most likely view right now.
Bob,
A little confusion about these quotes from the DOI BOEM link you provided,
“Gulf of America Outer Continental Shelf” and “7BBOE” , “After subtracting production of 3.09 billion barrels of oil equivalent since 2020–2021, the net increase reflects continued opportunity and momentum in offshore development. “,
— assuming the “Outer Continental Shelf” means the flipped Wilcox trend under salt dome?
Because the deepwater oil production since 1990 has already reached well over 10BBOE already according to EIA link here,
https://www.eia.gov/outlooks/steo/report/perspectives/2024/09-gulfofmexico/article.php
The production for ALL deep water since 2020-2021, in 5 years is about 3.09 BBOE.
Sheng Wu,
The 7 BBOE is BOEM’s estimate of remaining P1 (or high confidence) reserves in the GOA OCS. They don’t break this out into trends, but I would say over 90% of these remaining reserves are in deepwater, and about 30% of the total is from the WIlcox.
The Outer Continental Shelf (OCS) includes both shallow water and deepwater. The Wilcox is a subset of deepwater. Current GOA production is over 90% deepwater, and about 20% is from the Wilcox.
There’s actually a typo in the BOEM article – total production of 3.09 BBOE is from 2020-2023, not 2020-2021.
As you say, total cumulative production from deepwater is over 10 BBOE, but the article doesn’t address that.
Bob Meltz,
Thanks for the explanation, it seems that the remaining P1 at 7BBOE is obviously less than 50% of the total reserve, which includes ~13BBOE produced, at around 20 BBOE URR. Yet, the production is still going up. Guess it is due to improved recovery (3.8 BBOE which is significant) which is due to the low GOR black oil nature, and also new discoveries?
Do you know if these low GOR black oil from deep water have higher than 10% wax? Chatbot suggests
“Wilcox Trend in the Gulf of Mexico is known for having a relatively high wax content compared to other North American crudes, with some examples reporting up to 32.5% wax content. This high wax content, which is composed of paraffin waxes with carbon chains ranging from C18 to C36, leads to viscous and semi-solid behavior at lower temperatures, affecting refining”
so, it is not rare for finding lacustrine sourced like Uinta crude.
Total cumulative production from the OCS through 2023 is 59 BBOE (25 BBO and 194 TCF). The 7 BBOE (5.8 BBO and 7 tcf) remaining proven reserves suggests an ultimate recovery of at least 66 MMBOE (32 BBO and 201 TCF). The URR should be higher because there will be reserve adds and discoveries in the future.
I don’t know much about the wax content of the low GOR black oils you reference, but, I actually don’t think it is too big of a deal, so I would think that it is less than 10%. I worked one of those low GOR fields, and wax wasn’t a problem.
Bob,
Thanks for the updates. Much appreciated by all of us that know far less than you.
D C,
If we apply the “<50% URR produced === plateau" peak model to deep water GOA oil production, there is already over 10G BO produced and a plateau at ~2M BOPD reached by now. Then there should be over 10G BO URR left in deep water GOA?
Sheng wu,
If we assume 50% of URR was reached in 2023, this would imply a URR of about 50 Gb.
Bob’s last GOM update is at link below
https://peakoilbarrel.com/gulf-of-mexico-update/
not clear what his current view is, but he had scenarios ranging from 31 to 42 Gb, with his midcase (I assume this would be his best guess in 2022) at a URR for C plus C of 36 Gb. This implies about 11 Gb remaining after 2023. Note that this includes both shelf and deepwater oil output.
Sheng wu,
Note that in Bob’s post he said that as of end of 2021cumulative production was 23.4 Gb with about 10 Gb from deepwater. I assume most of the future production will be from deepwater GOM wells, Bob can correct me if this is wrong.
If correct this implies about 23 Gb of deepwater and using the 50% rule implies a peak at about 11.5 Gb of GOM deepwater production, which might have been about 2023 (possibly 2022).
In 2022 Bob said, Even a 2025 update would be interesting.
I agree.
Bob’s 2022 scenarios with caption below
Figure 8 – GOM oil production from 1980 to 2021 and my projections out to 2080 in mmbopd. Included is my edited EIA estimate, which takes their projection to 2050, and then reduces it by 100 kbopd per year til 2064.
Click on image for larger view.
Dennis,
You’re spot on with what I said in 2022. Here are some highlights from a GOA update I did as part of a recent Wilcox talk I gave to a couple local geology societies.
Total GOA oil production through 2024 = 25.4 BBO
Deepwater total – 12.0 BBO
Shelf total – 13.4 BBO
Mid case EUR = 37 BBO
Deepwater midcase EUR = 23 Bbo
Shelf midcase EUR = 14 BBO
Remaining to produce = 11-12 BBO
That wil come from these trends:
Shelf = .5 – 1 BBO
Deepwater = ~ 11 BBO
This will come from these deepwater trends:
Norphlet – 1 BBO
Wilcox – 3-4 BBO
Miocene (subsalt) – 5-6 BBO
Plio-Pleistocene-Miocene (flextrend, non-subsalt) – ~1 BBo
Bob Meltz,
Thanks for the update. Is your current mid-case scenario (I am assuming this is your best guess) roughly a plateau around current output for maybe 2025-2030?
Yes – average between 1.8 and 1.9 mmbo/day til 2030 or so, and then starts declining to about 1.5 mm by 2035 and 1 mm by 2040.
D C,
This GOA deep water is a complimentary case of URR estimate going short of actual production.
The Permian IP is high, and applying conventional WTI production pattern/decline will end up with higher URR numbers, and over drilling caused further deterioration of URR.
The GOA deep water low GOR oils’ decline is slower and EOR more efficient, resulting in slower decline and better recovery, almost 50% more URR than initially projected. The latest BOEM/DOI estimate is 7GB left, but actually there is more than 10GB left in deep water GOA as your “50%=plateau” model and Bob’s estimate all agree.
Sheng wu,
The BOEM 7 Gb estimate is a reserve estimate, there is a difference between reserves and resources as I am sure you are aware.
In 2021 the BOEM undiscovered mean TRR for GOM oil was 29.6 Gb, for ERR at $60/b they estimate 19 Gb.
https://www.boem.gov/sites/default/files/documents/oil-gas-energy/resource-evaluation/2021 Fact Sheet_0.pdf
To this we would add reserves and cumulative production. Reserves at the end of 2021 were 4.5 Gb, cumulative production about 23.4 Gb for a total of 57.5 Gb for potential TRR. For ERR at $60/b BOEM has 47.5 Gb. Bob’s estimate takes account of what is likely to be produced (ERR) and is different from the BOEM assessment in 2021. Bob has ERR at about 64% of mean TRR for GOM. This is far higher than my guess for Permian ERR of 39 Gb of 75 Gb (mean TRR) which is about 52% of mean TRR.
A knowledgeable expert expects Permian URR will be lower at about 30 Gb (or 40% of USGS mean TRR). I disagree with the 30 Gb estimate, but I have been wrong many times in the past and will be wrong in the future as well. Though if oil prices should fall to under $60/b and remain that low long term, the 30 Gb estimate may be spot on. Perhaps 30 to 40 Gb is the right range for Permian URR if oil prices stay where they are currently (and should they remain in the $60 to $70/b range going forward.)
I think Bob’s range of estimates sounds reasonable and would note that he is an expert, I am not.
D C,
For the GOA URR/TRR, I realized that I confused the 7 B BOE reserve with uTRR, and that’s why I was shocked, note that the 7B BOE reserve only has 5.77B BO.
Also found that why Bob has much higher URR/TRR using BOEM 2021 numbers you discussed, i.e. 37BBO (Bob EUR or URR) / 57.5 (BOEM 2021 Risk mean undiscovered TRR Reserve produced ) =64%. The cause is that the shallow water part is over 90% produced, so this part the URR/TRR is over 90%.
If you separate out the Deep and Shallow, and assume the Deep has the following in BOEM 2021 report (Produced 10BBO, reserve 4.3 BBO, and uTRR 28 BBO, total TRR at 42.3 BBO), and use Bob 23 BBO EUR for Deep water URR, then URR/TRR Deep water is 54%, very close to your 52% for Permian URR (D C 39 BBO)/TRR (75 BBO by EIA).
But EIA Permian TRR estimate was a little too earlier and believe the higher IP and did not have the fast decline, and did not take into account of over drilling caused degradation, so URR could get closer to 30 BBO as Mike suggested.
Coming back to Permian and the knowledgeable expert who recently suggested about 30 Gb for Permian (he did not claim this was a best guess, it may have been a high or low case he did not say.) Below I tried to match the 30 Gb case, though it is a bit higher at 31 Gb. This is compared with my recent best guess of 38.6 Gb (this scenario was created before the recent tariff turmoil and the OPEC announcement of accelerated increases starting in May.) To me based on current oil prices and assumed future low economic growth due to turmoil in the World economy, Permian output will be between these two scenarios. Maybe about 35 Gb for Permian tight oil URR, but maybe it will be higher or lower, impossible to foresee.
I have about 53 thousand Permian horizontal tight oil wells completed as of Jan 31, 2025, if no wells were completed after Jan 2025, the URR would be about 21 Gb for Permian tight oil, cumulative production to the end of Jan, 2025 was 14.5 Gb.
Comment with 30 Gb Permian estimate at link below, comment on April 7, it says maybe 30 Gb, so perhaps no more than 30 Gb is implied (not clear in my view.)
https://www.oilystuff.com/forumstuff/forum-stuff/bye-bye-saudi-america
Also noticed a 60k estimate for drilled wells that includes both DUCs and dry holes. I don’t have good DUC data after December 2023. At that time Novilabs estimated about 3500 DUCs, currently the EIA estimates about 900 DUCs for Jan 2025, adding these to my completed well estimate would bring the drilled well count to 54.8k at the end of Jan 2025. If Novilabs 3500 DUC estimate has been sustained (and is correct) for Jan 2025, this would imply about 57.4k wells have been drilled in the Permian and for the lower scenario above (31 Gb) only another 21.6k wells would be drilled in the future. In the past 12 months about 5.8k wells were completed, so less than 4 years of drilling at the completion rate of the past 12 months.
For the actual scenario the drilling and completion rate decreases over time so the last well is completed in September 2031 for the URR=31 Gb scenario presented earlier. Total wells completed are about 80 thousand, with about 54k wells completed by the end of Jan 2025.
D C,
80K wells at URR of 31Gb translates into EUR per well at ~390K BO?
If you look at NOVI, this might be a little too high, more likely ~350K BO, and declining with ever longer laterals, with the core drilling out and infills and 2nd tier much worse.
Sheng Wu,
Difficult to know, my expectation is that most of these will be tier one wells, using Novilabs data I get an average EUR for 2022 wells of 432 kbo with assumed end of life at 18 bopd (158 months after first flow). I assume in my scenario that new well EUR starts to decrease in Jan 2026 at 8% per year when 476 wells per month are completed, by Sept 2031 (last month wells are completed for scenario) new well EUR has fallen to 319 kbo.
D C,
I agree most of the parent tier one wells will have EUR around 400K. Just many overdrilling in Tier one obviously degraded EUR with faster declines. Like Scott predicted, drilled 30~50% more, and produced 30~50% less. The faster declining caused zero improvements in production tail (over 2 years) after 2015 is so obvious, when compared to Marcellus, and even Haynesville, where the improvements in tails are quite obvious.
For 31 Gbo Permian URR scenario here are the new well EUR guesses for Feb 2025 to Sept 2031.
Rig Report for the Week Ending April 11
This week is a double whammy for Rigs and Fracs
Let’s watch what happens over the next few weeks with WTI at $62/b.
– US Hz oil rigs decreased by 9 to 441.
– New Mexico rigs dropped 2 to 90 while Texas rigs dropped by 4 to 231. Texas Permian was down by 3 rigs to 185.
– In New Mexico, Eddy was unchanged at 45 while Lea dropped by 2 to 45.
– In Texas, Midland dropped 3 to 23 and Martin dropped 2 to 25. However Reeves added 3 to 25.
– Eagle Ford dropped 1 to 41.
– NG Hz rigs added 2 to 79.
Frac Spread Report for the Week Ending April 11
The frac spread count dropped by 10 to 195. It is also down 57 spreads from one year ago and down by 46 spreads since October 11.
This week’s question is “Is this the standard post March drop for frac spreads?” Since the drop is larger than normal, the drop could be related to the typical post March drop along with the lower price for WTI.
Might plunging crude prices tighten wet NG flows in the US, raising electrical prices?
Nat gas consumption by utilities seems not sustainable in many regions of the US.
Hmmm ….
Gas rigs actually up while oil rigs plunge.
The Haynesville are preparing for a surge of LNG export.
Sheng Wu,
The main question is will the increase from shale gas plays be enough to offset falling natural gas output from tight oil plays. Higher natural gas prices may reduce demand for natural gas used for electric power, the higher natural gas prices may also reduce profitability for LNG exporters.
Horizontal natural gas rig count was about 101 53 weeks ago, so down 20% in past year (currently at 79).
Many on this blog know the contents of a lecture by Seppo Korpela, and perhaps it has been discussed previously on this site, but I share this reference because I found it to be very compelling and others might also.
https://www.youtube.com/watch?v=XIEYgeSvcF0&t=5s
Looks like classic Peak Oil stuff. Nothing new, and badly out of date.
Unrealistic assumptions that oil and other FF will decline too fast to replace, and we’re all going back to subsistence farming.
Nick G
Once you start using childish remarks like “ fossil fuel apologists” you have lost your arguments and any respect you may have had.
Firstly coal, oil and gas are what has created everything that has made life good. Look at countries without these sources of energy. They lived in straw huts with no electricity and cook today on wood or dung stoves causing millions to die of lung disease.
Secondly I think solar and wind are great but having looked carefully at the variability of them I can’t see them reaching more than 40% of electricity demand. Your ill informed comment about Germany grid is typical of those who really do not understand the subject. European countries import and export to each other so need to be taken as a whole. Germany is spending billions upgrading its grid yet often exports electricity at a loss.
There is a reason why Germany and U.K. have the most expensive electricity in the world. THEY HAVE THE MOST WIND AND SOLAR AS PERCENTAGE.
Finally wind and solar will not stop climate change it is already too late. Secondary effects are already starting and they will not stop.
https://www.greenpeace.org/africa/en/blogs/49073/how-widespread-deforestation-in-africa-risks-our-climate-future/
Deforestation has it’s own secondary effects, the deforestation so far has already set in motion droughts which will further eccelerate tree deaths and droughts.
As I said before the world needs to spend about £2 trillion extra each year on clean water, paying people to plant trees and not destroy them. Farming practices that does not erode the soils but that obviously costs money.
https://earth.org/95-of-the-earths-soil-on-course-to-be-degraded-by-2050/
Plastics need to have a 100% tax to pay for collection preventing this.
https://www.iisd.org/articles/deep-dive/confronting-plastic-pollution-pandemic
Just convince Putin, Jinping, Iran and NATO to start disarming and there will be the trillions needed to stop the disaster that is already starting.
LOADSOFOIL says “Once you start using childish remarks like “ fossil fuel apologists” you have lost your arguments and any respect you may have had”. But the truth is that once LOADSOFOIL starts making childish remarks like “There is a reason why Germany and U.K. have the most expensive electricity in the world. THEY HAVE THE MOST WIND AND SOLAR AS PERCENTAGE.” He has lost his argument and any respect we may have had for him. I assume he has got that idea from the right wing comic books that pass as newspapers, the DailyTelegraph, Daily Mail, and Daily Express that are staffed by journalists with as little understanding of the science, technology and economics of Britain’s energy supply as do Donald Duck or that other Donald dominating the news currently.
It is certainly true that the UK – both Britain and Northern Ireland – have frustratingly and scandalously highly priced electricity, but the reason has almost nothing to do with the fact that something like 40% of our electric power comes from renewables. It is the wholesale costs of electricity – not green taxes – that are responsible for the high price of British electricity for British consumers. Electricity prices in the UK are high due to a complex interplay of factors, primarily the reliance on gas-fired power plants and a marginal pricing system, where the most expensive energy source determines the overall electricity price. This means that even with increasing renewable energy generation, gas prices, which have been volatile, significantly influence electricity costs. Additionally, taxes and levies on electricity contribute to the overall bill. This is explained in greater detail at
https://www.sustainabilitybynumbers.com/p/electricity-pricing
Nick or Mick
https://iea.org.uk/were-number-one-in-unaffordable-electricity/
As I said lost any respect
Meanwhile China and India are burning 5,000 million tonnes of dirty cheap coal ensuring global warming will kill us all
Global electricity prices
https://www.hostdime.com/blog/average-cost-of-electricity-per-country/
When a country burns vast amounts of coal such as china and India it can produce vast amounts of cheap electricity, in turn it can produce vast amounts of cheaper steel and copper and aluminium. Industry in other countries don’t stand a chance that is why Europe is putting tariffs on Chinese cars.
Tata steel said U.K. electricity prices make it impossible to compete.
We should all have put CO2 tariffs on China and India 30 years ago. Maybe we could have stopped the increasing droughts and floods.
https://www.bbc.co.uk/news/science-environment-58073295
Annual Energy Outlook 2025 is out today
https://www.eia.gov/outlooks/aeo/