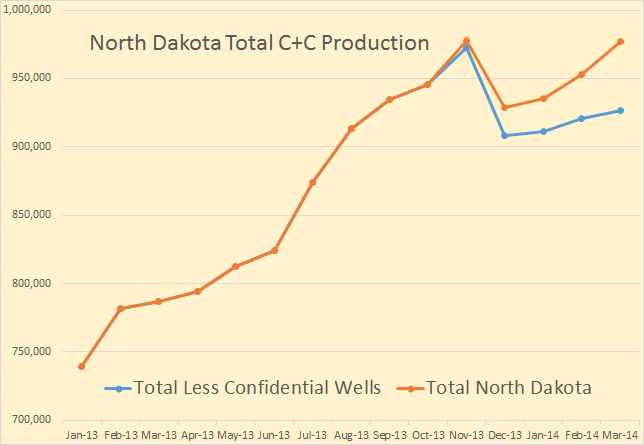
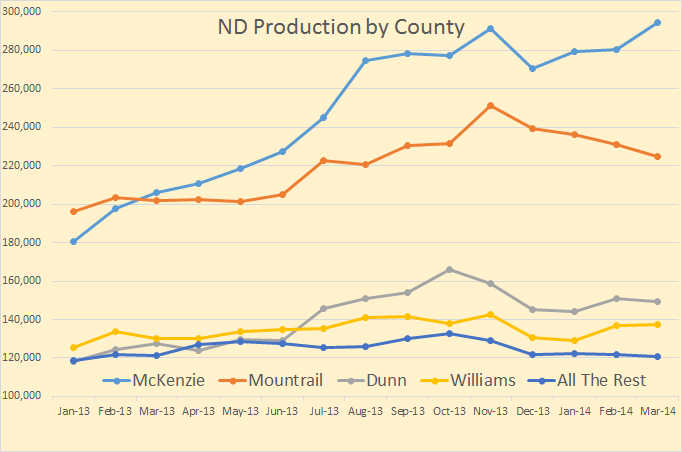
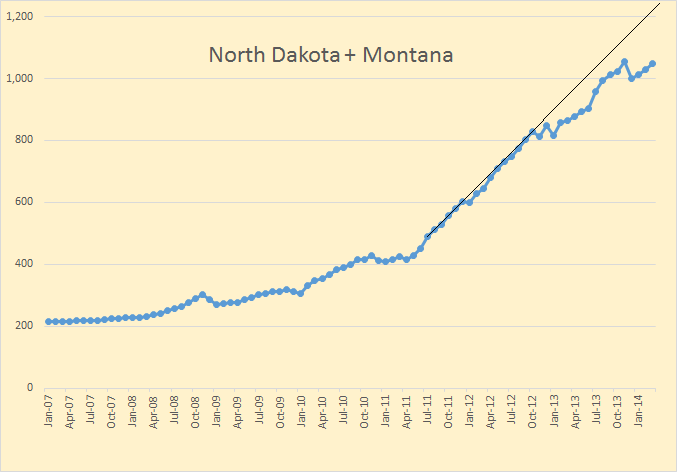
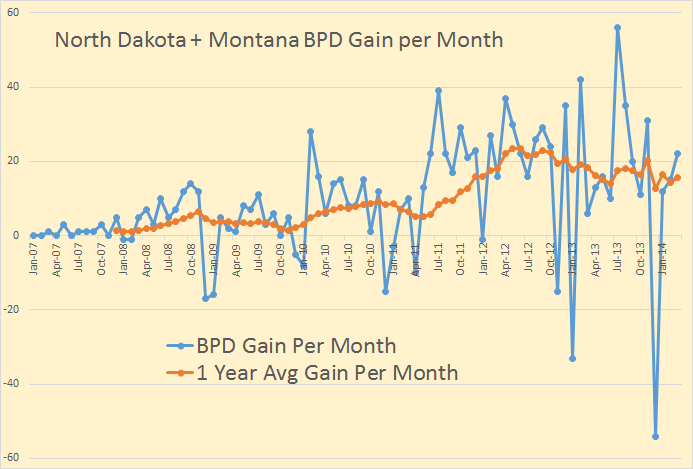
The EIA’s latest Drilling Productivity Report has been published. I found some strange things in the report. For the Bakken, their data does not jive with that posted by North Dakota. I have plotted the two together. The North Dakota includes all North Dakota but not the Montana part of the Bakken. The EIA data includes all the Bakken but not the non-Bakken part of North Dakota. Almost a wash but not quite. Montana produces slightly more than the non-Bakken part of North Dakota, but not very much. Anyway…
I thought for sure that the EIA would hear that Bakken Production was down about 50,000 barrels per day in December. But Nooooo… they have the Bakken up by over 20,000 barrels per day in December, a difference of 70,000 bp/d. But up until the last two or three months they follow the North Dakota data pretty close so we can hope they update their data in a few months.
However all LTO production was revised upward in this last report. The chart below is the barrels per day that all tight oil was revised upward.
Doesn’t the strange shape of that chart raise suspicions? December production was revised upward by 34,672 bp/d when it actually should have been revised downward by perhaps twice that amount. January production was revised upward by 35,243 barrels per day. I doubt very much that this was the actual case.