World Energy 2014-2050 (Part 1)

This is a guest post by Political Economist

World Energy 2014-2050: An Informal Annual Report

 “Political Economist” June 2014

The purpose of this informal report is to provide an analytical framework to track the development of world energy supply and demand as well as their impacts on the global economy. The report projects world supply of oil, natural gas, coal, nuclear, hydro, wind, solar, biofuels, and other renewable energies from 2014 to 2050.  It also projects the overall world energy consumption, gross world economic product, energy efficiency, and carbon dioxide emissions from 2014 to 2050.

The basic analytical tool is Hubbert Linearization, first proposed by American geologist M. King Hubbert.  Despite its limitations, Hubbert Linearization provides a useful tool helping to indicate the likely level of ultimately recoverable resources under the existing trends of technology, economics, and geopolitics.  Other statistical methods and some official projections will also be used where they are relevant.

Oil

According to BP Statistical Review of World Energy 2014, world oil consumption (including crude oil, natural gas liquids, coal-to-liquids, gas-to-liquids, and biofuels) reached 4,185 million metric tons (91.3 million barrels per day) in 2013, 1.4 percent higher than world oil consumption in 2012.  In 2013, oil consumption accounted for 32.9 percent of the world primary energy consumption.

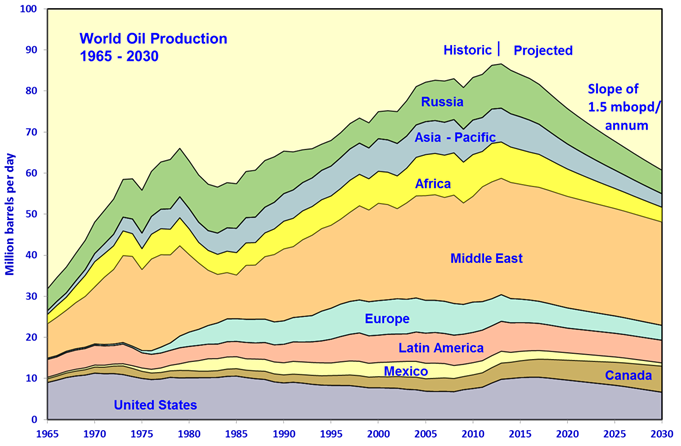
World oil production (including crude oil and natural gas liquids) reached 4,133 million metric tons (86.8 million barrels per day) in 2013, 0.6 percent higher than world oil production in 2012.  Figure 1 shows oil production by the world’s five largest oil producers from 1965 to 2013.

 photo Oil062014-1_zpsc4e13cc7.jpgAs of 2013, world “proved” oil reserves stood at 238 billion metric tons, 1.0 percent higher than the “proved” oil reserves in 2012.

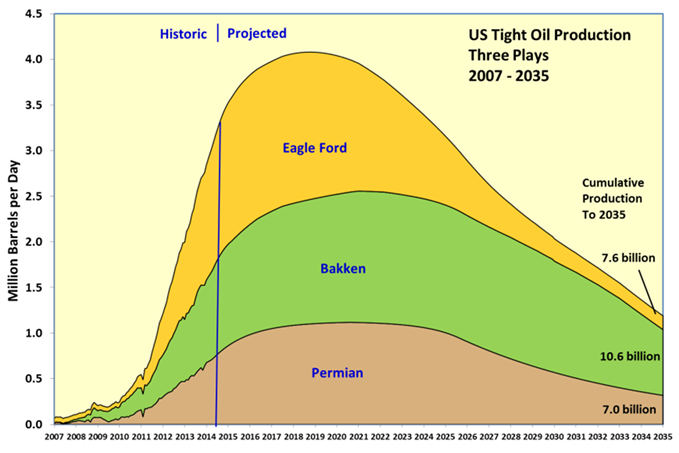
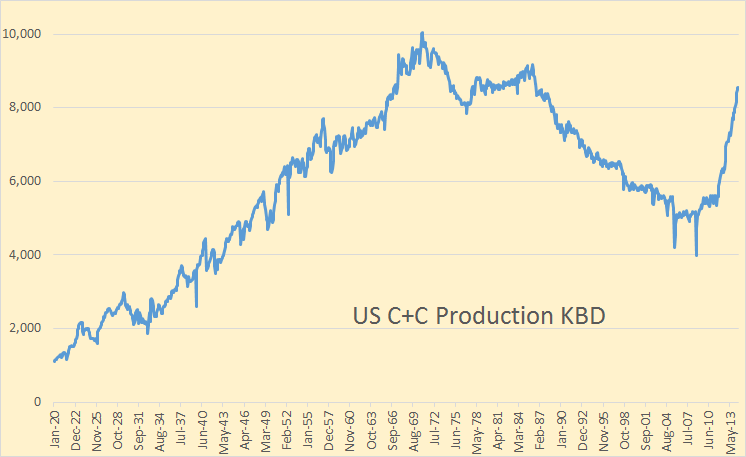
In recent years, the US oil production has surged due to the “shale oil” boom.  The US accounted for all of the growth of world oil production from 2008 to 2013.  Figure 2 shows the historical and projected US oil production from 1950 to 2050.  The projection is based on the reference case scenario for US oil production from 2011 to 2040 projected by the US Energy Information Administration (EIA), extended to 2050 based on the trend from 2031 to 2040.  The EIA reference case projects the US oil production to peak in 2019, with a production level of 543 million metric tons.

 photo Oil062014-2_zps187c496f.jpg
Read More

Texas RRC Report April Production Data

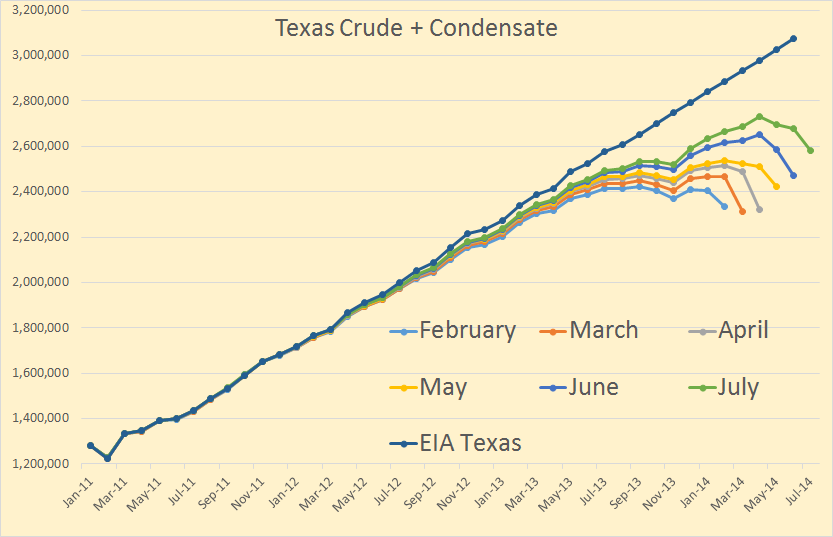
The Texas Rail Road Comission has released their latest report with oil, gas and condensate production for April. The RRC data is always incomplete however and takes many months for the all the data to trickle in. The below chart shows that problem.

Texas RRC-EIA

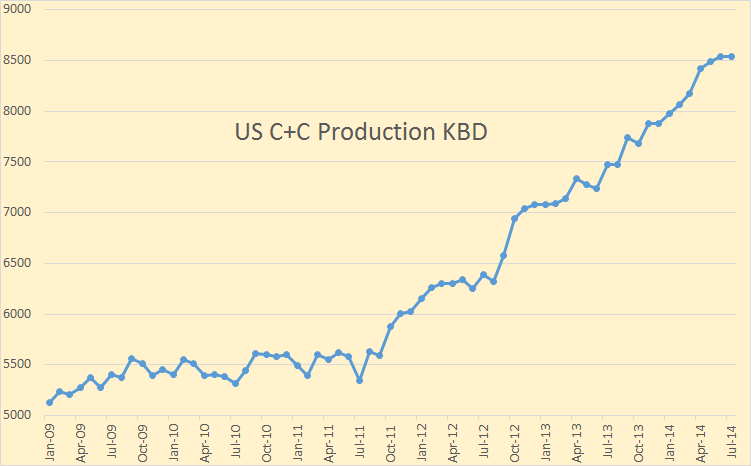
The data is barrels per data with the EIA data through March and RRC data through April. The EIA has Texas C+C data is highly linear for the 10 months June 2013 through March 2014, increasing at 48 kb/d for 4 months, 41 kb/d for one month then 49 kb/d for the last 5 months.

The EIA has Texas C+C increasing at an average of 48.6 bp/d each month for the last two years. I think that is a little high. I think the production has been increasing at close to 43 kb/d each month but with a recent slow down in that increase.

Texas C+C

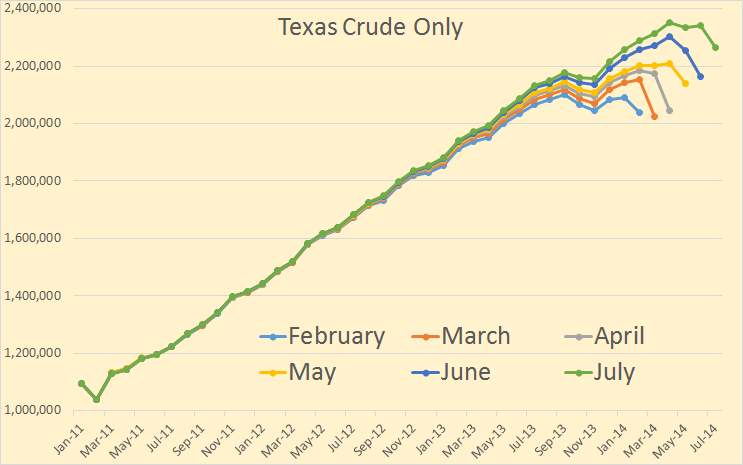
All Texas RRC June report data is through April. The RRC does not combine Crude with Condensate so I have to add the two. But here you can see the problem. Each month the reported data increases with the latest months showing the largest increase. However even if this is the case, the latest month should show an increase almost equal to the final total increase for that month. That was the case in the April Report, (January to February), but not the case for the last two reports.
Read More

BP Statistical Review of World Energy 2014

BP has released its Statistical Review of World Energy 2014. There are a lot of things in this report but I am only posting charts on liquid petroleum only. The BP report includes crude oil and NGLs. Their data does not include ethanol or any type of biofuels or process gain. The report actually has data from 1965 but I started all charts from 1990 in order to highlight more recent production. All data is in kb/d.

BP World

BP has World liquids output up 557 kb/d in 3013.

BP United States
Read More

OPEC Update and news from Iraq

The new OPEC Monthly Oil Market Report just came out with their Crude Only production numbers for May. All data in the OPEC charts are in thousands barrels per day.

OPEC 12

There was very little in production changes and no surprises in the May data. Total OPEC production was up 142,000 barrels per day and that was after the April numbers had been revised up by 29,000 bpd.

Iraq

Everyone is concerned about Iraq. Iraq’s April numbers were revised down by 22,000 bpd and May production was up 18,000 above that revised number. Iraqi production stood at 3,331,000 bpd in May but I expect that number will change in June and most definitely in July.
Read More