International Oil Rig Counts

All rig count data is provided by Baker Hughes. All monthly charts are oil rigs only. Gas rigs are not included in the count. The last data point for all monthly charts is April 2015.

When I talk about “peaks” in this post I am only speaking of the peak since 2011 and am not suggesting that there were not higher peaks in previous years.

International Oil Rig Count

The International Rig Count has fallen by 150 rigs, from 1,080 in July 2014 to 930 in April 2015. This count does not include the USA, Canada or any of the FSU countries.

Europe Oil Rig Count

The European Oil Rig Count dropped from 96 in October and November to 65 in April.

Read More

Reserve Growth in West Siberian Oil Fields

What is Reserve Growth?

BPIn general, a portion of a field’s probable and possible reserves tend to get converted into proved reserves over time as operating history reduces the uncertainty around remaining recoverable reserves: an aspect of the phenomenon referred to as ‘reserves growth’.

Wiki: Experience shows that initial estimates of the size of newly discovered oil fields are usually too low. As years pass, successive estimates of the ultimate recovery of fields tend to increase. The term reserve growth refers to the typical increases in estimated ultimate recovery that occur as oil fields are developed and produced.

Basically the U.S. Security and Exchange Commission have stringent reserve booking requirements for oil companies. As a result early booked reserves of any given field is very conservative. Also, any company would much rather have reserves too low and increase them later than have them too high and have to decrease them later.

But would this not mean that fields of national oil companies, and especially fields that were discovered and developed in the Former Soviet Union have different reserve growth rates than fields developed by publically traded oil firms. The answer is yes and the USGS admits that is exactly the case.

In this publication, Reserve Growth in Oil Fields of West Siberian Basin, Russia, the USGS tells us all we need to know about Reserve growth in West Siberia.

ABSTRACT

Although reserve (or field) growth has proven to be an important factor contributing to new reserves in mature petroleum basins, it is still a poorly understood phenomenon. Although several papers have been published on the reserve growth in the U.S. fields, only limited studies are available on other petroleum provinces. This study explores the reserve growth in the 42 largest West Siberian oil fields that contain about 55 percent of the basin’s total oil reserves.

The West Siberian oil fields show a 13-fold reserve growth 20 years after the discovery year and only about a 2-fold growth after the first production year. This difference in growth is attributed to extensive exploration and field delineation activities between discovery and the first production year. Because of uncertainty in the length of evaluation time and in reported reserves during this initial period, reserve growth based on the first production year is more reliable for model development. However, reserve growth models based both on discovery year and first production year show rapid growth in the first few years and slower growth in the following years. In contrast, the reserve growth patterns for the conterminous United States and offshore Gulf of Mexico show a steady reserve increase throughout the productive lives of the fields. The different reserve booking requirements and the lack of capital investment for improved reservoir management and production technologies in West Siberian fields relative to U.S. fields are the probable causes for the difference in the growth patterns.

RG 3

Four of the five largest fields in Russia are located here in West Siberia, Samotlor, Priob, Lyantor and Fedorov. 61% of Russian production currently comes from Western Siberia. Russia’s second largest field, Romashkino, discovered in 1948, is located in the Volga-Ural Basin and is also in serious decline.

Read More

Peak Russia + Peak USA means Peak World

Since around 2005 many countries have increased their oil production but more have decreased. But the combined production of the United States and Russia have kept the world on a slight uptrend since that time.

World since 2000

World oil production jumped in 2011, hardly moved at all in 2013 but it was up by more than  1.5 million barrels per day in 2014. And after such a huge gain everyone and their brother were singing “peak oil is dead’. But if you scroll down through the 37 major world oil producers it becomes obvious that a majority of nations have peaked and most of them are in steep decline.

The above chart is EIA data however the next four charts below are JODI data with the last data point February 2015. The data on all charts is thousand barrels per day.

Read More

Bakken, What Is The Data Telling Us?

North Dakota publishes, every month, a Monthly Statistical Update from which we can gather a wealth of data if we dig deep enough. They publish the number of spuds, that in new wells started, each month, along with the average number of rigs that month. From this we can glean the average number of days each rigs spends on each well.

Spuds per Rig

The last data point is March, 2015. Through 2011 a rig could drill about .75 wells per month, or about 40 days spud to spud. Today that figure is about 1.14 wells per month or about 26.3 days spud to spud.

Permits & Spuds

Again, the data is through March. We can see the falloff of spuds, rigs and permits in February and March. April and May should show a further decline in all three.

Read More

Eagle Ford, Permian Basin, and Bakken and Eagle Ford Scenarios

This is a guest post by Dennis Coyne

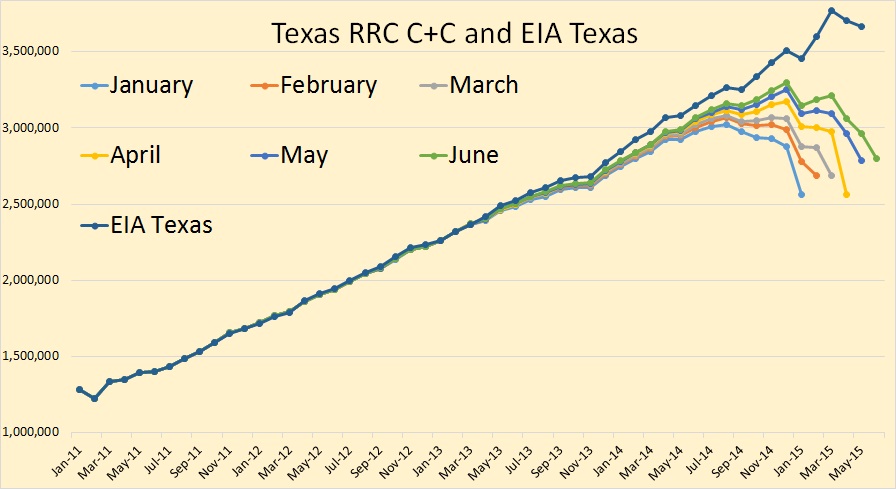
Increased oil output in the US has kept World oil output from declining over the past few years and a major question is how long this can continue. Poor estimates by both the US Energy Information Administration (EIA) and the Railroad Commission of Texas (RRC) for Texas state wide crude plus condensate (C+C) output make it difficult to predict when a sustained decline in US output will begin.

 About 80 to 85% of Texas (TX) C+C output is from the Permian basin and the Eagle Ford play, so estimating output from these two formations is crucial. I have used data from the production data query (PDQ) at the RRC to find the percentage of TX C+C output from the Permian (about 44% in Feb 2015) and Eagle Ford plays (40% in Feb 2015).

Dean’s estimates of Texas C+C output are excellent in my opinion and are close to EIA estimates through August 2014. I used EIA data for TX C+C output through August 2014 and Dean’s best estimate from Sept 2014 to Feb 2015. By multiplying the % of C+C output from the RRC data with the combined EIA and Dean estimate, I was able to estimate Eagle Ford and Permian output. The chart below shows this output in kb/d.

  
blog150427/

Read More