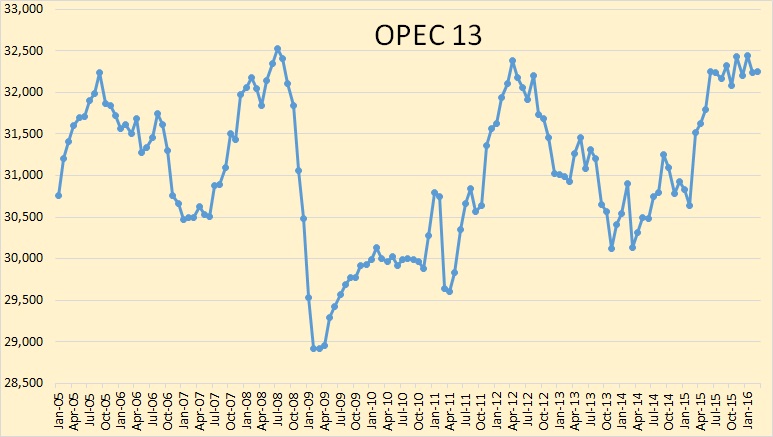
Baker Hughes recently published their International Rig Count. This rig count is at the end of April. It does not include the US, Canada, any of the FSU countries or inland China. The count includes both oil and gas rigs.
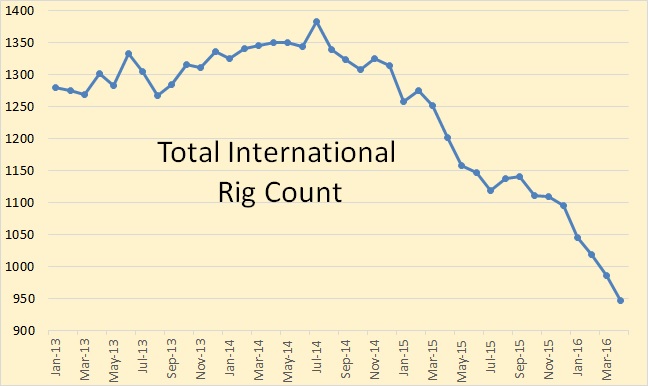
Total International Rigs stood at 946 in April, down 39 for the month and down 436 rigs since the latest peak in July 2014.
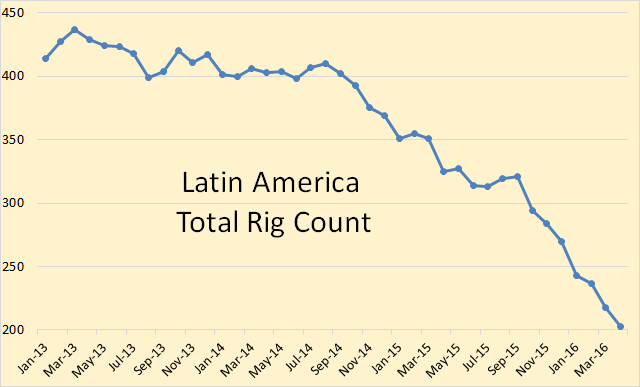
The Latin America rig count stood at 203 in April, down 15 rigs since April and down 204 since July 2014.
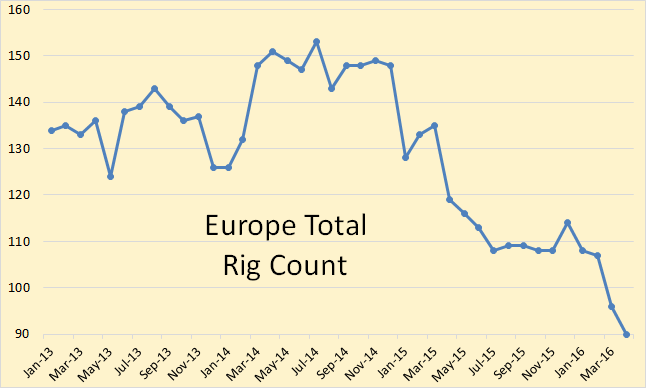
Europe rig count stood at 90 in April, down 6 in the last month and down 63 since July 2014.
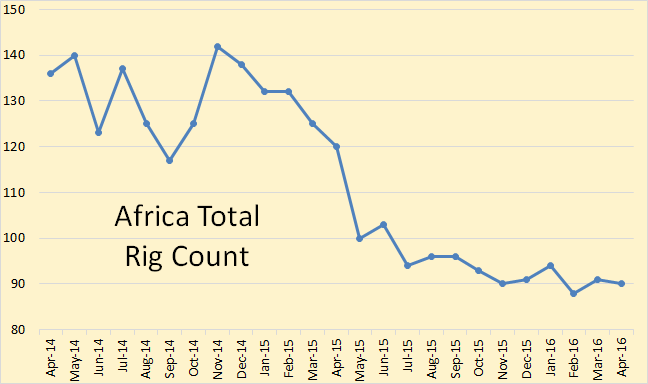
African rigs seem to have leveled out. They stood at 90 in April, down only 1 from March. Africa’s latest peak was in November 2014 and they are down 52 from that point.
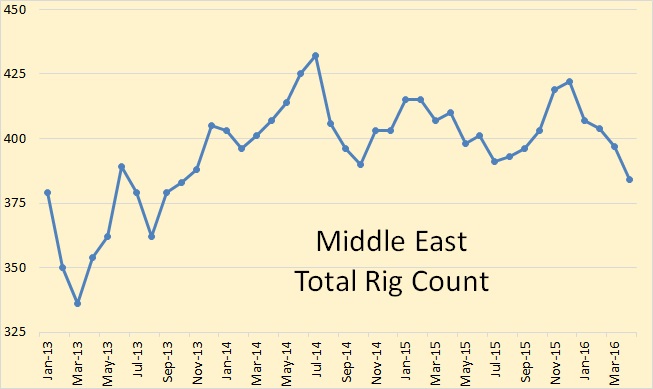
The Middle East rig count had been holding steady but dropped 13 rigs in April. That is down 48 rigs since their latest peak in July 2014.
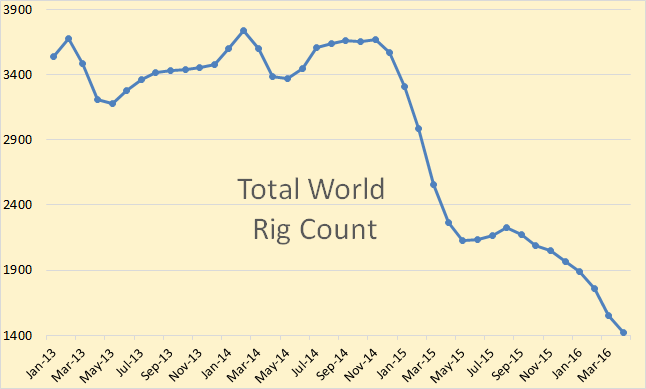
Baker Hughes’ total world rig count is just their total international rig count plus the US and Canada. It still does not include any FSU countries or inland China. The total world rig count did not start dropping until after November 2014 when it stood at 3,670 rigs. It is down 2,246 rigs since then and now stands at 1424 rigs after dropping 127 rigs in April.
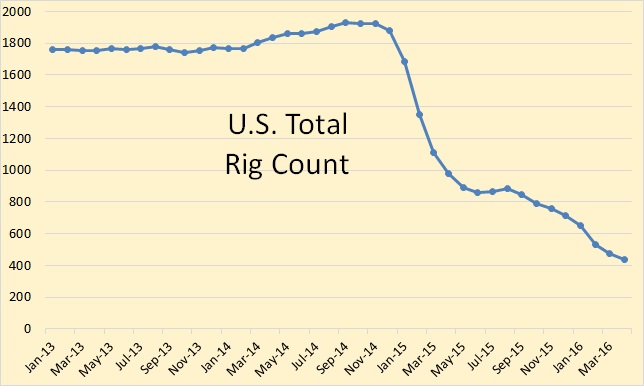
The US monthly rig count dropped 41 rigs from March to April and now stands at 437. The Count stood at 1,925 in November 2014 and is down 1,488 rigs since that point.
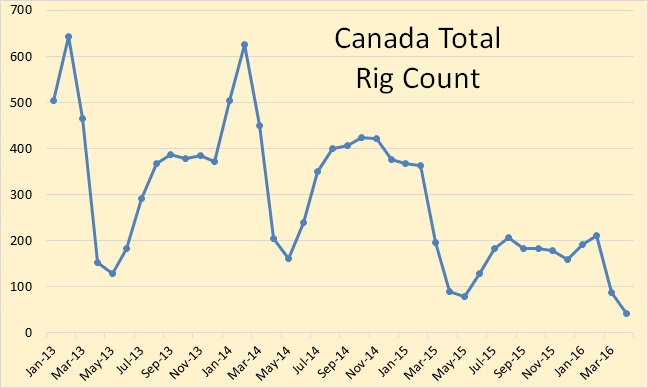
The Canadian rig count is highly seasonal and usually peaks in February. The last normal February peak was in 2014 when it peaked at 626 rigs. The 2016 February peak was 211 rigs. The March to April decline was 47 rigs and their total rig count now stands at just 41 rigs.
